
We identify a signal based on a deviation from expected inflation that investors can use to dynamically tilt the asset allocations in their portfolios. We call this metric the inflation cycle signal. This approach is relevant when inflation is rising unexpectedly or falling unexpectedly.
Using two different return attribution methods, we find the approach benefits from higher tactical allocations to inflation-sensitive asset classes and to US core bonds when profitable to do so.
Anyone managing a long-only portfolio has had few places to hide this year. With year-over-year inflation topping 8% through most of 2022, discussing the impacts of high inflation is too little, too late. Instead of focusing on the level of inflation, we show the benefits of dynamically tilting portfolio allocations during periods when inflation is out of line with expectations. The approach we describe is just as relevant when inflation reports are falling as when they are rising.
Create your free account or log in to keep reading.
Register or Log in
Quick Glance in the Rearview Mirror
In the first two quarters of 2022, of 10 broad asset classes,1 all but commodities have negative returns. Likewise, investors who have come to bank on the hedging properties of the 60/40 portfolio in equity-market drawdowns have been grossly disappointed. Normal inflation hedges such as TIPS and REITs have also underperformed, even in nominal terms.
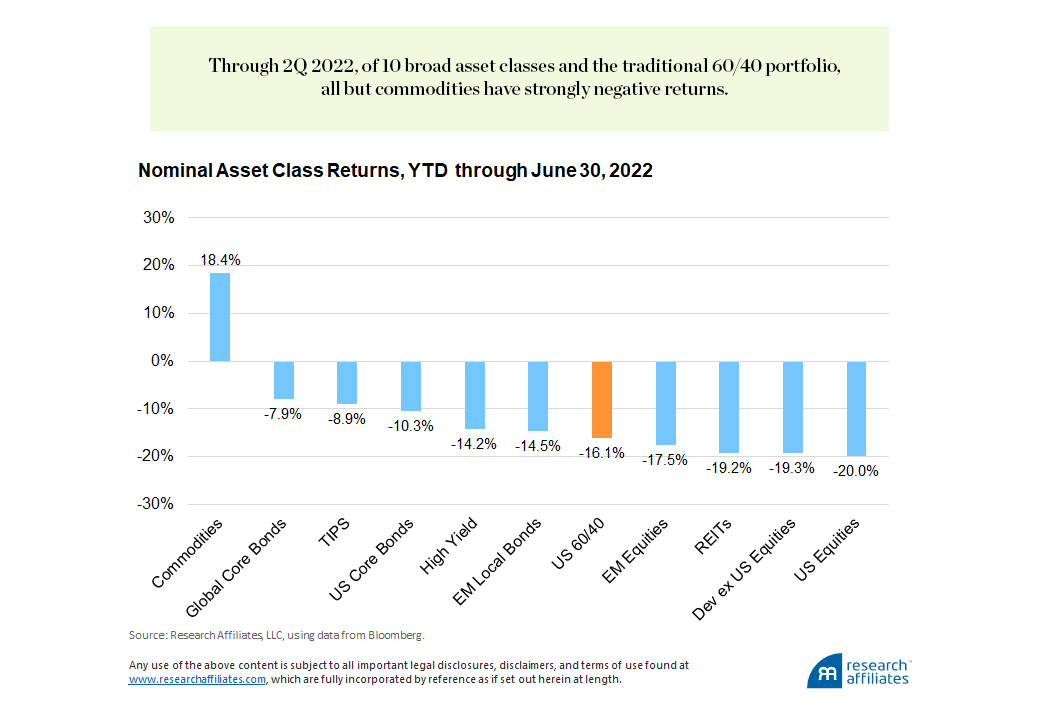
These results are useful for context, but the real question is: How can investors mitigate the inflationary impacts on their portfolios in the future? Investors can 1) simply do nothing, 2) introduce structural weight adjustments to the portfolio, or 3) incorporate a signal for tactical asset allocation.
Believe it or not, option 1 may be a viable strategy, especially for those with a very long time horizon; if you are one of those investors, you can probably stop reading. Option 2 requires an investor to change structural portfolio allocations to tilt toward inflation-sensitive assets. Doing so means having a structural overweight to assets such as commodities, REITs, and TIPS. In an environment like the first half of 2022, that type of portfolio would outperform, but during the low-inflation 2010s it would have struggled to keep up.
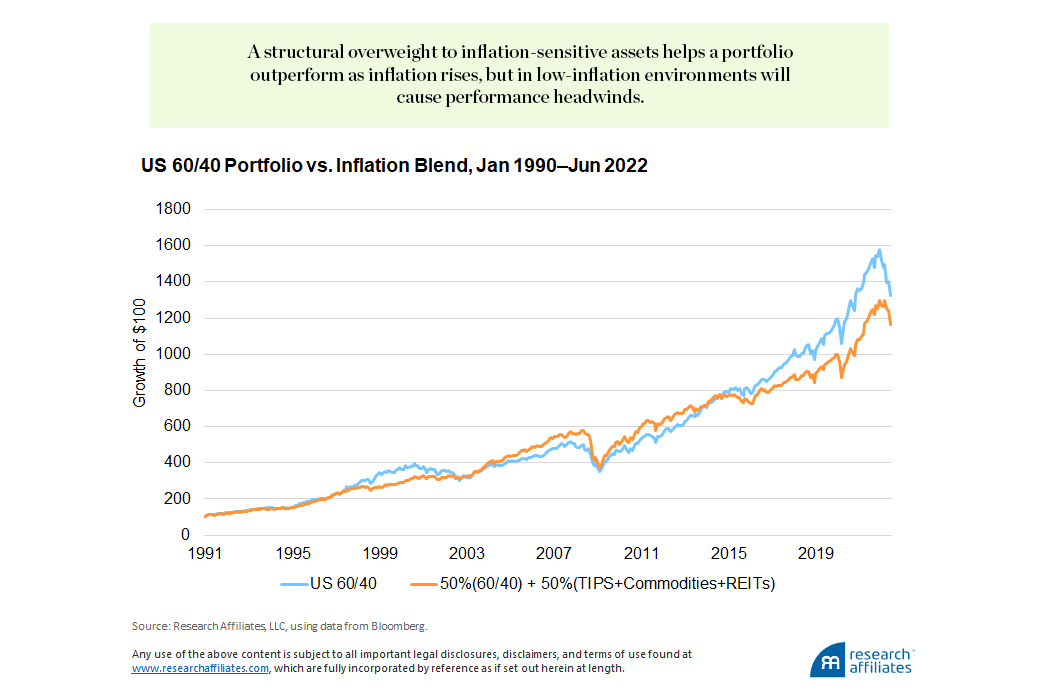
Option 3, a mechanism to adjust portfolio holdings for changes in inflation, and more specifically, unexpected changes in inflation,2 is the approach we focus on in this article.
The inflation cycle metric specifies unexpected inflation.
”The Inflation Cycle Metric
About a year ago, Masturzo and Mazzoleni (2021) (MM2021) documented that the lion’s share of the S&P 500 Index’s positive returns since January 1948 occurred in periods when inflation surprised to the downside. They quantify a deviation in inflation expectations by defining both a short-term and a long-term metric.3 We extend that analysis, focusing specifically on the long-term metric and applying it as a mechanism to adjust allocations in a diversified portfolio of asset classes.
Instead of starting our analysis with the standard 60/40 stock and bond portfolio, we start with a very simple, equally weighted, 10-asset-class portfolio represented by the following indices:
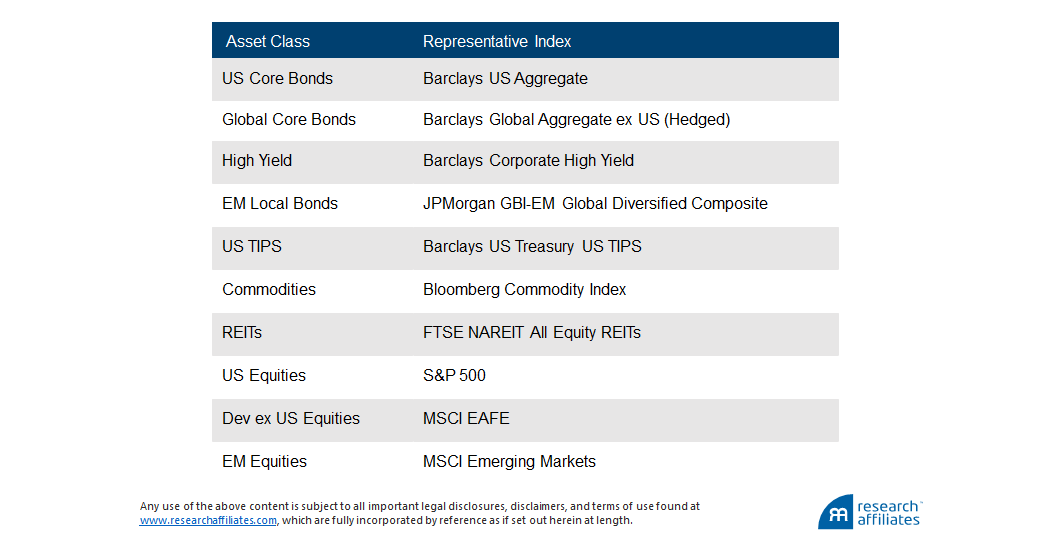
In addition to being more diversified than the 60/40 portfolio, our starting portfolio has a ready-made allocation to inflation-hedging assets and therefore provides a convenient comparison to a portfolio with a structural inflation allocation (option 2).
Inflation “Un”-Expectations
Masturzo and Mazzoleni use the term inflation cycle to describe a longer-term deviation relative to trend inflation. The way Masturzo and Mazzoleni define trend inflation, an exponentially weighted moving average (EWMA) of the year-over-year percentage change in All Items CPI, is quite similar to the inflation expectations published by the Survey of Professional Forecasters as the 10-Year CPI Inflation Rate (CPI10).
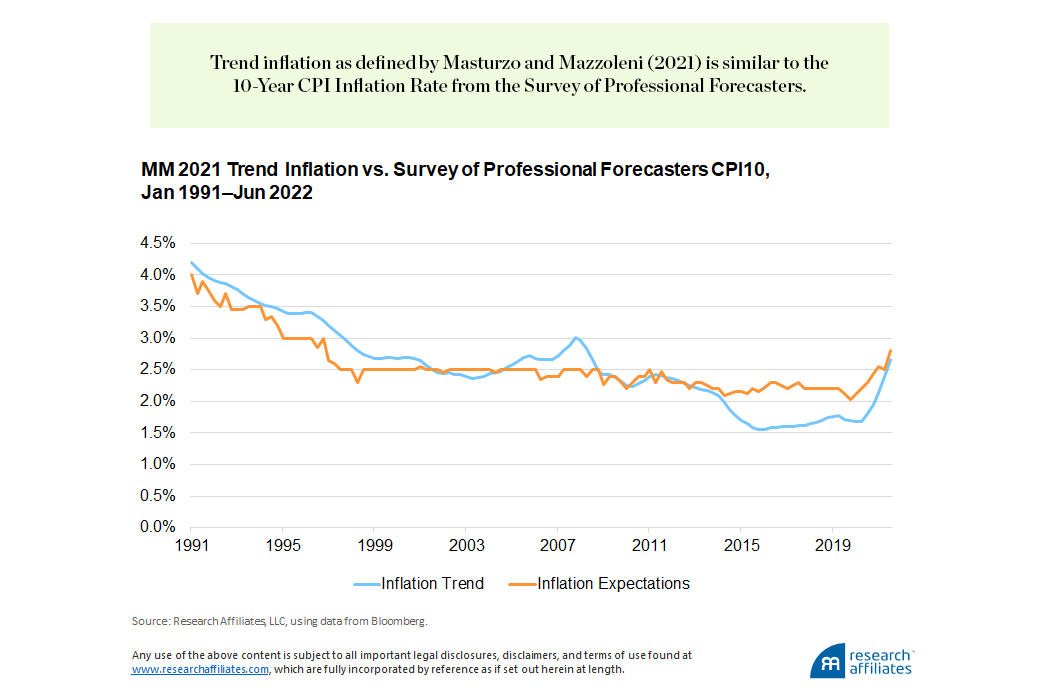
We follow the definition of MM 2021 to calculate the inflation cycle metric, using the EWMA with a 5-year half-life over a 10-year rolling window,
Inflation Cycle = Current Inflation Rate – EWMA of Past Inflation Rates
Thus, the inflation cycle metric specifies unexpected inflation.
How to Use the Inflation Cycle Signal
Unlike asset fundamentals, such as price-to-earnings (P/E) ratios, which are asset specific (i.e., each stock has a unique P/E ratio), using macroeconomic signals in portfolio construction requires a mapping of the macro signal to each individual asset. We can do this via a simple linear regression of the asset return on the lagged inflation cycle in order to determine the sensitivity (beta) of the asset to the signal,
\(r_{i,t}=a_{i}+\beta_{i}InflationCycle_{t-1}+\epsilon_{i,t}\)
This regression is predictive in the sense that we control for the fact that inflation is released with a lag. For example, if we were estimating the sensitivity of an asset’s return in August, we would use the July inflation rate because the August inflation rate is not available until September. In addition, we re-estimate the betas each month using a rolling 10-year window, which allows us to capture economic shifts over time.
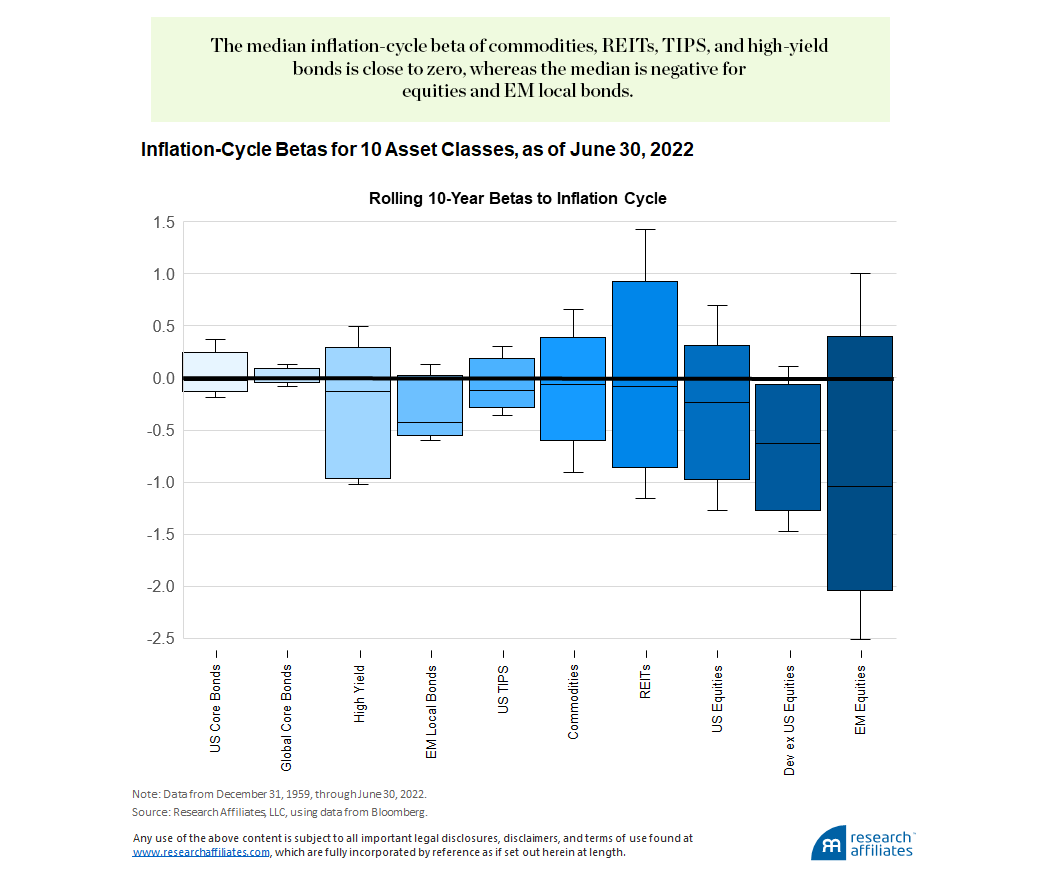
The median inflation-cycle beta is negative for most asset classes, but close to zero for inflation-sensitive assets such as commodities, REITs, and TIPS. Consistent with MM2021, the sensitivity to unexpected higher inflation, on average, is negative for equities. Possibly surprising is the fact that US core bonds often have positive sensitivity (higher returns) to unexpected higher inflation. This relationship appears to be consistent with unexpected higher inflation pushing markets into a risk-off posture.
Armed with our asset-class inflation betas and the current value of the inflation cycle, we compute a signal for each asset by multiplying the two values together,
\(s_{i,t}=\beta_{i} InflationCycle_{t-1}\)
We then rank the 10 assets from highest to lowest signal value.
To create a portfolio we assign equal capital to each of the five assets with the highest signal values and keep the other five assets at zero exposure. The result is a long-only portfolio, which we call the Raw Inflation Cycle (IC) portfolio. We compare the Raw IC portfolio to the equally weighted 10-asset portfolio and to the 60/40 portfolio with a structural inflation tilt. The Raw IC portfolio is equivalent to creating a long−short portfolio with 100% gross/0% net exposure with a positive allocation to the highest ranked assets and negative allocation to the other assets, then adding the long–short portfolio to the equally weighted benchmark. The following table compares the characteristics of these three portfolios:
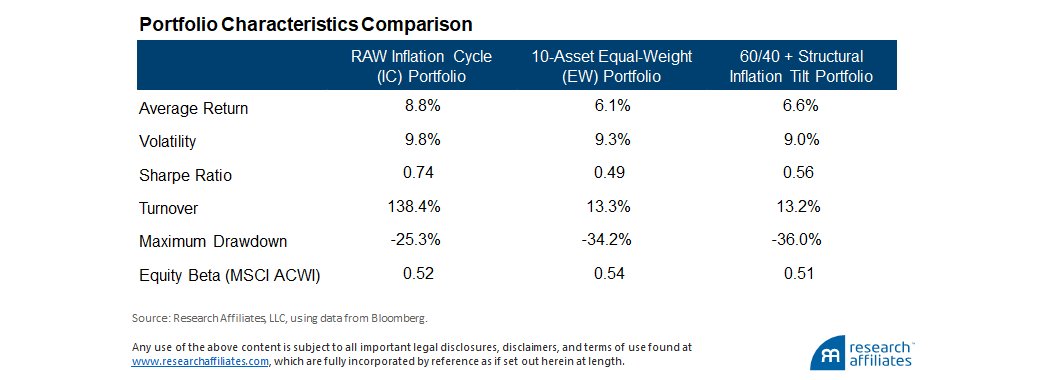
The comparison of the Raw IC portfolio to the equally weighted 10-asset portfolio shows a 50% increase in the Sharpe ratio (from 0.49 to 0.74) due to a 2.7% increase in average return (from 6.1% to 8.8%) with only a 0.5% increase in volatility (from 9.3% to 9.8%). In addition, the Raw IC portfolio has a lower maximum drawdown (−25.3% versus −34.2% for the 10-asset portfolio), while maintaining nearly the same equity beta (0.52 versus 0.54 for the 10-asset portfolio). The results are similar when we compare the Raw IC portfolio with the 60/40 portfolio with the structural inflation tilt.
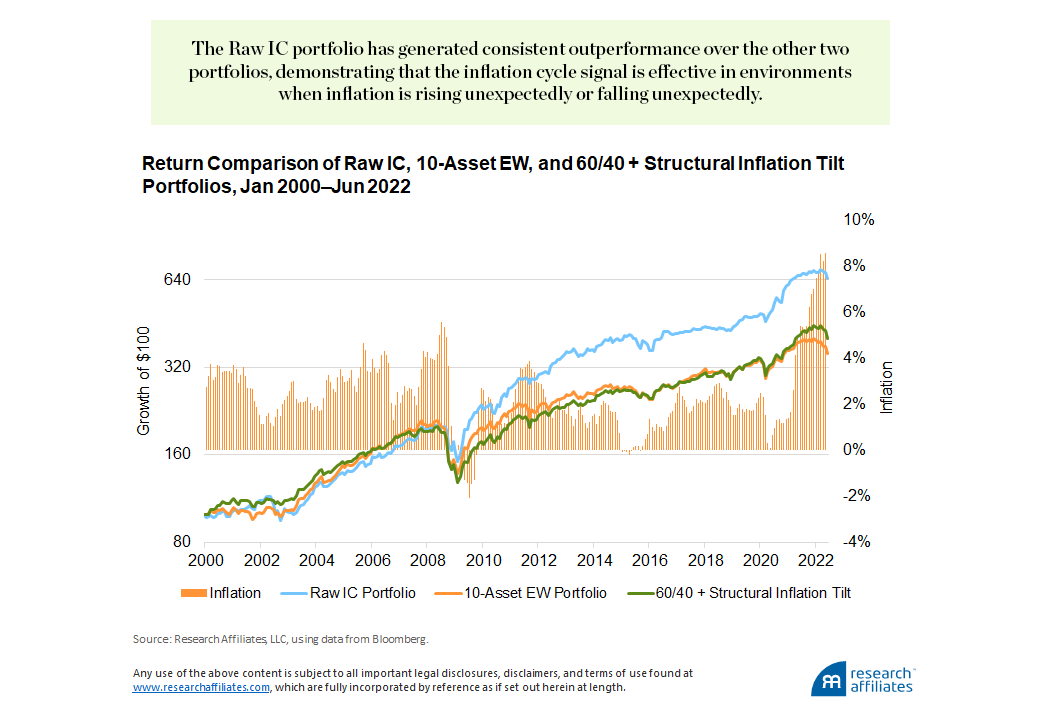
Since January 2000, the Raw IC portfolio has generated consistent outperformance over the other two portfolios. This result shows that the inflation cycle signal can capture the differences between realized inflation and expected inflation and is thus effective in environments when inflation is rising unexpectedly or falling unexpectedly.
The inflation cycle signal can capture the differences between realized inflation and expected inflation and is thus effective in environments when inflation is rising unexpectedly or falling unexpectedly.
”
As is often the case, performance benefits do not come without associated costs, and the displayed results are no exception. The benefits in performance and downside protection generated by the Raw IC portfolio require a tenfold increase in turnover compared to the two alternative portfolios, and investors are justly wary about the hidden costs of high turnover.
Before we address the higher turnover in the Raw IC portfolio, let’s establish two facts. First, the 13% turnover of the 10-asset portfolio is extremely low and most investors can sustain higher levels. Second, turnover in the Raw IC portfolio comes from a change in sign of the inflation cycle signal as well as a change in asset class betas.
A straightforward way to limit turnover is by putting a band around the inflation cycle such that small movements around zero do not generate turnover. We choose an even simpler alternative, however.
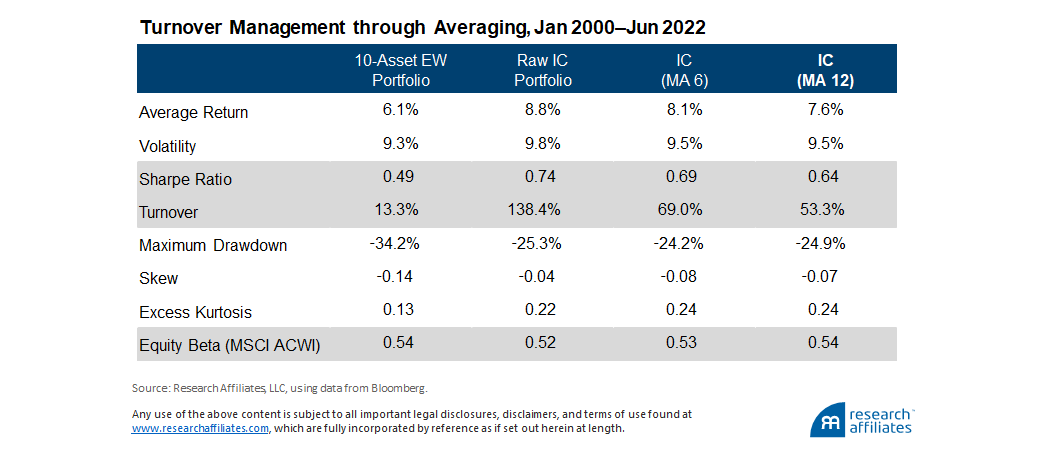
Instead of focusing on the signal or the betas, we partially rebalance using a moving average of past Raw IC portfolio weights. First, we create the Raw IC portfolio as previously described. Then, we rebalance using a moving average of the weights of the Raw IC portfolio over the past N months (e.g., 6 or 12 months).
In this approach, portfolio allocations are adjusted over time, which creates a drag on the performance gain attainable in the Raw IC portfolio, but also greatly reduces turnover. In fact, using a 12-month moving average to create the IC (MA 12) portfolio reduces portfolio turnover by 60% relative to the Raw IC portfolio, while only lowering the Sharpe ratio by 0.1 and maintaining the drawdown benefits.
What Drives the Excess Return of the IC Portfolio?
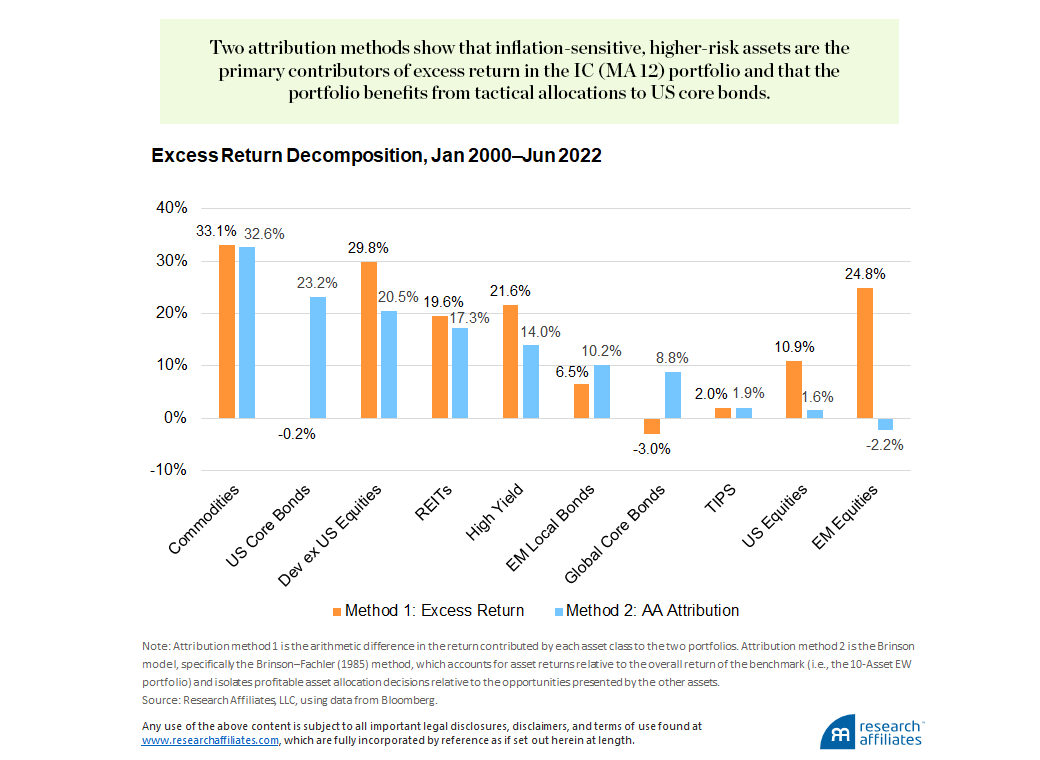
Over the sample period (January 2000 through June 2022), the IC (MA 12) portfolio outperformed the 10-Asset EW portfolio by 1.5% a year. To determine what asset allocations advantaged the IC portfolio, we can decompose the return drivers in two different ways.
First, we can take the arithmetic difference in the return contributed by each asset class to the two portfolios. This method shows large excess return coming from commodities (33.1%), developed ex US equities (29.8%), REITs (19.6%), and high-yield bonds (21.6%). From this perspective we see the inflation cycle signal earns its returns from high-risk assets without increasing the portfolio’s equity beta over time.
A second approach is to decompose the returns of the two portfolios using the Brinson model, specifically the Brinson–Fachler (1985) method, which accounts for asset returns relative to the overall return of the benchmark (i.e., the 10-Asset EW portfolio) and isolates profitable asset allocation decisions relative to the opportunities presented by the other assets. Because both portfolios hold the same assets, excess return attributed to security selection is zero. The decomposition to asset allocation return, however, yields interesting results. The Brinson decomposition shows that the IC (MA 12) portfolio not only profits from inflation-sensitive assets, but also tactically allocates to US core bonds when profitable to do so. Armed with this information, we can take a closer look at timing.
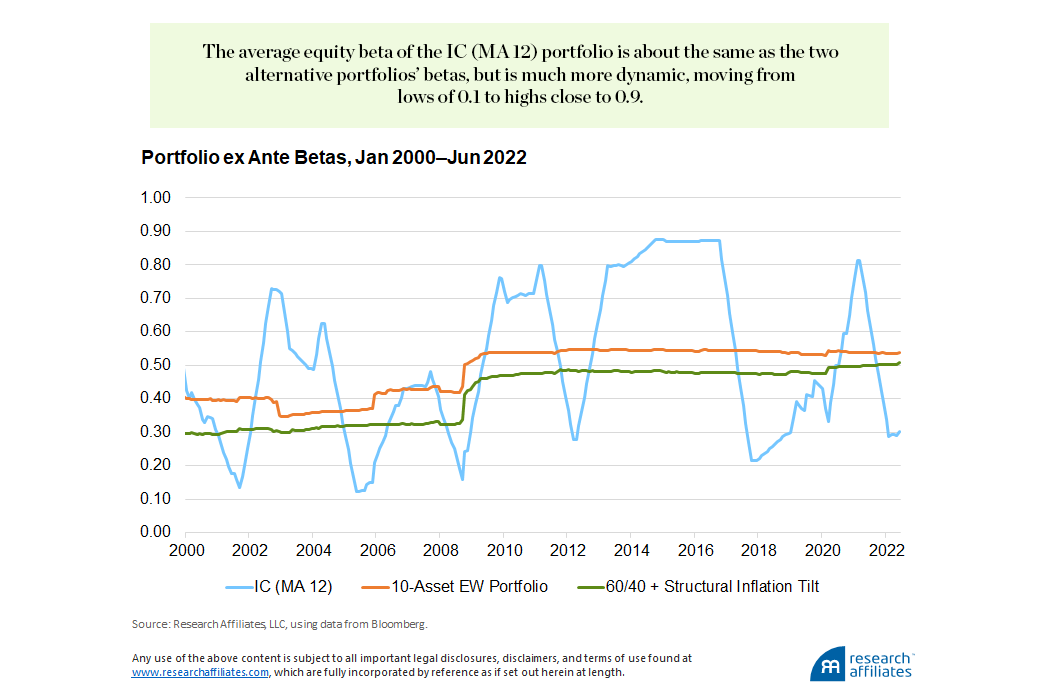
Although the IC (MA 12) portfolio outperforms the two alternative portfolios—equally weighted and structural inflation tilted—over our sample period, this does not prove the inflation cycle signal is an effective tactical asset allocation tool. To examine that question, let’s compare the rolling beta of each of the three portfolios.
We have already demonstrated that the full-period realized equity beta of the portfolios is very similar: 0.54 for the IC (MA 12) portfolio, 0.54 for the 10-Asset EW portfolio, and 0.51 for the 60/40 plus structural inflation tilt portfolio. Now we will focus on the portfolios’ ex ante equity beta (relative to the MSCI All Country World Index), an estimate of the future equity beta of the portfolio based on the current holdings at each point in time. From January 2000 through June 2022, the average equity beta of the IC (MA 12) portfolio is about the same as the two alternative portfolios’ betas, but is much more dynamic, moving from lows of 0.1 to highs close to 0.9.
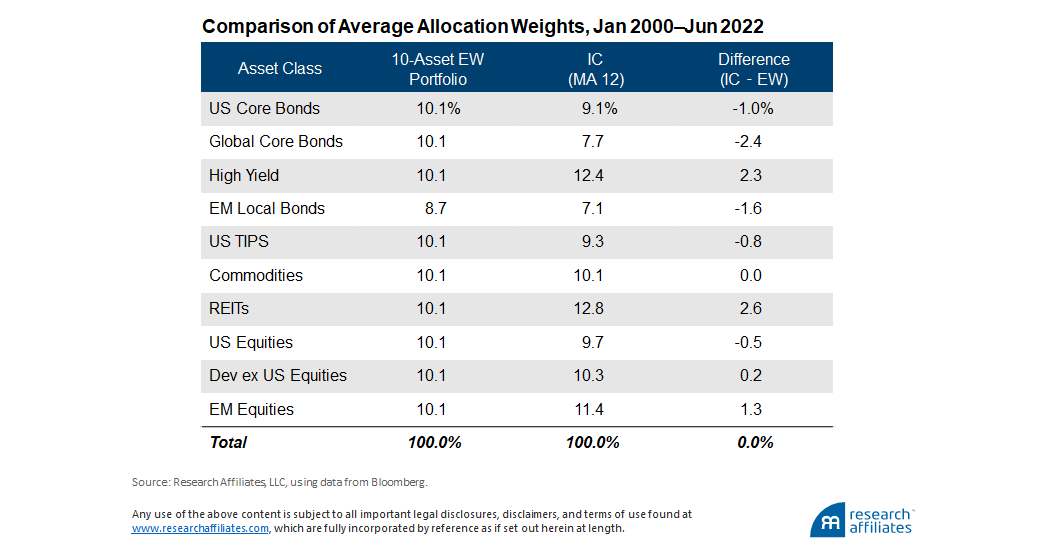
Across the entire backtest period, the average weights of the IC (MA 12) portfolio, whose asset allocations are dynamically changing, are remarkably similar to those of the equally weighted benchmark. Therefore, the source of the IC portfolio’s value-add must be through the beneficial timing of its allocations, rather than its structural exposures.
We quantify this by decomposing the return into its static and dynamic components from the following identity:
\(\underbrace{E\left[w_{t}r_{t+1}\right]}_{\text{Portfolio Return}}=\underbrace{E\left[w_{t}\right]E\left[r_{t+1}\right]}_{\text{Static Return}}+\underbrace{cov(w_{t},r_{t+1})}_{\text{Dynamic Return}}\)
The identity states that the return of a portfolio with weights is driven by a static return component due to its average allocations and a dynamic return component driven by the co-movement of allocations with the next period’s asset returns. The equally weighted portfolio and the three IC portfolios all have a very similar static-component return, consistent with the fact they all have similar average weights. The outperformance of the IC portfolios is thus coming from beneficial market timing.

A TAA Signal for Inflationary Times
As you read this article, inflation may still be rising or maybe it has already peaked. Either scenario has impacts on our portfolios. We find that using the inflation cycle metric, which identifies a deviation in longer-term expected inflation, provides a dynamic tilting mechanism that allows investors to profit from inflation surprises both to the upside and to the downside. Unto itself, the inflation cycle signal requires a lot of additional turnover, however, through a simple partial rebalancing mechanism, we show that turnover can be contained without sacrificing the entirety of excess return.
Endnotes
- US equities, developed ex US equities, EM equities, US core bonds, global core bonds, high-yield bonds, TIPS (Treasury Inflation-Protected Securities), EM local bonds, REITs, and commodities.
- Markets are generally efficient to widely known information such that expected changes in inflation are “immediately” reflected in asset prices.
- Masturzo and Mazzoleni (2021) distinguish an inflation cycle as indicative of longer-term trends in the growth rate of inflation (a long-memory series) whereas an inflation surprise, the short-term metric they specify, reflects “news” about inflation dynamics. They provide formal definitions of these signals in Appendix A of their article.
References
Brinson, Gary, and Nimrod Fachler. 1985. “Measuring Non-US Equity Portfolio Performance.” Journal of Portfolio Management, vol. 11, no. 5 (Spring):73–76.
Masturzo, Jim, and Michele Mazzoleni. 2021. “Predicting Equity Returns with Inflation.” Research Affiliates Publications (August).


