False Choices, Real Costs: Structural Flaws in the Growth–Value Duality
This article is a companion to the longer article Fundamental Growth on SSRN.
The predominant methodology of style-box indexes creates a false duality in which growth and value are opposing ends of a single spectrum.
This conventional wisdom forces an anti-growth bias into value indexes and an anti-value bias into growth indexes, at significant cost to investors.
We propose an alternative that defines growth based on fast business growth regardless of valuation ratios and defines value as cheap regardless of growth rates.
Just as the RAFI™ Fundamental Index reframed value by stripping out its anti-growth bias, we propose that growth indexes be decoupled from the flawed presumption that high valuation defines growth.
“Every search for a hero must begin with something that every hero requires—a villain”—so says the tragic character Dr. Nekhorvich in the movie Mission: Impossible II. The line is one of the most memorable in the film because it reflects an all-too-human tendency to see the world as a duality. Where there are heroes, there must be villains. Where there is light, there must be darkness.
Create your free account or log in to keep reading.
Register or Log in
It's even true in modern finance.
A predominant duality of the investment world defines “value” and “growth” as opposites. Today’s value and growth “style box” indexes, such as those provided by Russell, MSCI, and S&P, constrain themselves to this duality. The system imposes a zero-sum logic: for a stock to be value, it must not be growth, and vice versa. We question whether this dichotomy—where fast-growing companies must have expensive stocks and slow-growing companies must have cheap stocks—is a requirement or a costly false choice.
Standard value and growth style indexes categorize stocks based on a composite signal that combines valuation (cheap vs. expensive) and growth (fast vs. slow) metrics. Based on the strength of this signal, stocks end up in the value index, the growth index, or partially included in both boxes. This methodology allocates cheap stocks of slow-growing (or shrinking) companies to the value index and allocates expensive stocks of fast-growing companies to the growth index. Cheap fast-growing stocks and expensive slow-growing stocks may be allocated to both, with their market cap allocated partially to each.
In our recent article “Must Value Be Anti-Growth?” we show that constructing a value index to be agnostic to growth (rather than targeting low growth) results in a strategy—the RAFI™ Fundamental Index—that we believe offers superior structural returns relative to standard value indexes while retaining value characteristics. But what about the other side of this duality? Just as value need not be anti-growth, growth need not be anti-value. If we can build a value index without an anti-growth bias, can we build a growth index without an anti-value bias?
Just as value need not be anti-growth, growth need not be anti-value. If we can build a value index without an anti-growth bias, can we build a growth index without an anti-value bias?
”Genesis of the Growth/Value Binary Choice
The growth and value indexes launched by Russell in 1987 are the earliest and best-known style-box indexes. Following widespread practitioner use of the book-to-price valuation ratio (B/P) and influential research (such as Rosenberg, Reid, and Lanstein 1985), Russell used B/P to divide the market in half. The resulting indexes were originally intended for benchmarking active managers who specialized in growth or value investing and not explicitly designed as investment vehicles.
Russell evolved their style box methodology over time. Initially, the growth and value portfolios representing each style were mutually exclusive. In the early 1990s, Russell supplemented B/P with five-year historical sales growth and IBES two-year forecasted earnings growth and combined these into a composite signal to distinguish value and growth. In another refinement, Russell introduced an overlapping region of the market for stocks with weak composite signals. This region includes expensive stocks of slow-growing (or shrinking) companies and cheap stocks of fast-growing companies, with their market capitalizations assigned partially to growth and partially to value index.
Since the beginning, a key feature of these original style indexes has been the completeness property. The two style indexes must cover the entire market so that an equal allocation to the two matches the overall cap-weighted market index. The completeness property requires that growth and value styles be opposing ends of a single spectrum. This forces an anti-growth bias for the value index and an anti-value bias for the growth index, which imposes a significant cost on investors, as we illustrate later.
FTSE, MSCI, and S&P introduced their style indexes over time. While there are some variations among these indexes, such as the specific valuation ratios and growth metrics used, they remain largely consistent in their basic methodology. Like Russell, each style index series classifies stocks based on a blend of valuation and growth metrics. Also like Russell, these indexes are constrained to the completeness property.
In addition, both Russell and S&P have launched “pure” style indexes, which have no overlap in their holdings and don’t conform to the completeness property. The Russell Pure Style Indexes continue to classify stocks using a composite signal that blends value and growth measures, thus preserving the anti-value bias for growth and vice versa for value. In contrast, S&P Pure Style Indexes use only growth signals for the growth index and value signals for the value index. But the requirement of no overlap means that cheaply priced fast-growing stocks are excluded from appearing in both indexes. This omission is costly—because cheap fast-growing stocks are exactly the kind that both value and growth investors want most!1
Disentangling Growth and Value Characteristics
Following influential work by Rosenberg, Reid, and Lanstein (1985) as well as Fama and French (1993), B/P became the dominant valuation metric across both academia and industry.2 Today’s index providers have evolved their valuation metrics to include a broader array of ratios, such as price to earnings, cash flow, dividends, and sales. Likewise, growth metrics used by index providers today are multidimensional, ranging from sales growth to price momentum. Our discussion focuses on B/P and sales growth for the sake of simplicity.
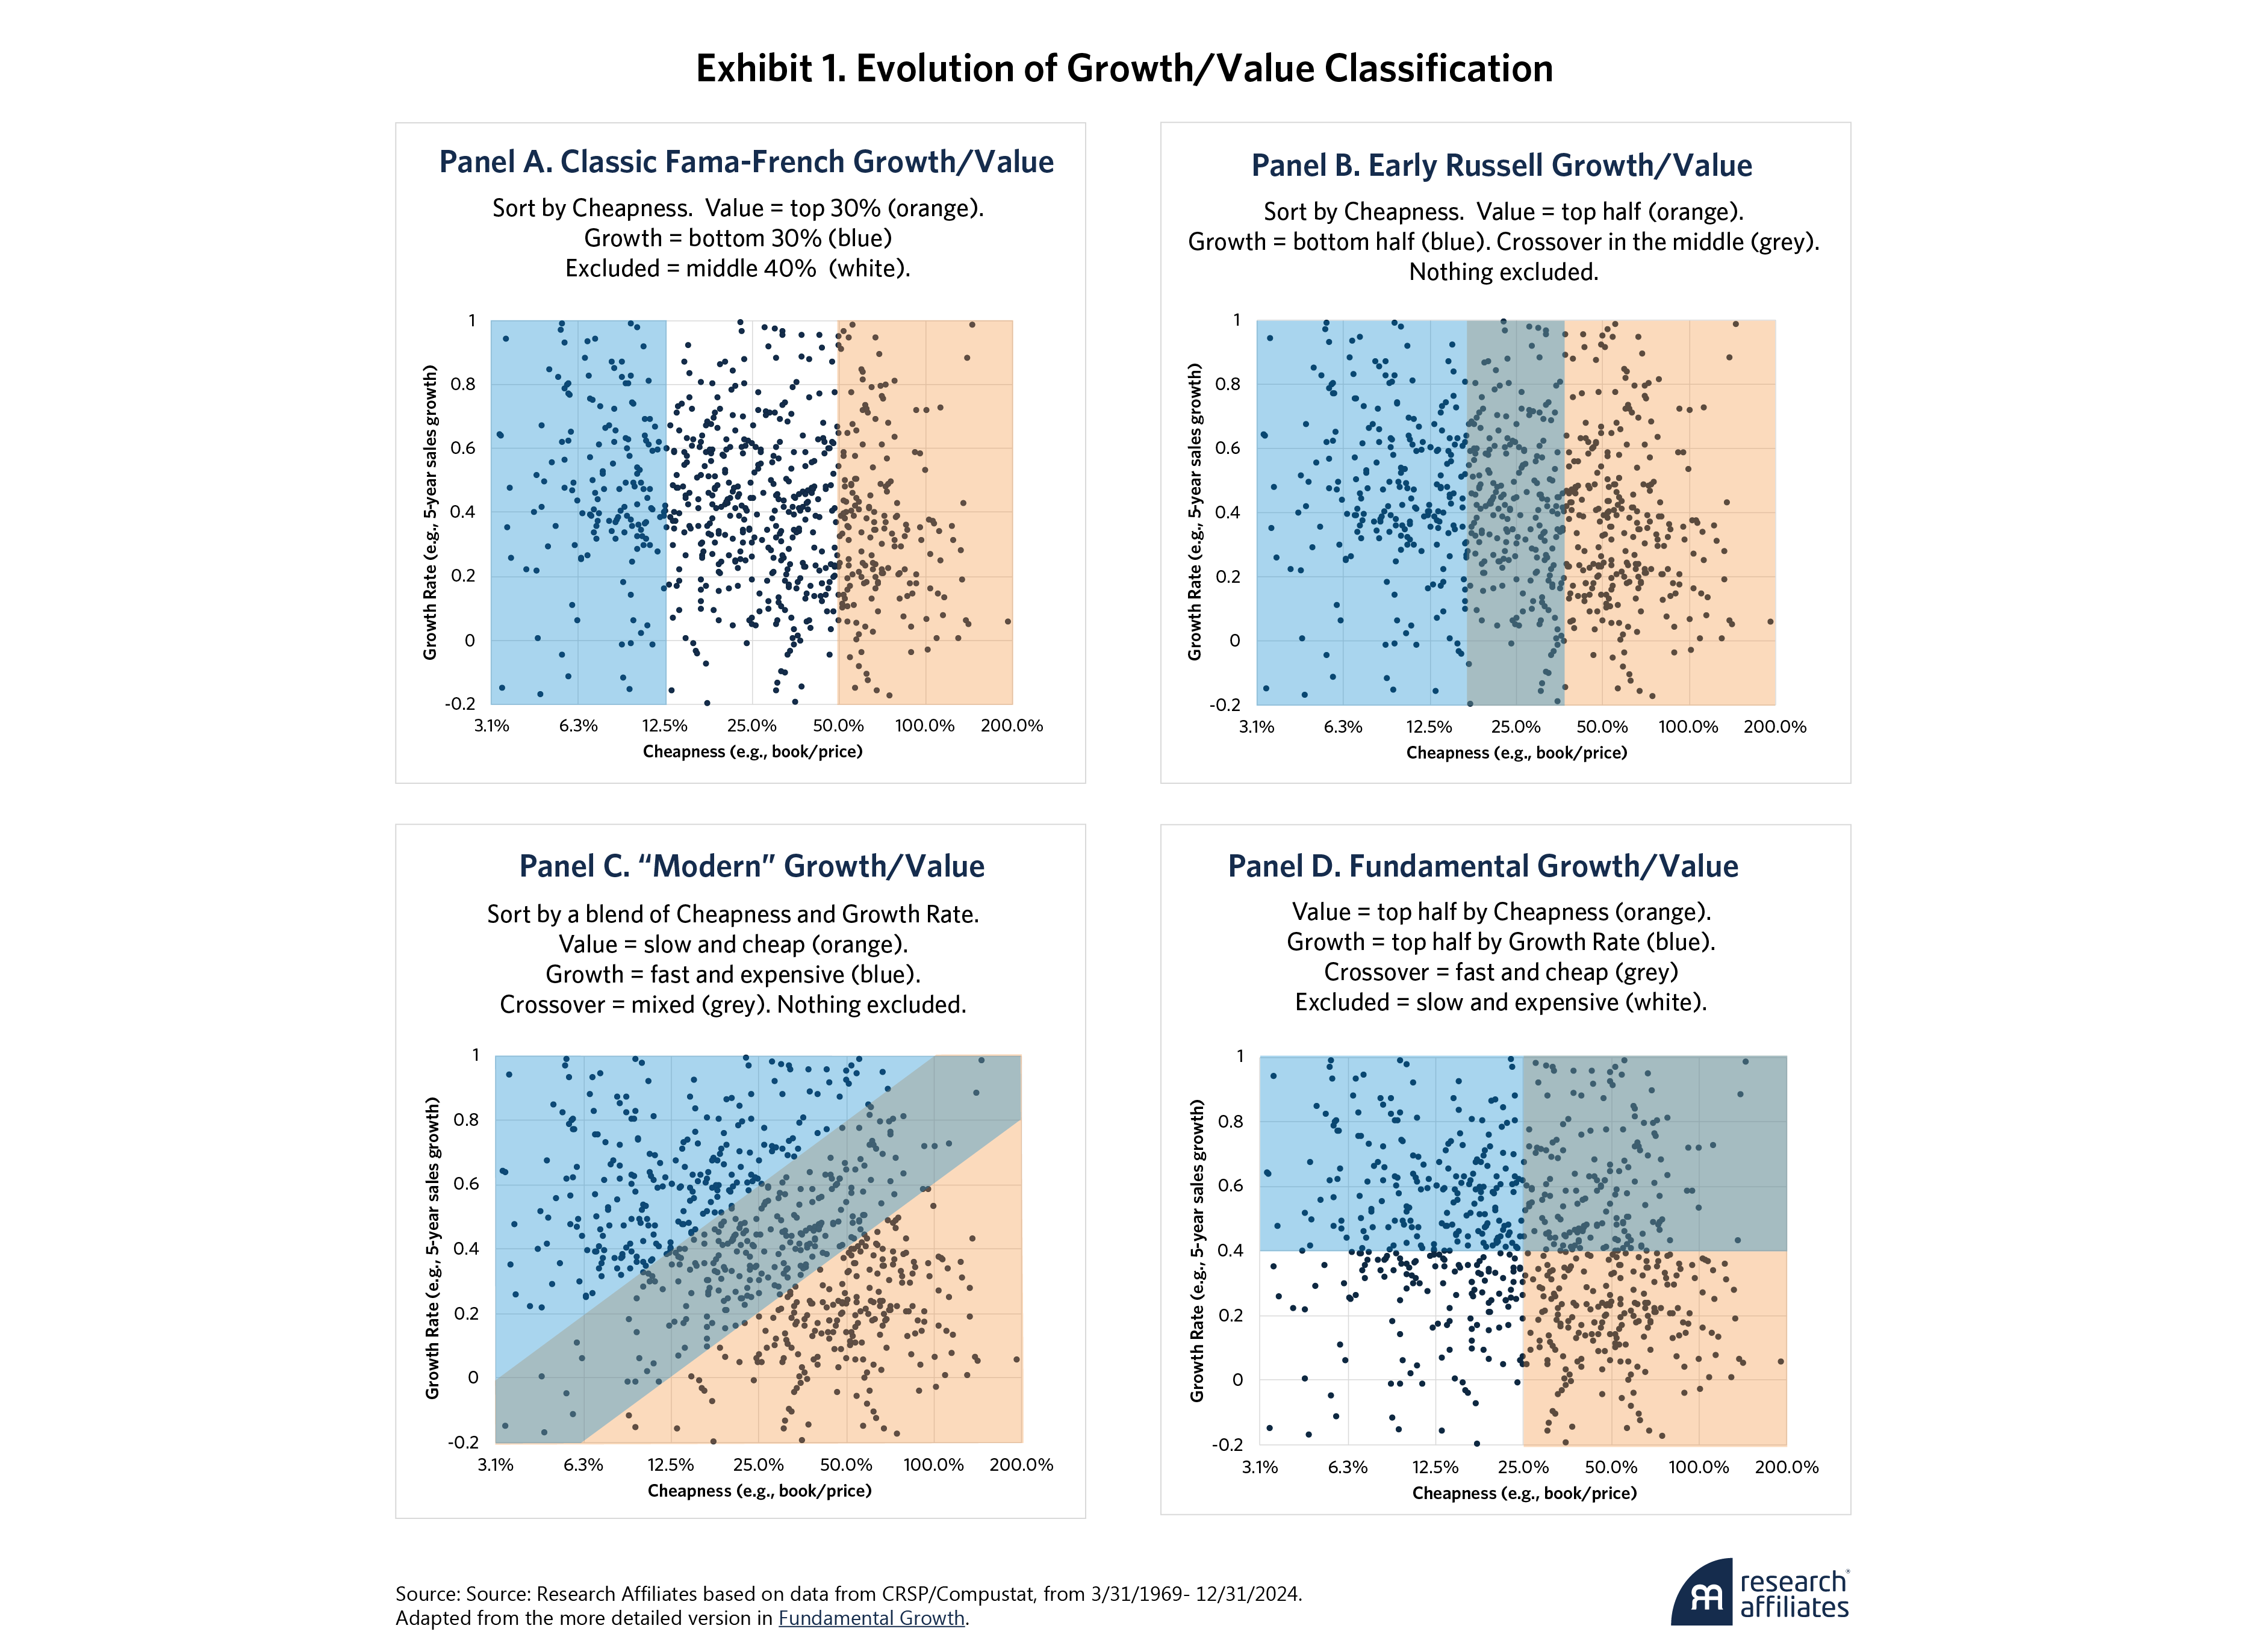
Exhibit 1 illustrates the shift from earlier growth/value classifications to today’s growth/value classification (which dominates current style boxes) to our proposed framework for disentangling growth and value characteristics.
In the earliest index formulations (Panels A and B), growth meant expensive and value meant cheap, typically based on B/P. Stocks were put into three buckets: growth, value, and overlap stocks with a bit of both. The market capitalization of the overlap stocks was allocated partly to the growth portfolio and partly to the value portfolio. This structure ensured the completeness property, and equal allocations to growth and value indexes replicated the full market.
As shown in Panel C, today’s standard—true for Russell, MSCI, S&P, and FTSE—looks for some combination of fast growth and high valuation multiples to populate the growth universe and some blend of slow growth and cheap valuation multiples to define value. The duality is preserved—stocks must be growth, or value, or a blend.
We argue that this duality is unnecessary and, as we will soon see, harmful to investors in products that track style indexes. Our proposed approach defines growth as fast growing regardless of valuation ratios and defines value as cheap regardless of growth rates. After all, who wants to buy a stock that is expensive and offers lousy growth prospects?
Our proposed approach defines growth as fast growing regardless of valuation ratios and defines value as cheap regardless of growth rates. After all, who wants to buy a stock that is expensive and offers lousy growth prospects?”
”Measuring the Performance Penalty
Index providers’ insistence on style duality has a cost. It forces investors holding style index products to own stocks of expensive, slow-growing companies. Disentangling growth from value isn’t just cleaner. It’s smarter.
To illustrate, we conducted a backtest of four mutually exclusive portfolios represented by the blue, grey, orange, and white areas in Panel D of Exhibit 1. In March of each year from 1969 through 2024, US stocks are sorted into these four portfolios, using B/P to measure valuation and five-year sales-per-share growth to measure growth. Stocks were assigned according to whether each signal was above or below the cross-sectional median, and the portfolios were market-cap weighted.3
We also backtest broad-market and standard growth/value style portfolios as reference benchmarks. The broad-market benchmark includes the top 1,000 US companies by market capitalization (CW 1000) and is rebalanced annually. The style benchmarks (CW Growth and CW Value) decompose the CW 1000 following a simplified Russell style methodology, assigning stocks based on a composite score of the same signals used in our quadrant portfolios: B/P and five-year sales-per-share growth.4
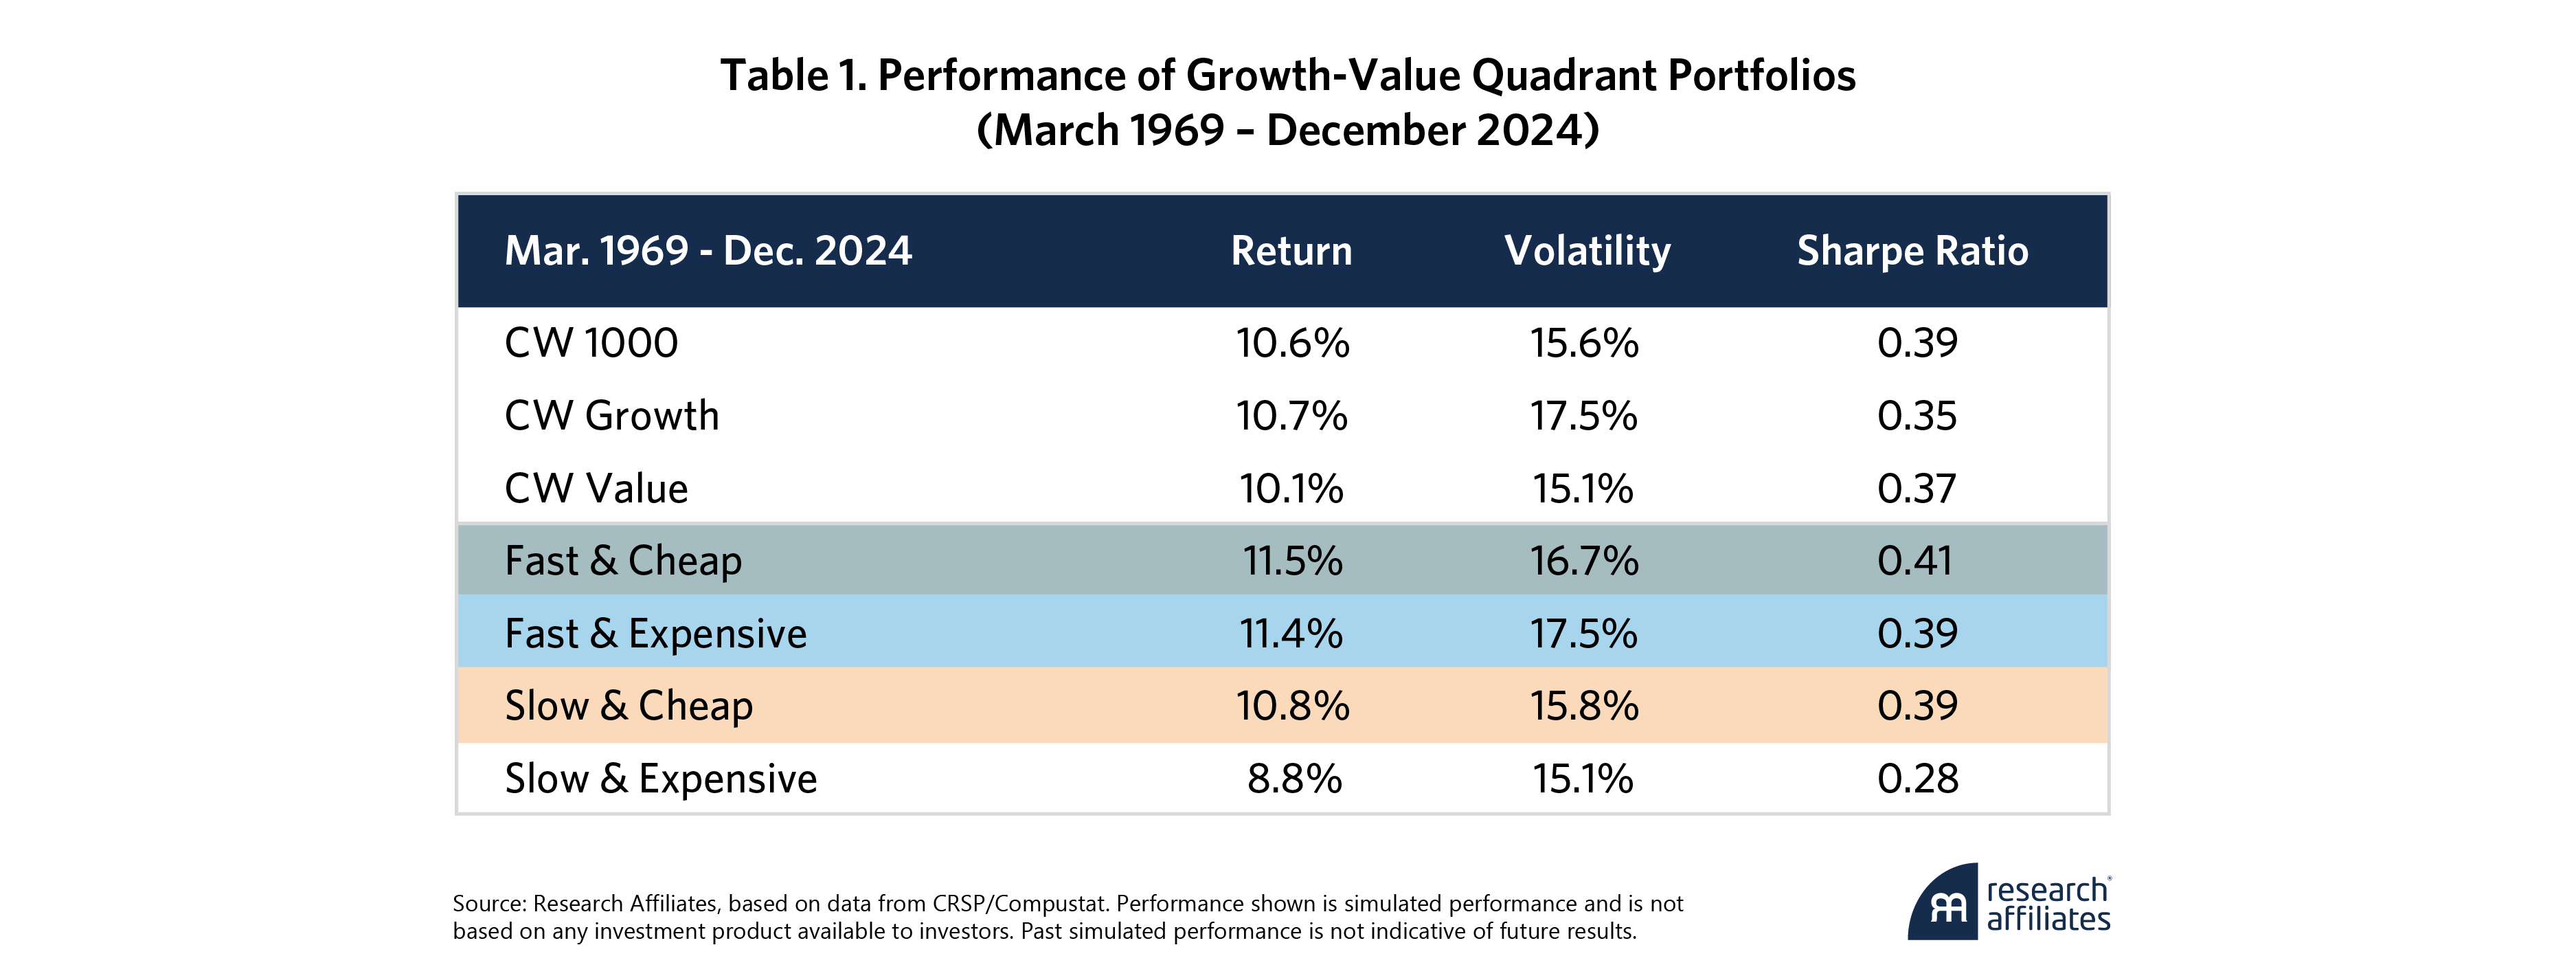
Table 1 summarizes the average performance of the benchmarks and the four growth/value quadrant portfolios. Over this period, the portfolios shaded blue, grey, and orange delivered Sharpe ratios roughly in line with that of the broad market. In sharp contrast, the Slow & Expensive portfolio posted meaningfully weaker results, underperforming the market by 1.8% per year (over a 55-year span!), with a Sharpe ratio substantially below that of the market and the other portfolios.
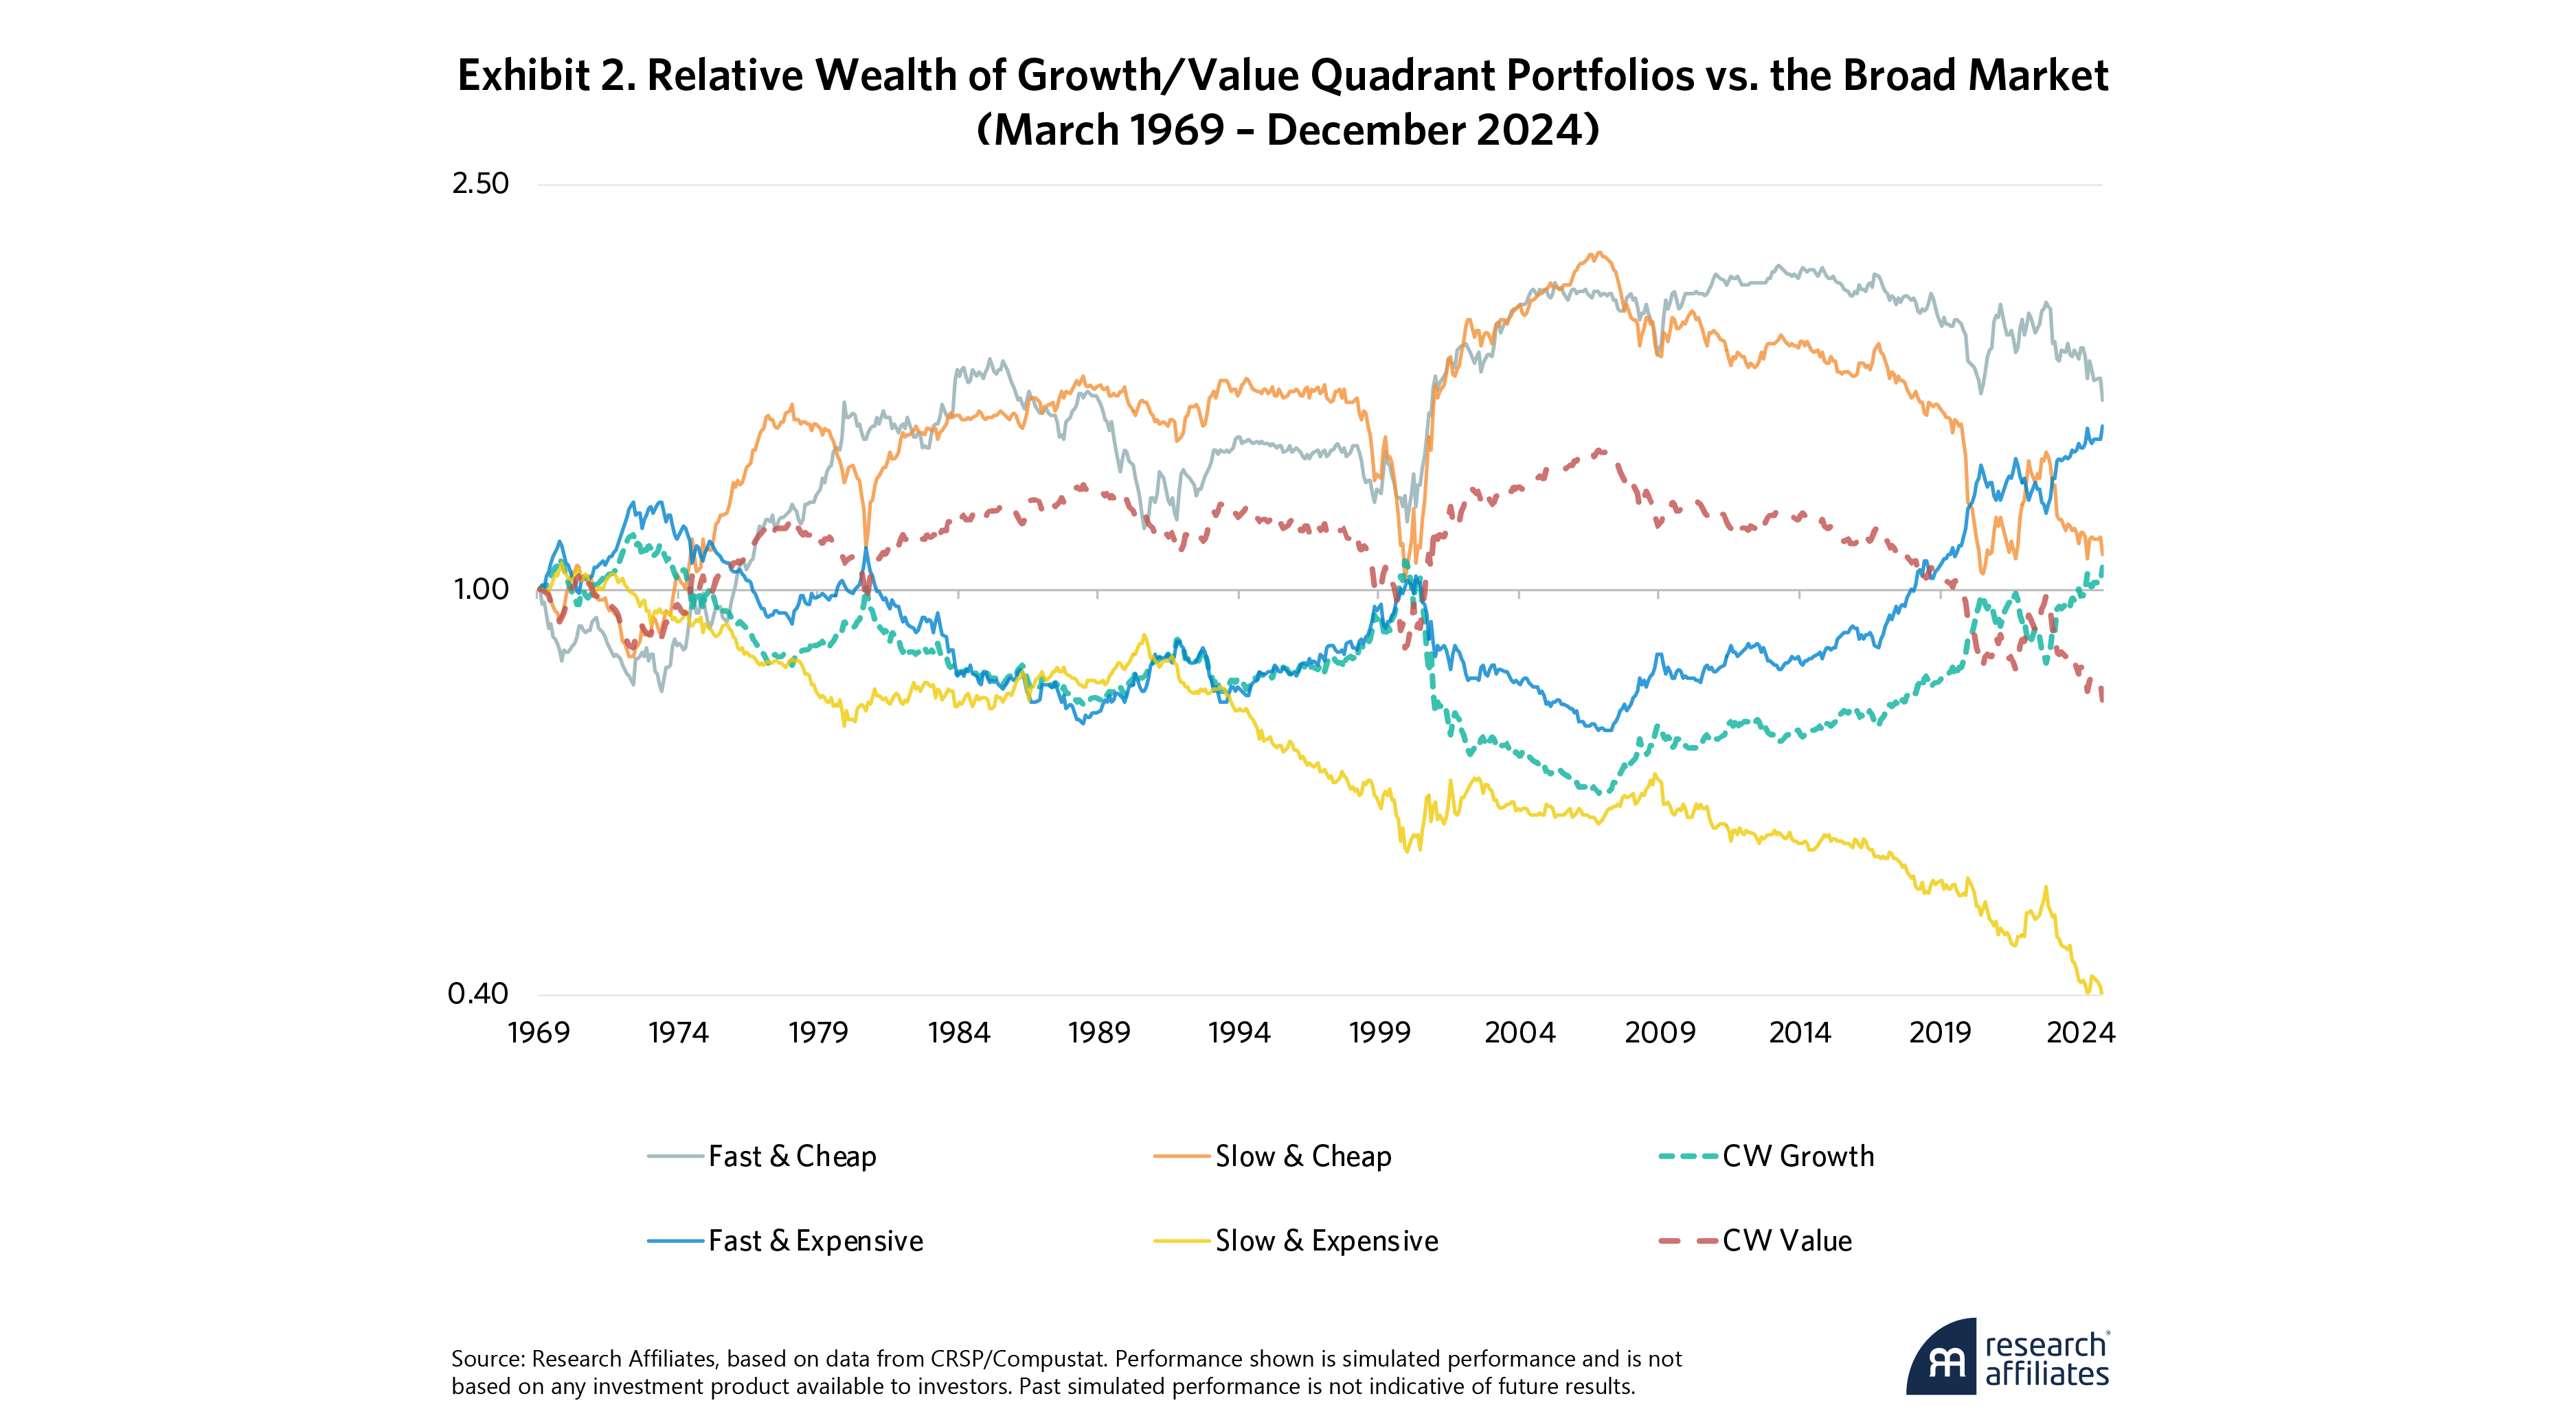
Exhibit 2 presents the time series of relative wealth of these portfolios versus the broad cap-weighted market. The evolution of each portfolio’s relative wealth gives us a dynamic view of performance differentials across decades. Because the chart represents relative wealth, rather than total wealth, the horizontal axis crossing at 1.0 represents the market portfolio over time. Levels above the horizontal axis represent outperformance, whereas those below the horizontal axis represent underperformance.
The Fast & Cheap, Slow & Cheap, and Fast & Expensive portfolios wind up with vaguely similar results over the 55 years but with very different trajectories. Portfolios composed of fast-growing firms significantly outperform the market over the full period, irrespective of valuation. Likewise, the portfolios of cheap firms (irrespective of growth) also outperform over the full period.
Note that both the Fast & Cheap and Slow & Cheap portfolios track with CW Value but outperform it. The Fast & Expensive portfolio tracks with CW Growth but delivers meaningfully stronger returns. Interestingly, the Fast & Cheap portfolio tracks with value, not growth. This likely reflects the cap-weighted nature of style indexes—growth indexes are dominated by stocks of large, expensive, fast-growing companies, not by fast-growing bargains or by expensive companies with weak growth.
The best-performing quadrant portfolio over this historical period has been the Fast & Cheap portfolio, which is composed of fast-growing companies available at attractive valuations. As noted above, a significant number of these companies would be omitted from the S&P Pure Style Indexes. Even in disentangling growth and value metrics, these indexes rob investors of exposure to one of the most attractive areas of the market.
In the most recent 15-year period, the Fast & Expensive portfolio has consistently outperformed, reflecting the dominance of platform tech companies, such as the Magnificent 7. Of the four quadrant portfolios, Slow & Expensive is conspicuous for consistently lagging the others across the entire history. In the current construction of value and growth indexes, this segment is vulnerable to misclassification as growth. After all, these stocks are expensive!
Rethinking Growth and Value
Just as the RAFI Fundamental Index reframed value by stripping out its anti-growth bias, we develop a parallel reframing of growth, untangling it from the flawed presumption that high valuation defines growth. Growth should be identified based on business fundamentals (i.e., how fast a company is growing), not how richly its stock is priced. Why would value or growth investors want companies that are both expensive and growing slowly?
Just as the RAFI Fundamental Index reframed value by stripping out its anti-growth bias, we develop a parallel reframing of growth, untangling it from the flawed presumption that high valuation defines growth.
”Our empirical findings show the cost of mixing valuation with growth. Over more than fifty years, expensive slow-growing stocks underperformed the market by nearly 2% each year, with a much lower Sharpe ratio. This underperformance is more than just a flaw within today’s style boxes. It’s a structural cost placed on the hundreds of billions of dollars invested in products that track style indexes (based on the assets under management reported by firms managing style ETFs).
Value and growth are not mutually exclusive. Growth need not be expensive. Value need not be slow. And style need not be constrained by completeness.
As an industry, we should do better.
Please read our disclosures concurrent with this publication: https://www.researchaffiliates.com/legal/disclosures#investment-adviser-disclosure-and-disclaimers.
End Notes
1. In the Appendix, we include links to resources with additional details on the construction methodologies and history of major growth and value style indexes.
2. Recently, researchers have examined how antiquated and flawed book value is as a measure of almost anything. Lev and Srivastava (2019); Amenc, Goltz, and Luyten (2020); Arnott et al. (2021); Dugar and Pozharny (2021); and Eisfeldt et al. (2022) show that traditional measures, such as book value, poorly capture intangibles, including the contributions from innovation, brand equity, and intellectual property.
3. In our article “Fundamental Growth,” we embrace a multidimensional view of growth and value. This simpler form is for illustrative purposes.
4. From 1987 to 2024, our simulated CW 1000, CW Value, and CW Growth portfolios closely track the performance of their respective Russell counterparts. The average monthly absolute return deviation was just 0.1% for the CW 1000 and 0.4% for the style indexes, with R2 values exceeding 98.5%.
References
Amenc, N., F. Goltz, and B. Luyten. 2020. “Intangible Capital and the Value Factor: Has Your Value Definition Just Expired?” Journal of Portfolio Management 46(7): 84–99.
Arnott, R. D., C.J. Brightman, C.R. Harvey, Q. Nguyen, and O. Shakernia. 2025 “Fundamental Growth.”
Arnott, R. D., C.R. Harvey, V. Kalesnik, and J.T. Linnainmaa. 2021. “Reports of Value’s Death May Be Greatly Exaggerated.” Financial Analysts Journal 77(1): 44–67.
Arnott, R. D., J. Hsu, and P. Moore. 2005. “Fundamental Indexation.” Financial Analysts Journal 61(2): 83–99.
Nguyen, Q., N. Beck, and M. Albuquerque. 2025. “Must Value Be Anti-Growth?” Research Affiliates (July).
Dugar, A., and J. Pozharny. 2021. “Equity Investing in the Age of Intangibles.” Financial Analysts Journal 77(2): 21–42.
Eisfeldt, A.L., Kim, E.T., and D. Papanikolaou. 2022. “Intangible Value.” Critical Finance Review 11(2): 299–332.
Fama, E.F., and K.R. French. 1993. “Common Risk Factors in the Returns on Stocks and Bonds.” Journal of Financial Economics 33(1): 3–56.
Lev, B., and A. Srivastava. 2022. “Explaining the Recent Failure of Value Investing.” Critical Finance Review 11(2): 333-360.
Rosenberg, B., K. Reid, and R. Lanstein. 1985. “Persuasive Evidence of Market Inefficiency.” Journal of Portfolio Management 11(3): 9-17.
Appendix: Key References on Style Methodologies
For more detail on the history and evolution of growth and value style indexes, see the following:
- FTSE Russell, “Four Decades of Russell US Indexes Reconstitution” (May 2024).
- FTSE Russell, “Russell Growth and Value Indexes: The Enduring Utility of Style” (January 2021).
- FTSE Russell, “Russell Pure Style Indexes” (2016).
- FTSE Russell, “Global Style Index Series Methodology,” (July 2024).
- MSCI, “MSCI Global Investable Market Value and Growth Index Methodology” (September 2017).
- S&P Dow Jones Indices, “US Style Indices Methodology” (June 2025).
- S&P Dow Jones Indices, “Distinguishing Style from Pure Style” (January 2019).


