US dollar cycles are long. The most recent appears unusually so relative to history, suggesting the recent change in direction may be more than temporary.
In 2022, the Fed’s rate hikes were more aggressive than other developed-market central banks. In the face of continued high inflation, foreign central banks will likely pick up the pace in their rate hikes. The result should be a tightening of the interest rate differential, putting pressure on the US dollar, likely continuing the pullback that started in December 2022.
The dollar’s direction is an important consideration in portfolio positioning because of the asymmetric relationship between global asset returns and the price of the US dollar.
In a weakening dollar scenario, unhedged foreign stocks and bonds not only typically outperform, but are the only statistically reliable relative relationship we observe.
Over the last two years, the world has witnessed a parabolic strengthening of the US dollar compared to its developed-market counterparts. Dollar strengthening actually started just after the global financial crisis as a slow methodical slog higher marked by both pullbacks and rapid ascents. But it was only last summer that the stronger dollar began to make headlines as USD/JPY hit 135 (135 Yen = $1) and USD/EUR broke parity. As we start 2023, the dollar has pulled back 12% from its high in September 2022, but remains 25% elevated from its lows at the start of the last decade. Is this a temporary respite that reverses in a risk-off recession, or does the buck stop here?
In 2022, the most recent interest-rate hiking cycle, the Federal Reserve has led the way relative to other major developed-market central banks. As a result, the Fed is closer to the end of its hiking cycle than other central banks. In particular, the Bank of England, European Central Bank, and Bank of Japan will need to continue raising rates to deal with inflation. We, therefore, anticipate that the interest rate differential between the United States and other developed countries will tighten in the coming months and years, prompting a dollar pullback and weakening against its developed market counterparts. In this scenario, unhedged foreign stocks and bonds not only typically outperform, but are the only statistically reliable relative relationship we see.
Create your free account or log in to keep reading.
Register or Log in
The Dollar Cycle
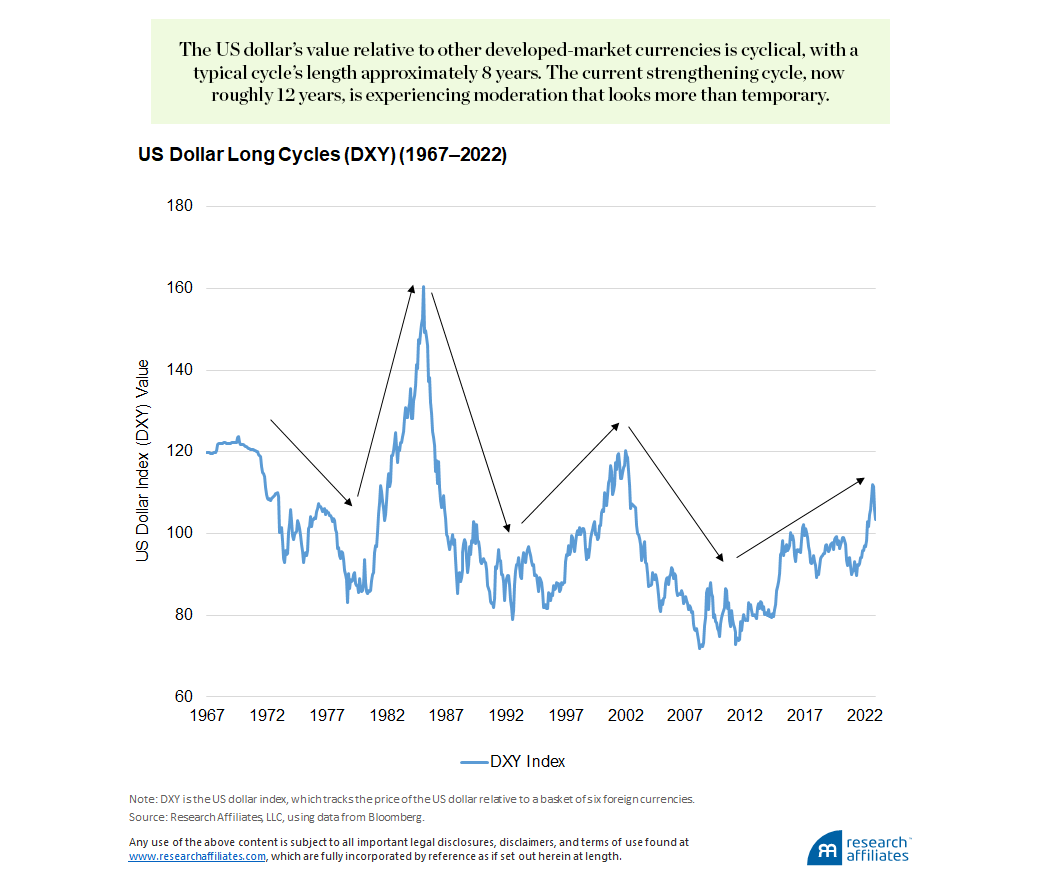
Let’s look at the behavior of the DXY, the US dollar index, which tracks the price of the US dollar relative to a basket of six foreign currencies (euro, Japanese yen, British pound, Canadian dollar, Swedish krona, and Swiss franc). The most recent upward trend is nothing new.
Over the DXY’s history, which begins in 1967, we notice two things. First, the US dollar relative to the other developed-market currencies is cyclical, rising and falling over time. This relationship looks very different from the price behavior of capital assets, such as the S&P 500 Index, which tends to increase over time, continually hitting higher lows and higher highs. This difference highlights the push–pull dynamics of currency indices, which represent a trade-off of like things, one currency for another, as opposed to, for example, one currency for shares of a company.
When a nation’s currency trends strongly in one direction (let’s say, a negative direction), the price movement calls attention to structural concerns in that country. The impact can be negative on just that country or on other countries whose currencies strengthen relative to the weakening currency. If the country is a small global trade partner, such as Zimbabwe, a currency collapse, as occurred there from 2007 to 2009, only hurts the local economy. If, however, the currency belongs to a country that is a major player in the global economy, a country with strengthening currency experiences a bidirectional impact (i.e., imports get cheaper, but exports become much more expensive).
The second observation we make is that the price cycles of the DXY tend to last about 8 years. The most recent cycle started around 2010. That makes the current strengthening trend a bit long in the tooth at roughly 12 years. The dollar’s strength may have hit its cyclical peak, and the current pullback is more than temporary.
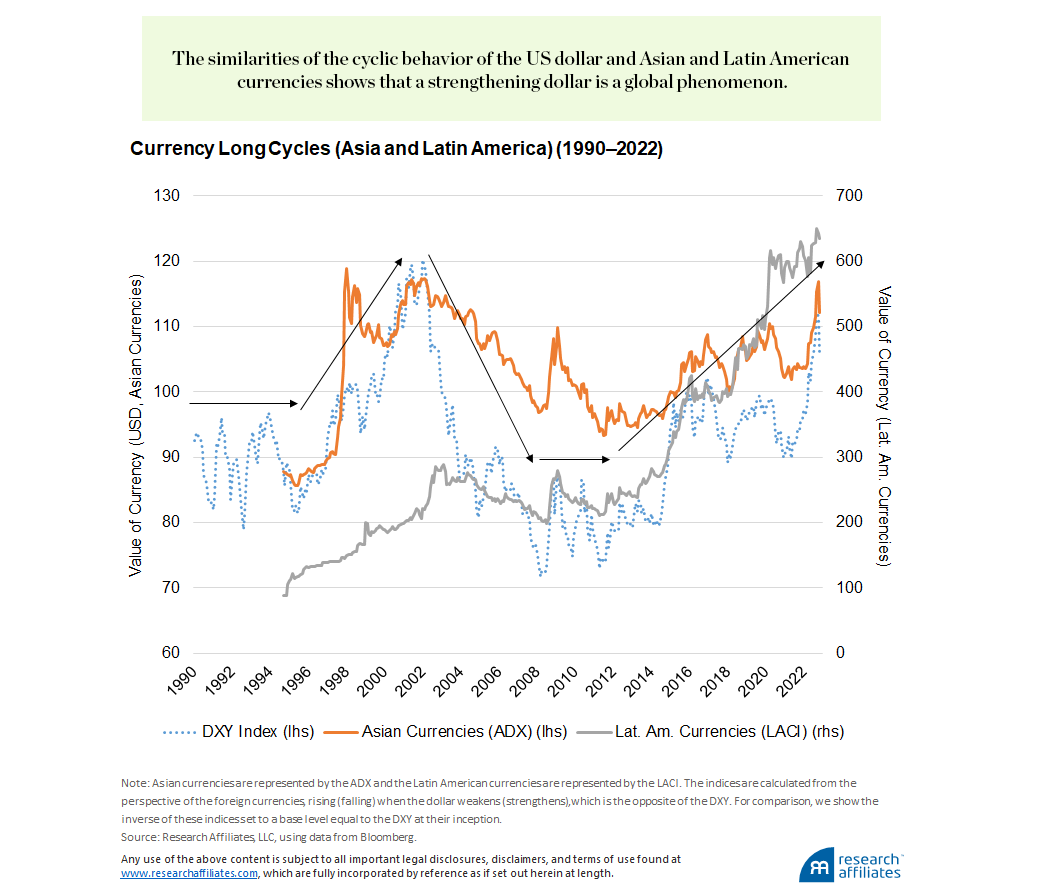
We observe a similar pattern in the emerging Asian currencies and Latin American currencies relative to the dollar when we analyze the ADX and LACI indices, respectively. Although the timing is not exactly the same, both indices show a weakening of the foreign currencies dating from the early 2010s. The similarity with the DXY’s cyclic behavior highlights that the strengthening dollar is not region specific, but a global phenomenon.
Currency Drivers
Like all assets, foreign exchange is driven by supply–demand dynamics between the FX currency pairs. A number of factors influence these supply and demand dynamics. Finance theory, through the concept of interest rate parity, indicates changes in the FX rate between two currencies are driven by the relative differences in the countries’ interest rates. We know however that interest parity does not always hold, giving rise to the global carry trade in currencies in which higher interest rates attract greater foreign investment relative to lower-interest-rate countries. In the shorter to medium term FX rates often appreciate due to this supply/demand mismatch.
The dollar’s strength may have hit its cyclical peak.
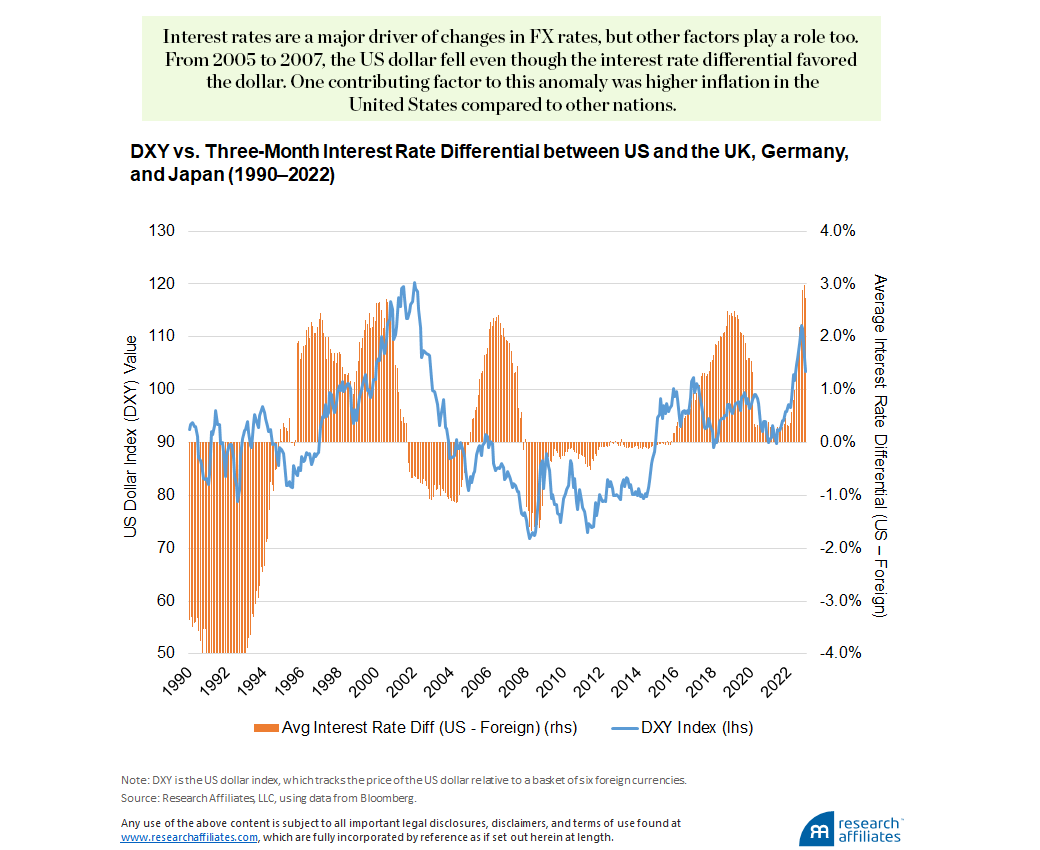
”Time-varying lead–lag relationships can make it difficult to use interest rates as a timing signal for changes in FX rates. Nevertheless, even a simple chart of US three-month interest rates relative to an equally weighted basket of three-month rates in the United Kingdom, Germany, and Japan highlights that the dollar rises when the rate differential is positive (US rates are higher) and falls when the differential is negative (US rates are meaningfully lower). The years 2005–2007 are an obvious outlier: US interest rates were rising, but the dollar was falling. One explanation for the typical relationship’s not holding is that US inflation was rising during this time, especially compared to Japan’s inflation rate. This example highlights that currency movements are the product of a number of interrelated and time-varying drivers.
In addition to interest rates and inflation differentials, other factors that affect valuation of a currency relative to another are the nations’ relative levels of debt, FX reserves, central bank stability—as well as investor confidence in the respective central bank—and trade balances. For example, in addition to austerity measures, higher taxes, or default, a common way for a nation’s government to address high and increasing debt is by nominally deflating the country’s currency by printing more.
Printing is often the only solution for countries that issue debt in another country’s currency, mostly emerging market nations that issue debt in dollars, euros, and yen. For these countries, building their FX reserves improves their ability to pay back their debt without having to use their own currency to purchase the currency in which their foreign debt is denominated. During times of limited liquidity, if these countries need US dollars, the world’s reserve currency, they can be forced into crisis if they cannot acquire them. For this reason, the Federal Reserve maintains swap lines with some countries to supply dollars during crisis periods in an effort to mitigate the severity of the impact on these emerging market countries.
Time for a Dollar Trend Reversal?
From our vantage point in early Q1 2023, US inflation appears to have peaked—at least temporarily. The US Federal Reserve led the central banks of other developed nations in hiking interest rates throughout 2022.1 As a result, inflation appears to have peaked and the Fed may be closer to the end of its hiking cycle than other central banks. This is not to say that US interest rates are sure to fall in the near future, although the fed funds futures markets are pricing in rate declines as early as the summer of 2023, or that inflation will fall rapidly. In fact, we expect inflation to remain elevated in the near future and average inflation over the next decade to hover near 4%.
What seems very clear, however, is that foreign central banks, particularly the Bank of England, European Central Bank, and Bank of Japan (BOJ), need to continue raising rates to deal with rising inflation. In the UK, interest rates are currently at 3.4%, whereas inflation, or Retail Price Index (RPI), is at 14%. Europe shares the same story, with short-term rates at 1.6% in Germany and inflation running at 10%. Even Japan, which has been struggling for many years to achieve liftoff from a deflationary regime, is seeing spikes of inflation. The yen’s 20% fall from 2020 to 2022 forced the BOJ to relax its yield-curve control policies, allowing the 10-year JGB yield to rise by 25 basis points.
We anticipate that the interest rate differential between the US and other developed countries will tighten in the coming months and years, prompting a continued dollar pullback.
”The contrast between the situations in the United States and its developed-market counterparts indicates the chances are very good that the interest rate differential between the US and these countries will tighten in the coming months and years. A corollary to this is a likely dollar pullback and weakening against these nations’ currencies. Could things go the other way? Of course. Global recessionary forces could cause central banks to halt their hiking cycles and reverse course toward cheap money. In the United States, where inflation seems at least contained relative to other countries, the negative effects of rising inflation may be manageable relative to other countries. If so, we would expect the dollar to strengthen. Although this scenario is a possibility, it is not our base case. Given the uncertainties surrounding the direction of the dollar, let’s consider the implications for our portfolios of a rising and a falling dollar.
Dollar Weakening? Buy Foreign Assets
When the dollar is strengthening, a logical prior is that foreign-currency-denominated assets should underperform relative to their US counterparts because a strengthening dollar provides a genuine headwind. We would also expect commodity prices to fall as the dollar strengthens, because most major commodities around the world are priced in dollars. All else being equal, a stronger dollar makes commodities more expensive for countries that need dollars in order to buy food, energy, metals, etc., leading to a drop in demand. The opposite should be true when the dollar is weakening.
We test these priors with simple regressions of monthly asset price returns compared to the DXY’s return in the same month over the period 1926–2022.2 We consider a broad set of asset classes as proxied by 14 major indices, which encompass US stocks and bonds, foreign developed-market stocks and bonds, emerging-market stocks and bonds, and commodities. The results offer evidence consistent with our priors. In addition, we find some potentially surprising results.
Each of the 14 indices has a negative beta, an inverse relationship between the dollar’s return and the asset’s return. Across the board, with the exception of hedged global-developed-market bonds, proxied by Barclays Global Aggregate Ex US (hedged) Index, the betas’ t-stats are highly significant, having a value less than −2.
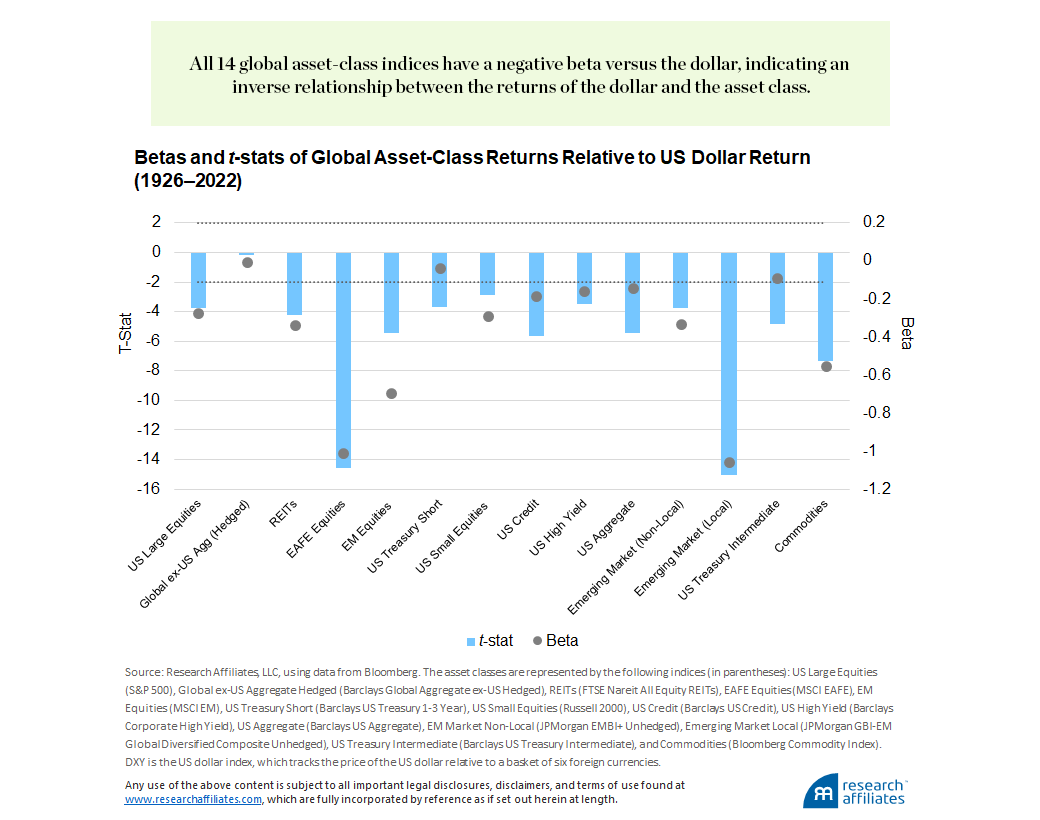
The negative betas for foreign equities, as proxied by both MSCI EAFE and MSCI EM, and for commodities are in line with our priors. Interestingly, however, even US assets, such as the S&P 500, have highly significant negative betas to changes in the dollar relative to foreign developed-market currencies.
We then drill down to examine the relationship between the dollar’s return and the asset’s return when the dollar is rising and when it is falling. We do this by creating two buckets. The first bucket contains the monthly returns of each of the 14 indices in the months when the dollar’s return was positive, and the second bucket contains the monthly returns of the indices in months when the dollar’s return was negative.
We again observe negative betas for all asset classes in our analysis, indicating that when the dollar is rising, the asset classes underperform, and when the dollar is falling, the asset classes outperform. Thus, for all 14 asset classes, a positive dollar return is a negative return contributor for the asset and a negative dollar return is a positive contributor for the asset.
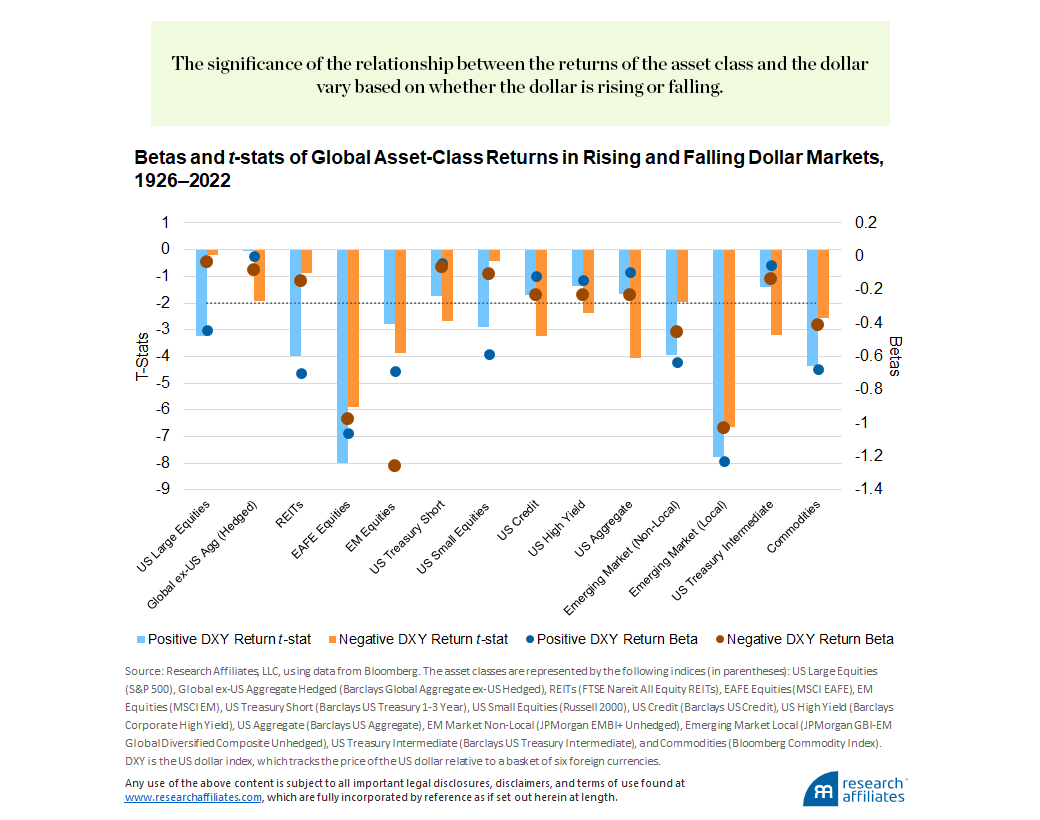
Although the general trend is the same across all the asset classes, we note that the significance of the relationship can vary between rising- and falling-dollar scenarios. Most notably, US domestic risk assets—as represented by the S&P 500, FTSE Nareit All Equity REITS, and Russell 2000—have statistically significant betas when the dollar is rising, but insignificant betas (i.e., insignificant effects on asset prices) when the dollar is falling. This highlights that dollar strengthening can also be associated with a flight-to-safety, global-risk-off environment.
At the most basic level, these results imply that when the dollar is rising investors should sell all capital assets and simply hold cash. Practically speaking, following such a course raises two major issues: 1) some investors are unable to hold large amounts of cash so that selling all assets is not feasible, and 2) for those investors who can move some of their portfolios to cash, we need to know more about the relative positioning they should consider.
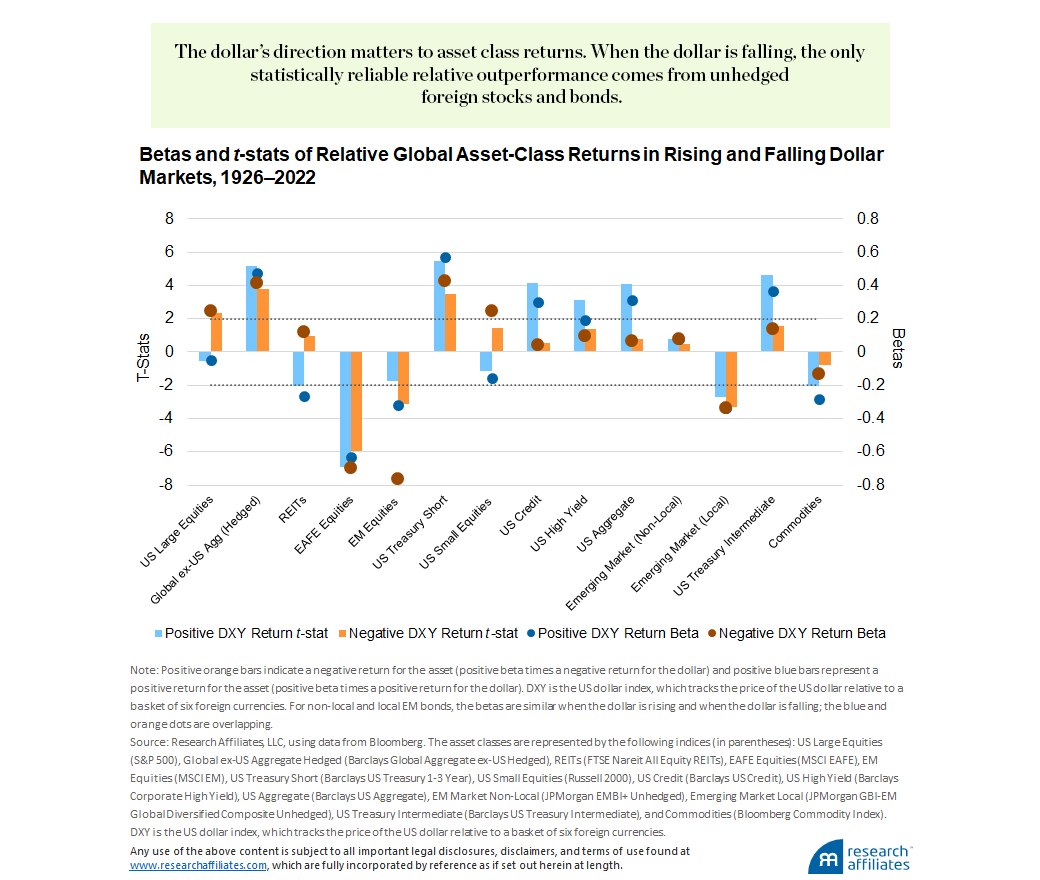
To gain a perspective on the appropriate relative positioning, we repeat the previous regression analysis, but this time instead of examining the absolute value of the asset class returns each month, we subtract the cross-sectional average return in each month to calculate each asset class’s return relative to the other 13 asset classes in our analysis. This approach allows us to identify the assets that outperformed and underperformed the average each month and provides a perspective on the relative positioning of assets given the dollar’s return.
As in the immediately preceding analysis, we separate into two buckets the asset class returns for months when the dollar’s return is rising and when it is falling. It is important to remember the implication of the dollar’s direction. A relative view reinforces the risk-off nature of a strengthening dollar.
In a strengthening dollar environment, bonds outperform other asset classes, and commodities sell off relative to the other asset classes, but at a marginally statistically significant rate. Unhedged foreign asset classes exhibit the worst relative performance drag.
When the dollar is falling, the only statistically reliable relative outperformance comes from unhedged foreign stocks and bonds.
Conclusion
Today, US inflation appears to be moderating. If that continues, the Fed’s rate-hiking cycle will likely slow. But other developed nations’ economies are still in the throes of high inflation, requiring their central banks to keep hiking rates. We expect the result will be a tightening of the interest rate differential and accelerate the dollar’s pullback. The result should be a tailwind for unhedged foreign assets.
Please read our disclosures concurrent with this publication: https://www.researchaffiliates.com/legal/disclosures#investment-adviser-disclosure-and-disclaimers.

Endnotes
- Many emerging-market central banks started raising rates earlier in an effort to defend their currencies and stave off another 2013-type “taper tantrum.”
- Data for asset classes that did not exist in 1926 was included in our analysis beginning at the respective inception date.
