The US Federal Reserve Bank’s expectations for the speed of reverting to 2% inflation levels remains dangerously optimistic.
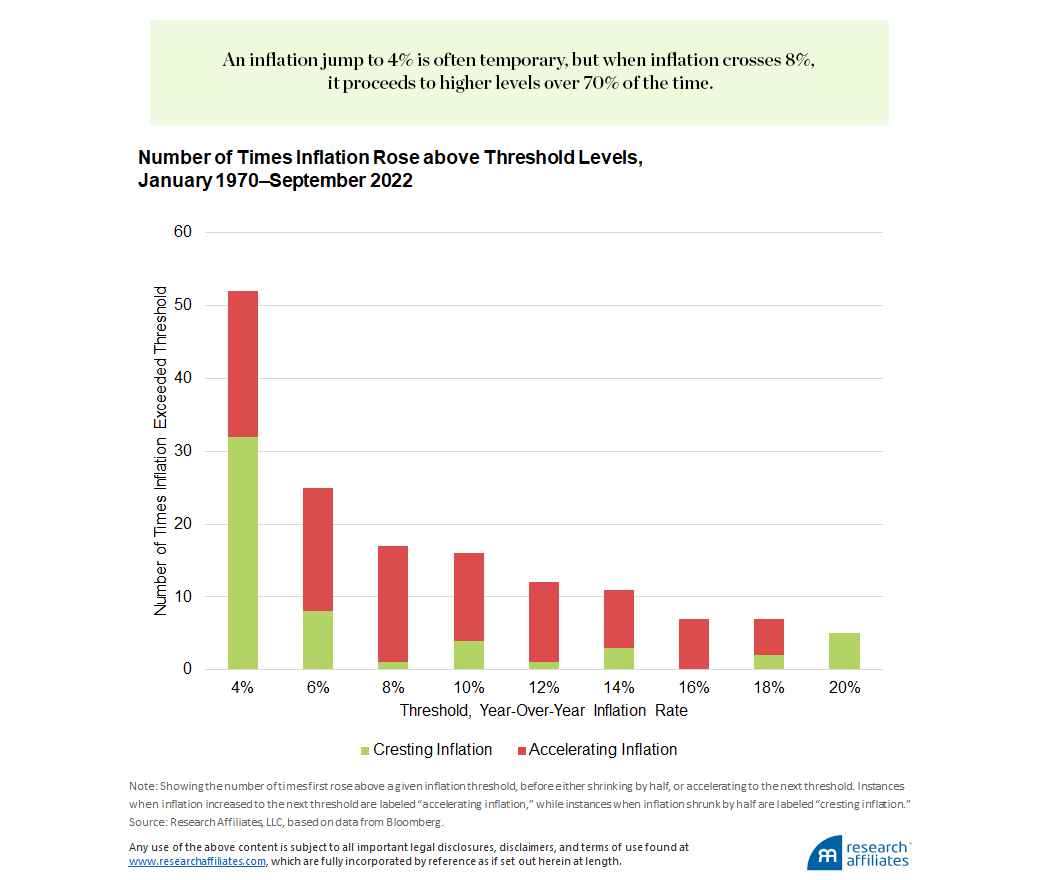
An inflation jump to 4% is often temporary, but when inflation crosses 8%, it proceeds to higher levels over 70% of the time.
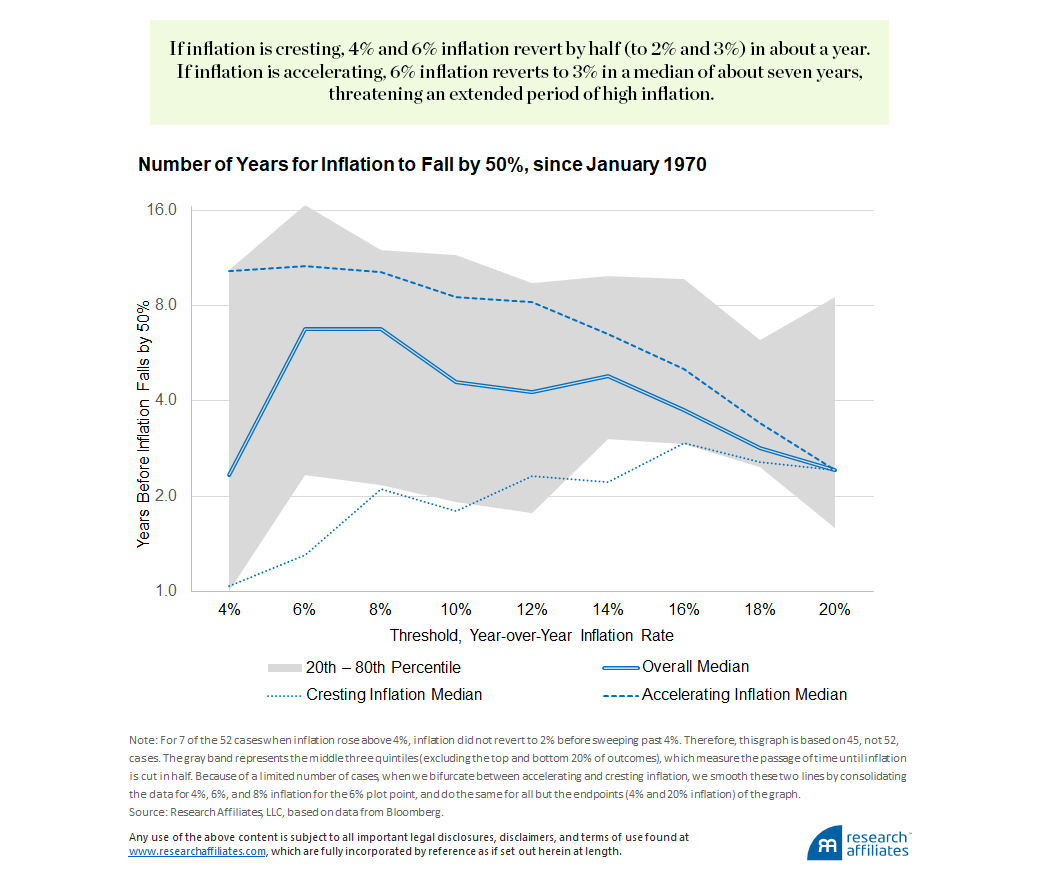
If inflation is cresting, inflation levels of 4 or 6% revert by half in about a year. If inflation is accelerating, 6% inflation reverts to 3% in a median of about seven years, threatening an extended period of high inflation.
Reverting to 3% inflation, which we view as the upper bound for benign sustained inflation, is easy from 4%, hard from 6%, and very hard from 8% or more. Above 8%, reverting to 3% usually takes 6 to 20 years, with a median of over 10 years.
Those who cannot remember the past are condemned to repeat it.
”George Santayana
Bad news: History tells us that once the inflation genie is out of the bottle, it can take far longer to return to normal levels than most people realize. Indeed, when Federal Reserve Chair Paul Volker took office in 1979, he pushed the fed funds rate to an unprecedented 20%, 5% above the previous peak inflation rate, the equivalent of today’s Fed embracing double-digit rates. Even so, it took two more years for this extreme policy intervention to cut inflation to half its peak level (to 7%), and over six years to bring inflation to 2%. In a meta-analysis of 67 published studies on global inflation and monetary policy, Havranek and Ruskan (2013) found that across 198 instances of policy rate hikes of 1% or more, in developed economies the average lag until a 1% decrease in inflation was achieved was between roughly two and four years.
Those who expect inflation to fall rapidly in the coming year may well be correct. But, history suggests that’s a “best quintile” outcome. Few acknowledge the “worst quintile” possibility, in which inflation remains elevated for a decade. Our work suggests that both tails are equally likely, at about 20% odds for each.
Create your free account or log in to keep reading.
Register or Log in
When Will the Inflation Genie Go Back in Its Bottle?
To answer this question, we studied all cases where inflation surges above 4% in 14 OECD developed-economy countries from January 1970 through September 2022.1 After a country’s inflation rate first exceeds 4%, we observe inflation’s behavior thereafter. As Neville, et.al. (2021) point out, an inflationary surge is not always a bad sign – for example, an increase from -2% to 1% may foreshadow a healthy upturn in the economy. Here, we test inflationary surges at thresholds of 4% and above, so as to exclude those cases where the economy is recovering from a bout of deflation. For each episode, we measure the time from the first crossing of the thresholds we study (4% to 20%, at intervals of 2%) until the next time inflation retreated to one of two specific targets: in the first test, halfway back to zero or, in the second test, to below 3%. We found 52 instances when inflation rose above 4% for the 14 OECD economies in our sample, of which 6 instances proceed to exceed 20%.2
The lesson…is not that inflation is destined to move to new highs in the months ahead (after all, nearly 30% of the time, it is, in fact, cresting!), but that we dismiss that possibility at our peril.
”We observe a useful pattern. When inflation first crosses the 4% threshold, often caused by a temporary exogenous shock, it usually reverses course; in 32 out of 52 cases; over 60% of the time inflation never reaches the next threshold of 6%. We call any case where inflation fails to reach the next threshold cresting inflation. That is the good news. The bad news is at 6% and higher inflation, cresting inflation is the exception, not the rule: inflation usually marches to the next threshold. When inflation subsequently rises to the next threshold, we call these cases accelerating inflation. Indeed, once the 8% threshold is surpassed, as happened this year in the United States and much of Europe, inflation marched to the next threshold, and often well beyond, over 70% of the time.3 The lesson we should take from this is not that inflation is destined to move to new highs in the months ahead (after all, nearly 30% of the time, it is, in fact, cresting!), but that we dismiss that possibility at our peril.
Note that we are not posing the question, how fast can inflation subside? We know that a singular focus on price stability can rein in inflation almost overnight, as was the case with German hyperinflation in the 1920s, Hungarian hyperinflation in the 1940s, and Zimbabwean hyperinflation in the 2000s. In each instance, central bank control of the printing press was rescinded and the failed currency was ditched in favor of a broadly trusted medium of exchange, typically gold or the then-prevailing reserve currency. Money is very simple. It is a medium of exchange to buy or sell labor, goods and services, either contemporaneously or intertemporally (the latter being money’s use as a store of value). Money cannot serve multiple masters. Nevertheless, central bankers seem eager to promote an array of goals they hope to achieve through monetary policy: price stability, full employment, low servicing costs of government debt, bear market disruption, and so forth. When money is asked to serve multiple masters, how long, on average, will a burst of inflation linger?4
How Long Before Inflation Falls by Half?
In our first test, we estimate the half-life of high inflation: the amount of time it takes for inflation to fall by half, from 4% to 2%, from 6% to 3%, and so forth. For some of the cases of 4% (or higher) inflation, inflation arrives and then recedes; for others, it accelerates further—in some instances, a lot further—before receding.5
The following graph shows the median number of years for inflation to be reduced by half, from the first time it hits one of the inflation thresholds we study. The shaded band representing the middle three quintiles (leaving out the top and bottom 20% of outcomes). The distribution includes cases when inflation reaches the next threshold (accelerating inflation), or does not reach the next threshold before receding (cresting inflation).
We find that once inflation has reached the 4% threshold, at the low end of the gray band, at one year, tells us that 20% of the time it takes a year or less to revert to ≤ 2% inflation (half of the 4% threshold). At the other extreme (at the top of the gray band), 20% of the time, it takes 10 years or more to fall back to 2%! The median result is a 2½-year wait before a modestly elevated 4% inflation falls below 2%. All of which invites the question: When inflation was already crossing 4% in April 2021 (2% of which was in the prior three months, which was an 8% annualized rate!), what were Powell and Yellen thinking in declaring the inflation transitory? Should we consider a median expectation of 2½ years to revert to a 2% inflation rate as transitory?
The medians for cresting inflation and for accelerating inflation are very different. Cases of cresting inflation dominate the lower reaches of the distribution, while cases of accelerating inflation dominate the top of the distribution. If 4% inflation never makes it to the next threshold of 6%, then this cresting inflation recedes quickly, with a median time of just 1 year to revert to ≤ 2%. But if inflation is accelerating and proceeds to the next threshold of 6%, and perhaps higher trouble likely awaits. In this situation, with a median of 10 years until the inflation level returns to 2%, the economy could face a protracted period of high inflation. At a 6% threshold, if inflation crests and recedes, the median is 15 months for inflation to fall by half (i.e., to revert to 3%). If instead inflation proceeds to 8% or more, the median time to revert to 3% is nearly 11 years.
When US inflation crossed 4% in April 2021 for the first time since 2008, our study of history might have supported a declaration that the inflation should be transitory. That would only be true, however, if we had been certain that inflation was cresting and would not accelerate to 6% or more. But if inflation moved higher, the median wait to return to 2% inflation would increase tenfold. Then, once inflation crossed 6% in October 2021, if our crystal ball had shown that was the peak, the median expectation would have been to revert to 3% inflation in about 15 months. Otherwise, if inflation rose further (as it did), the median wait for ≤ 3% inflation would be another decade. Once inflation crossed 8% in March 2022, had we been sure it would not exceed 10%, we could reasonably have expected a return to 4% in about two years. Of course, 4% would still be twice the Fed’s target of 2% and likely would not be reached until March 2024. If the next move from here is to new highs, we would be looking at an average decade-long wait to recede to 4%, which could be extremely painful.
At higher levels of inflation—from crossing the threshold of 6% to crossing 20%—we observe a slight hump-shape in the median half-life peaks at about 7 years when inflation is 6% to 8% (today’s level of inflation!), falling to about 2½ years at an inflation rate of 20%.6 The worst-quintile outcomes, across all levels of inflation, require a wait of anywhere from 8 to 16 years to lower the inflation rate by half from the first time it crosses on of our inflation thresholds.
How Long for Inflation to Revert Below 3%?
Few would consider it an applause-worthy win to bring 20% inflation down to 10%. Accordingly, let’s consider another test in which, after inflation first crosses the various thresholds in our analysis (4% to 20%), we declare victory as soon as inflation falls below 3%, an inflation rate most of the citizenry would find tolerable.
It should come as no surprise that the median time to bring 4% inflation down—ever so modestly—to 3% is brief, about 18 months (still perhaps longer than many might expect). But after inflation hits a less-benign 6%, the median number of years to cut inflation to below 3% soars to 7½ years. From inflation levels of 8% to 20%, the median span required to bring inflation below 3% is surprisingly flat, from 9 to 12 years. This lengthy period may actually be understated because of the handful of cases missing from our dataset in which inflation has failed to return to 3%, to this day.
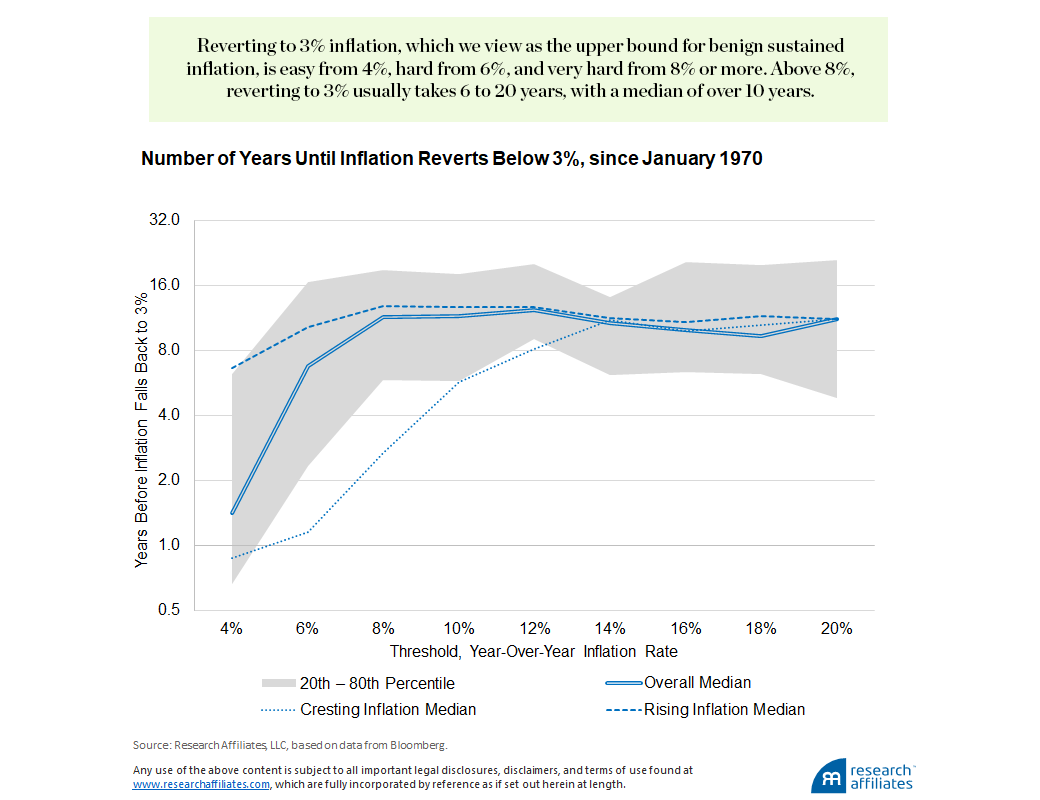
Given the recent US inflation rate, which has been above 6% for the last 12 months and above 8% for the last 7 months, history tells us that the median number of years to reduce inflation below 3% is 10 years, with a 20th to 80th percentile range of 6 to 19 years. How many economists—let alone pundits and policy “experts”—have suggested we may have elevated inflation for six years, much less the longer outliers?
When Did the Fed Wake Up?
After the Federal Reserve Chair Powell retired the term transitory in November 2021, the Fed’s December 2021 dot plot7 still showed a shockingly benign expectation for future fed funds rates, of 0.88% at yearend 2022, hence tacitly also a benign expectation for future inflation.8 The reality by then was that the past 12-month inflation rate, already over 6%, was rising every bit as fast as the Fed was raising rates!
In June 2020, while we were still reeling from Covid lockdowns, trailing one-year inflation was 0.1% and the fed funds rate was much the same in the 0–25 basis-point (bp) range, as was the predicted fed funds rate for yearend 2020, 2021 and 2022. Indeed, through December 2020, the Fed’s dot plot showed that all but one Fed governor believed the funds rate would still be in that range at the end of 2022, 2½ year later! In September and December 2020, inflation had risen to a still-modest 1% and expectations for the funds rate for yearend 2022 had not budged (except for one lone Fed governor who judged a 25–50 bp increase would likely be warranted). No one knew when the Covid mess would end, and many wondered whether the economy could avoid deflation and depression.
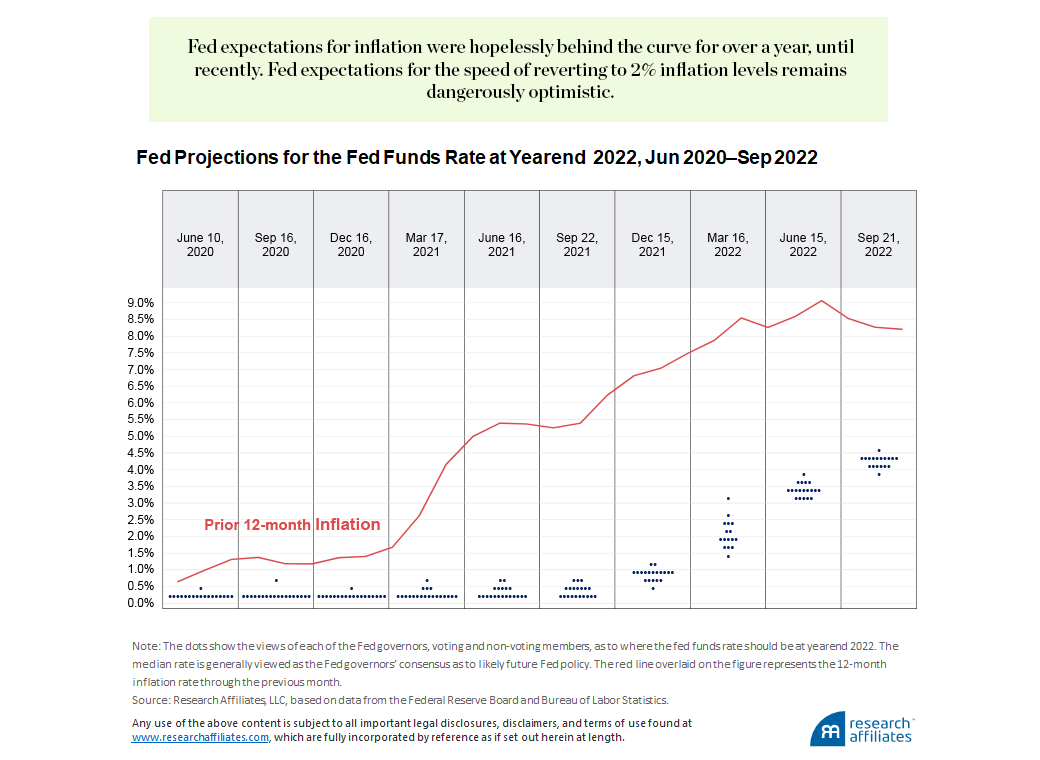
In 2021, the inflation picture was changing rapidly. Home prices had already risen 10% in 2020, tied for the largest one-year jump over the previous 15 years.9 By mid-2021, inflation was already at 5%—and officially deemed transitory, even though the BLS measure for shelter inflation was miles behind home price appreciation and rental rates.10 As history shows, although a transitory characterization was feasible, the historical median duration for a period of higher inflation was longer, especially if inflation surged higher from there. Which it did. By yearend 2021, inflation was 6.6%, five times the year-earlier level. Shockingly, the dot plot still showed that every single Fed governor believed the appropriate yearend-2022 fed funds rate should be at least 500 bps lower than the then-current year-over-year inflation rate. Not a single one expected the funds rate should be even 1% above their expectations in December 2020.
The current year, 2022, paints a different picture. By mid-September, the governors were forecasting a consensus year-end funds rate of just over 4%, on track to create a full yield-curve inversion (3-month T-bill rates higher than 10-year T-bond yields) by yearend.11 But inflation remains stubbornly above 8%, and based on our analysis, is likely to remain there through yearend. Cam Harvey’s (1988) pioneering work on the yield curve suggests that an inversion from 3 months to 10 years, if it remains inverted on average over a quarter, has a 100% batting average over the last 50 years in predicting recessions, with no false positives.
Don’t Get Fooled Again
We are reminded of lyrics by The Who: “I’ll get on my knees and pray we don’t get fooled again.” Of course, for those who take the time to study history, prayer has nothing to do with it. It was a mistake for the Fed to declare inflation transitory when it was rising rapidly and when history tells us that, even at a relatively modest 4% rate, it often is not transitory. The Fed inflicted serious damage, both to the macroeconomy and to its own credibility, by following a too-easy policy for a dozen years and then continuing its transitory messaging as inflation lofted past 6%, then 8%. The same messaging continues today, albeit in different words.
A cursory glance at history should have alerted the Fed that although transitory inflation is possible, it is hardly a sensible central expectation, and that their messaging and policy response should reflect the relatively high empirical risk that inflation would accelerate. Is it possible that inflation will recede to 4% and then to 2% in the coming year or two? Of course it’s possible! History says it is unlikely.
Is it possible that inflation will recede to 4% and then to 2% in the coming year or two? Of course it’s possible! History says it is unlikely.
”Our fiscal and monetary policies have done far more harm than good in recent years. We believe that, as George Box famously observed, “All models are wrong, some models are useful.” Our leaders, and indeed much of the economics profession, appear to believe their economic models are reality and seem eager to dismiss reality that does not fit their models. We believe scientific method demands that we welcome well-reasoned contrary opinions and alternative perspectives, and always seek to test our ideas against the principle of “falsifiability.” Indeed, a correct application of scientific method requires us to test our models, not with an eye to prove them correct, but with a goal of breaking our models and finding their weaknesses. This is the norm in the hard sciences, but not in the soft sciences (if they can be called sciences!).
We perceive a resistance to alternative views, in both fiscal and monetary circles, a desire to create an echo-chamber of similar views, and a reluctance to learn from past mistakes. We are fools if we allow our hopes for a rapid dissipation of inflation to become our central expectation.
Please read our disclosures concurrent with this publication: https://www.researchaffiliates.com/legal/disclosures#investment-adviser-disclosure-and-disclaimers.


Endnotes
- The countries include Australia, Canada, France, Germany, Great Britain, Italy, Japan, Netherlands, New Zealand, Norway, Spain, Sweden, Switzerland, and the United States. We excluded countries that were not developed early in our 52-year history.
- In tests using only United States inflation data going back to 1913, we found nearly identical patterns of results as those of our fuller multi-country tests reported here.
- Note that the only reason that 20% inflation is always cresting inflation is that we tested no higher thresholds. In fact, these six cases always went to 22% and beyond. If we ignore the 'always-cresting' 20% threshold, (because it's not quite true!), we find that inflation rates of 8% and higher accelerate to higher thresholds over 80% of the time.
- We think the central bank consensus, that 2% inflation is ideal, is arbitrary. True price stability—zero inflation on average over time—is easy to achieve. The Byzantine Empire managed it for over 600 years. That said, 2% inflation is reasonably benign, with the currency losing “only” 75% of its purchasing power in an average human lifetime.
- For nearly 1 in 5 of these instances (38 out of 205), the level of inflation has still not been reduced by 50% to this day. We do not include those 38 cases in our analysis and so the half-life estimates should be considered conservative lower bounds.
- We caution not to take too much comfort in the lower half-life at the higher levels of inflation considering several historical instances in which inflation has yet to fall by half. These instances are not included in our results.
- To construct the “dot plot,” each of the Fed governors, whether a voting member or not, chooses a level for the Fed Funds rate that they believe will be correct for the end of the current and next two calendar years, and what is the correct equilibrium “terminal rate” that should apply whenever economic conditions are normal.
- The Fed’s dot plot shows the views of each of the Fed governors, voting and non-voting members, as to where the fed funds rate should be at yearend, at the next two yearends, and where it should settle eventually in equilibrium. The median rate is generally viewed as the Fed governors’ consensus as to likely future Fed policy.
- An identical 10% jump was printed in 2013 as housings’ rebound after the global financial crisis petered out.
- History, once again, is a useful guide. Both owners’ equivalent rent (OER) and rental of primary residence (RPR) are smoothed and lagged. They play catch-up on the upside or on the downside, with an average lag of one to two years. The residual catch-up takes much longer. We are seeing that play out in 2022, with OER and RPR soaring even as home prices and rents are beginning to moderate. See Arnott and Harvey (2022).
- The 10-year/3-month yield curve was in full inversion for a few days in October 2022. The November/December rate hikes should make this a more serious inversion, if current expectations are correct.
References
Arnott, Rob, and Campbell Harvey. 2022. “No Excuses: Plan Now for Recession.” Research Affiliates Publications (June).
Harvey, Campbell. 1988. “The Real Term Structure and Consumption Growth.” Journal of Financial Economics, vol. 22, no. 2 (December):305–333.
Havranek, Tomas, and Marek Rusnak. 2013. “Transmission Lags of Monetary Policy: A Meta-Analysis.” International Journal of Central Banking, vol. 9, no. 4: 39–76.
Neville, Henry, Teun Draaisma, Ben Funnell, Campbell R. Harvey, and Otto Van Hemert. 2021. "The Best Strategies for Inflationary Times." The Journal of Portfolio Management vol. 47, no. 8: 8-37.
