Beyond a certain “sweet spot”—15% to 30% of GDP—government spending imposes a drag on economic growth.
Government debt issuance is strongly correlated with reduced economic growth; short-term stimulus leads to long-term headwinds.
Policy makers and citizens must become aware of the economic consequences of reallocating funds from the private to public sector.
Common sense and economic theory often collide. Take the stubborn belief that government stimulus spending and debt issuance reliably boost economic growth. It is a simple and seductive idea—when the economy falters, the government can step in, inject capital, and jumpstart growth. But the data tells a different story. Time and again, across decades and borders, more government spending and public debt correlate with slower real per capita GDP (RPCGDP) growth. Far from fueling sustained prosperity, aggressive government intervention appears to systematically undermine it.
Create your free account or log in to keep reading.
Register or Log in
Time and again, across decades and borders, more government spending and public debt correlate with slower real per capita GDP (RPCGDP) growth. Far from fueling sustained prosperity, aggressive government intervention appears to systematically undermine it.
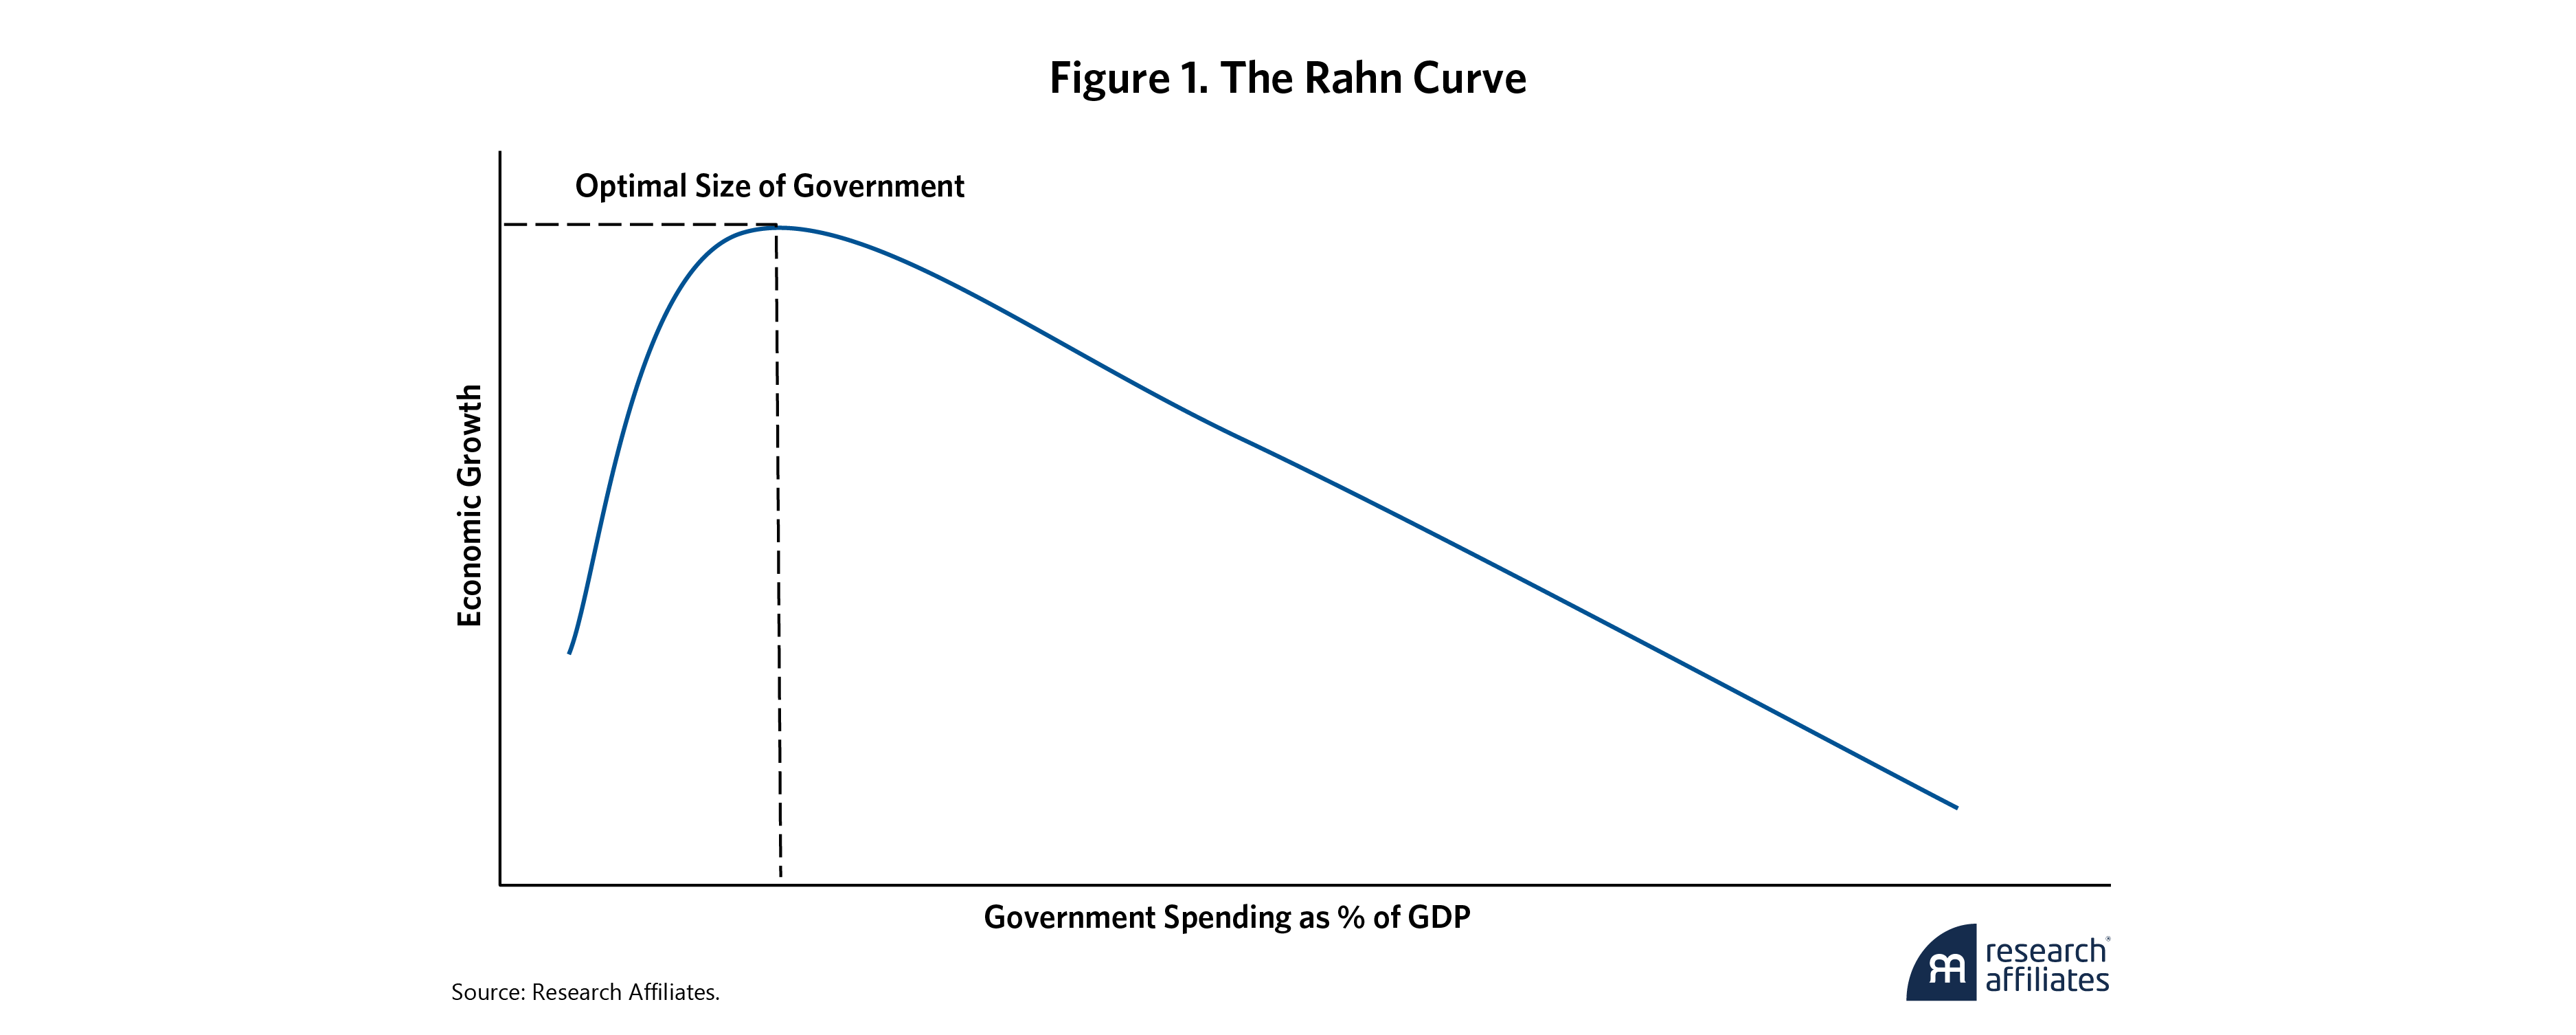
”What’s often labeled “stimulus” is really just a redistribution of resources. Money is extracted from the private sector through taxation or borrowing, then re-injected into the economy in a targeted fashion, ostensibly to revive Keynes’ famed “animal spirits.” Yet decades ago, Colin Clark (1945) and Gerald Scully (2003) identified thresholds—around 25% and 19% of GDP, respectively—beyond which taxation and government spending begin to stifle economic growth. Richard Rahn similarly captured this in the now-famous 'Rahn Curve,' which illustrates an inverse-U relationship between government spending and economic growth, suggesting that increased spending can support growth up to a point, but beyond a certain threshold it becomes counterproductive.
Vito Tanzi and Ludger Schuknecht (2000), in Public Spending in the 20th Century, echo these findings. They conclude that the optimal level of government spending in developed economies is less than 30% of GDP. Our research on OECD countries independently identifies a spending “sweet spot” between 15% and 30% of GDP. Above that, growth slows, and when debt finances the spending, growth deteriorates even further. Carmen Reinhart and Kenneth Rogoff (2010) famously found that when debt crosses 90% of GDP, real growth falters.
Today, the situation in developed nations is troubling. Government outlays average 42% of GDP, far beyond our sweet spot, while average debt levels hover at 87% of GDP. Worse, the debt burden is rising fast as servicing costs crowd out other investments and hamper private sector growth.
Our findings demonstrate that diverting funds from the private to public sector correlates with (and in our view, causes) diminished economic productivity and growth. Far from a panacea, increased government spending stifles long-term prosperity. Similarly, mounting government debt, though justified as fuel for growth, suppresses genuine economic advancement.
Our findings demonstrate that diverting funds from the private to public sector correlates with and may indeed cause diminished economic productivity and growth.
”Higher Government Spending = Slower Growth
An expanding government pulls people and resources out of the private sector, where productivity and innovation are rewarded, and channels them into the public sector, where the incentives are different, favoring stability over innovation. Public servants may be capable and committed, but government is not built for efficiency or dynamism. Just ask anyone who has visited the Department of Motor Vehicles (DMV).
The result? Expanding government leads to less innovation, less productivity, and less growth.
Transformative economic breakthroughs originate mostly in the private sector. The Magnificent Seven—Alphabet, Amazon, Apple, Meta, Microsoft, NVIDIA, and Tesla—have all left their imprint on the global economy and are all products of the private sector. They all are also based in the United States. That is no coincidence. In the U.S., the government claims a far smaller slice of GDP than in Europe or Japan.
Of course, proponents of public spending will argue that government “investment” can galvanize capital-intensive innovation that the private sector, with its near-term focus on profit, would rather not pursue. The Apollo space program and the U.S. Advanced Research Projects Agency Network (ARPANET), the predecessor to the internet, as well as publicly funded medical research, are often cited as examples of productive government-supported enterprises.
Count us as skeptics. Recent evidence indicates that space exploration and internet technologies are progressing faster under private sector management than they ever did under government control. Government better serves the public, and almost certainly at less cost, as a customer of SpaceX and the various internet companies than as owner and manager of all these programs. As for medical research, the private sector provides the lion’s share of the funding.1 In fact, the U.S. spends more on medical care than any other country, both on a per-capita basis and as a percentage of GDP, yet we rank 48th in the world in life expectancy, just behind Albania and Panama.2
The Empirical Evidence
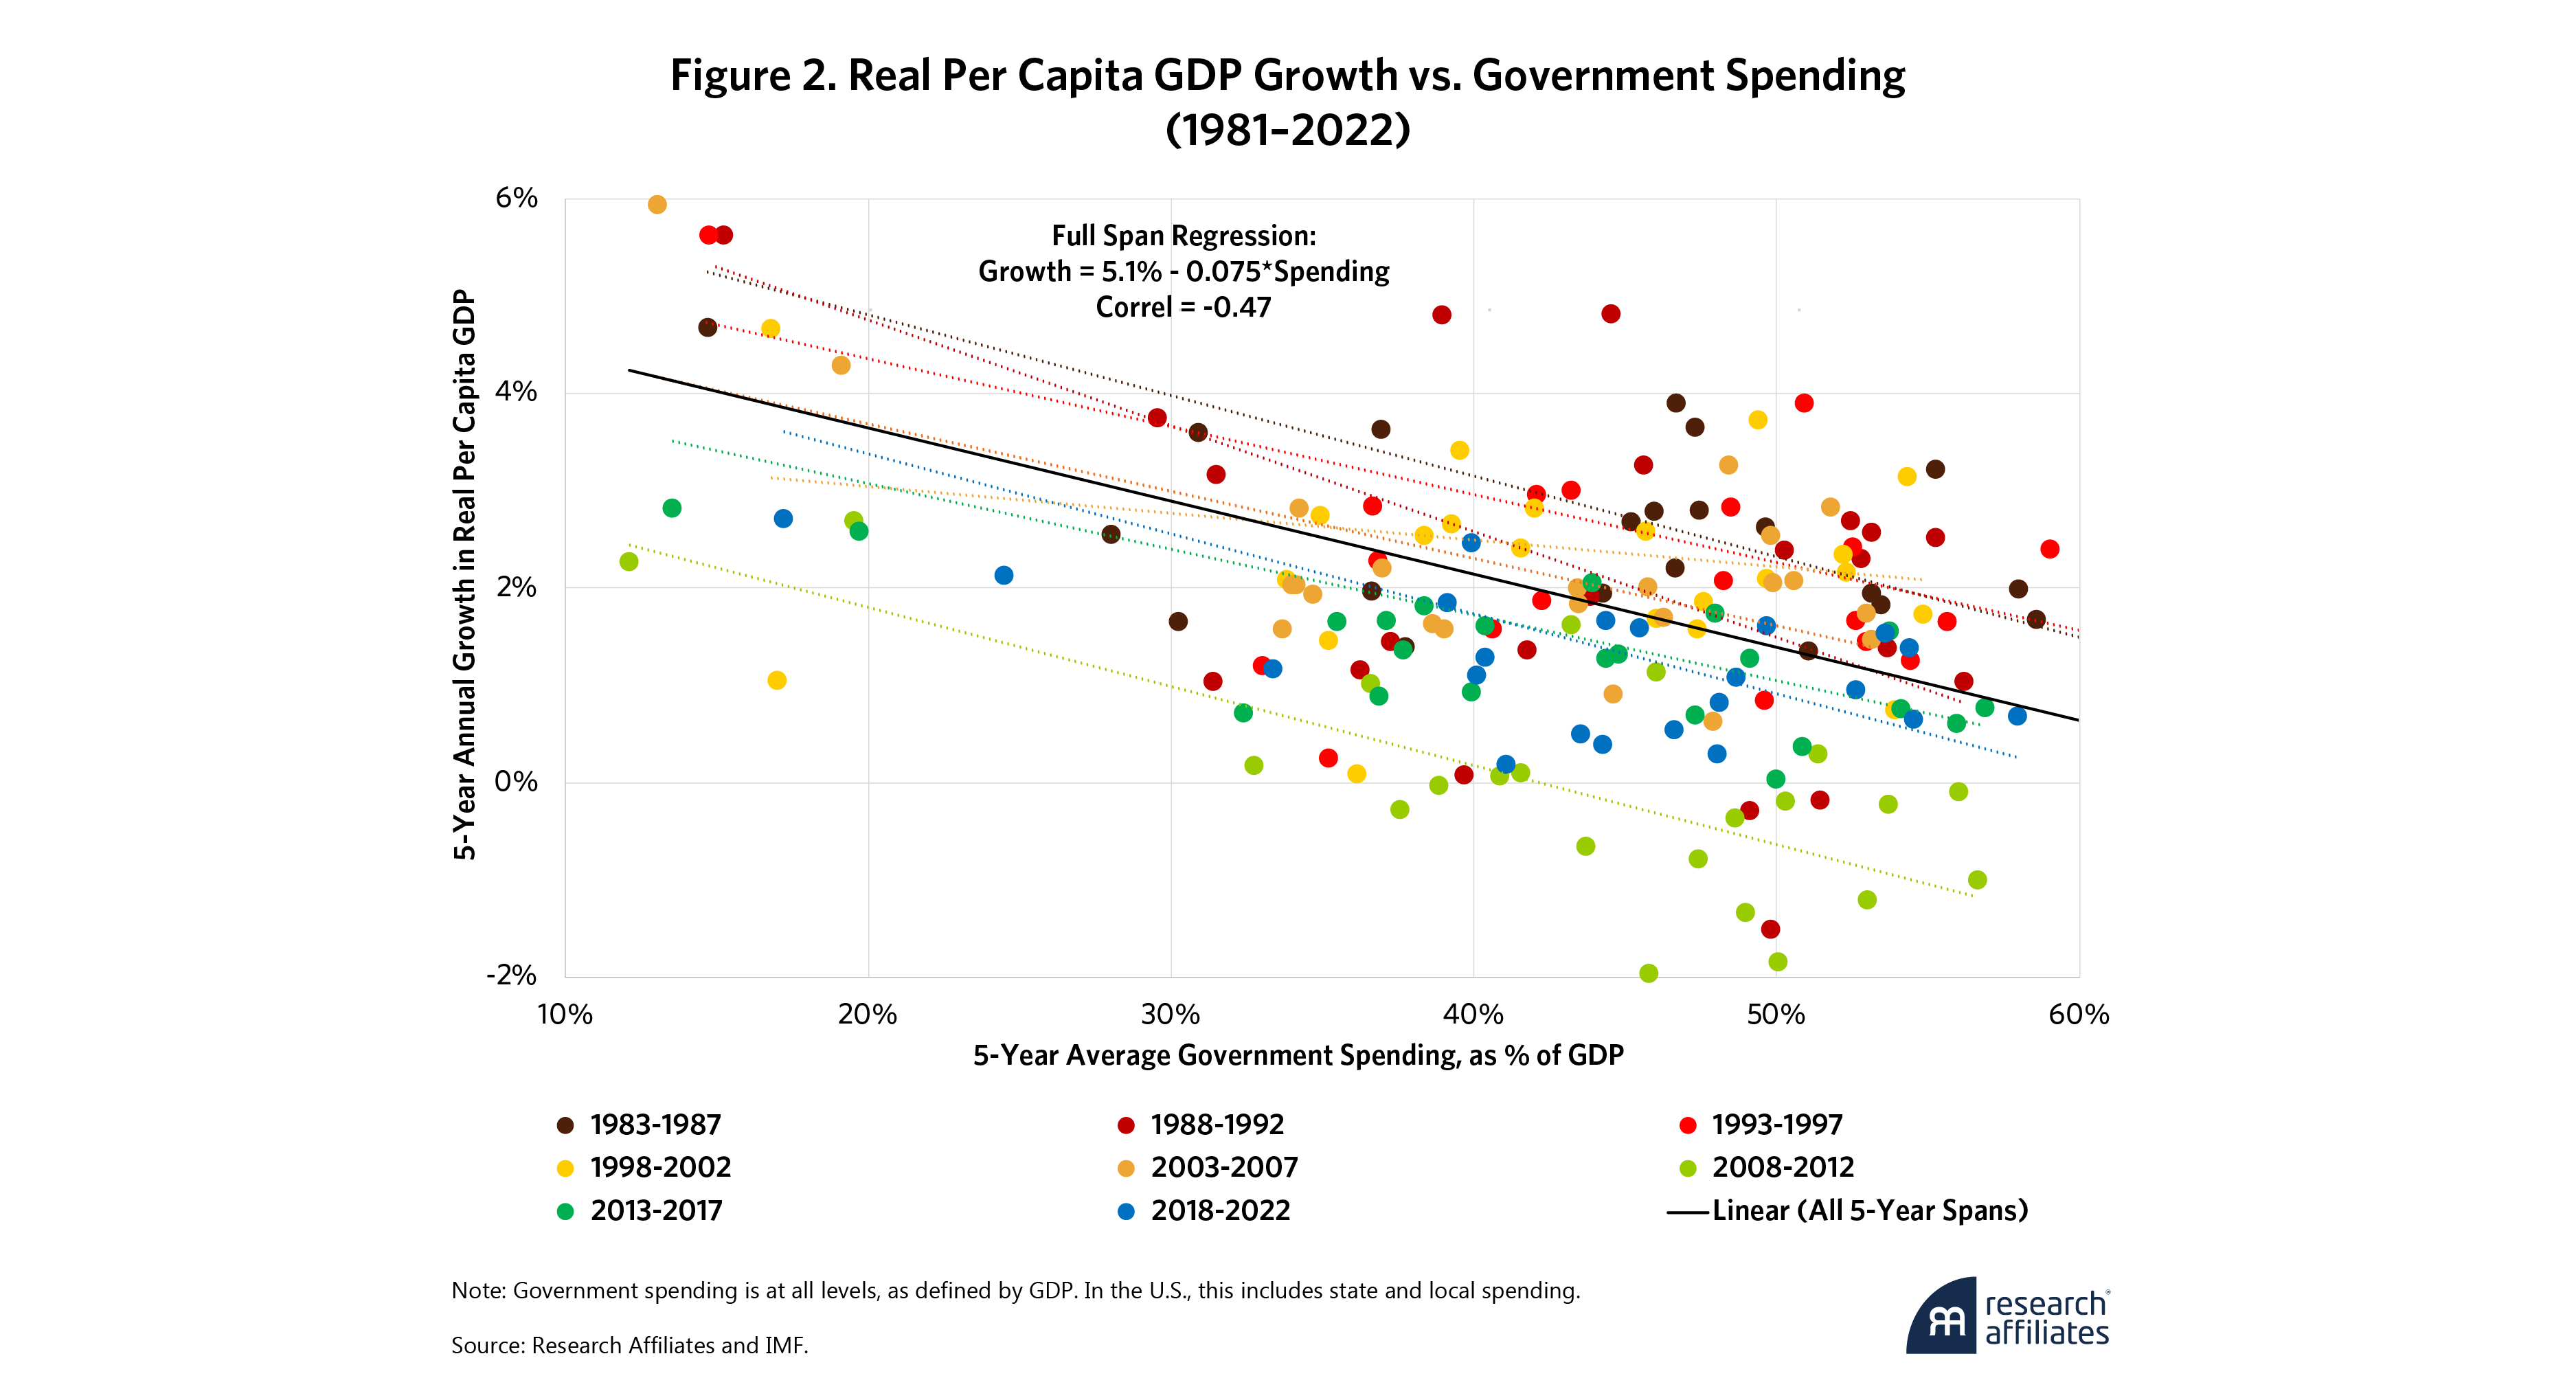
These aren’t just philosophical differences—they’re borne out in the data. In OECD countries, from 1981 to 2022, government spending and RPCGDP growth are negatively correlated in each of the eight non-overlapping five-year spans, and statistically significant in seven of the eight, with an overall negative correlation of 47%. Expanding on research we first shared in “A Stealth Tax on Prosperity,” Figure 2 shows how growth decelerates after spending surpasses 20% of GDP. When spending eclipses 50% of GDP, economic growth becomes sluggish, confined largely to between 0% and 2%. Beyond a certain threshold, increased government outlays seem to yield diminishing returns and crowd out more productive private sector spending. This corroborates analysis from Andreas Bergh and Magnus Henrekson (2010), who highlight the economic drag imposed by an expanding state.
We use RPCGDP as our metric for economic growth rather than total real GDP growth. Why real growth? Because nominal growth due to inflation is not growth. We use real per capita GDP because a population that grows at 2% with real GDP growth of 2% isn’t any more prosperous than before.
Of course, some government spending is necessary. Spending on defense, infrastructure, and law enforcement, for example, is essential. Other programs may have social value even if they reduce growth. But there is a trade-off: Our 15% to 30% of GDP sweet spot indicates the range in which public spending supports rather than hinders economic activity. Beyond that, every additional percent of GDP routed through government reduces future prosperity.
Regression Results
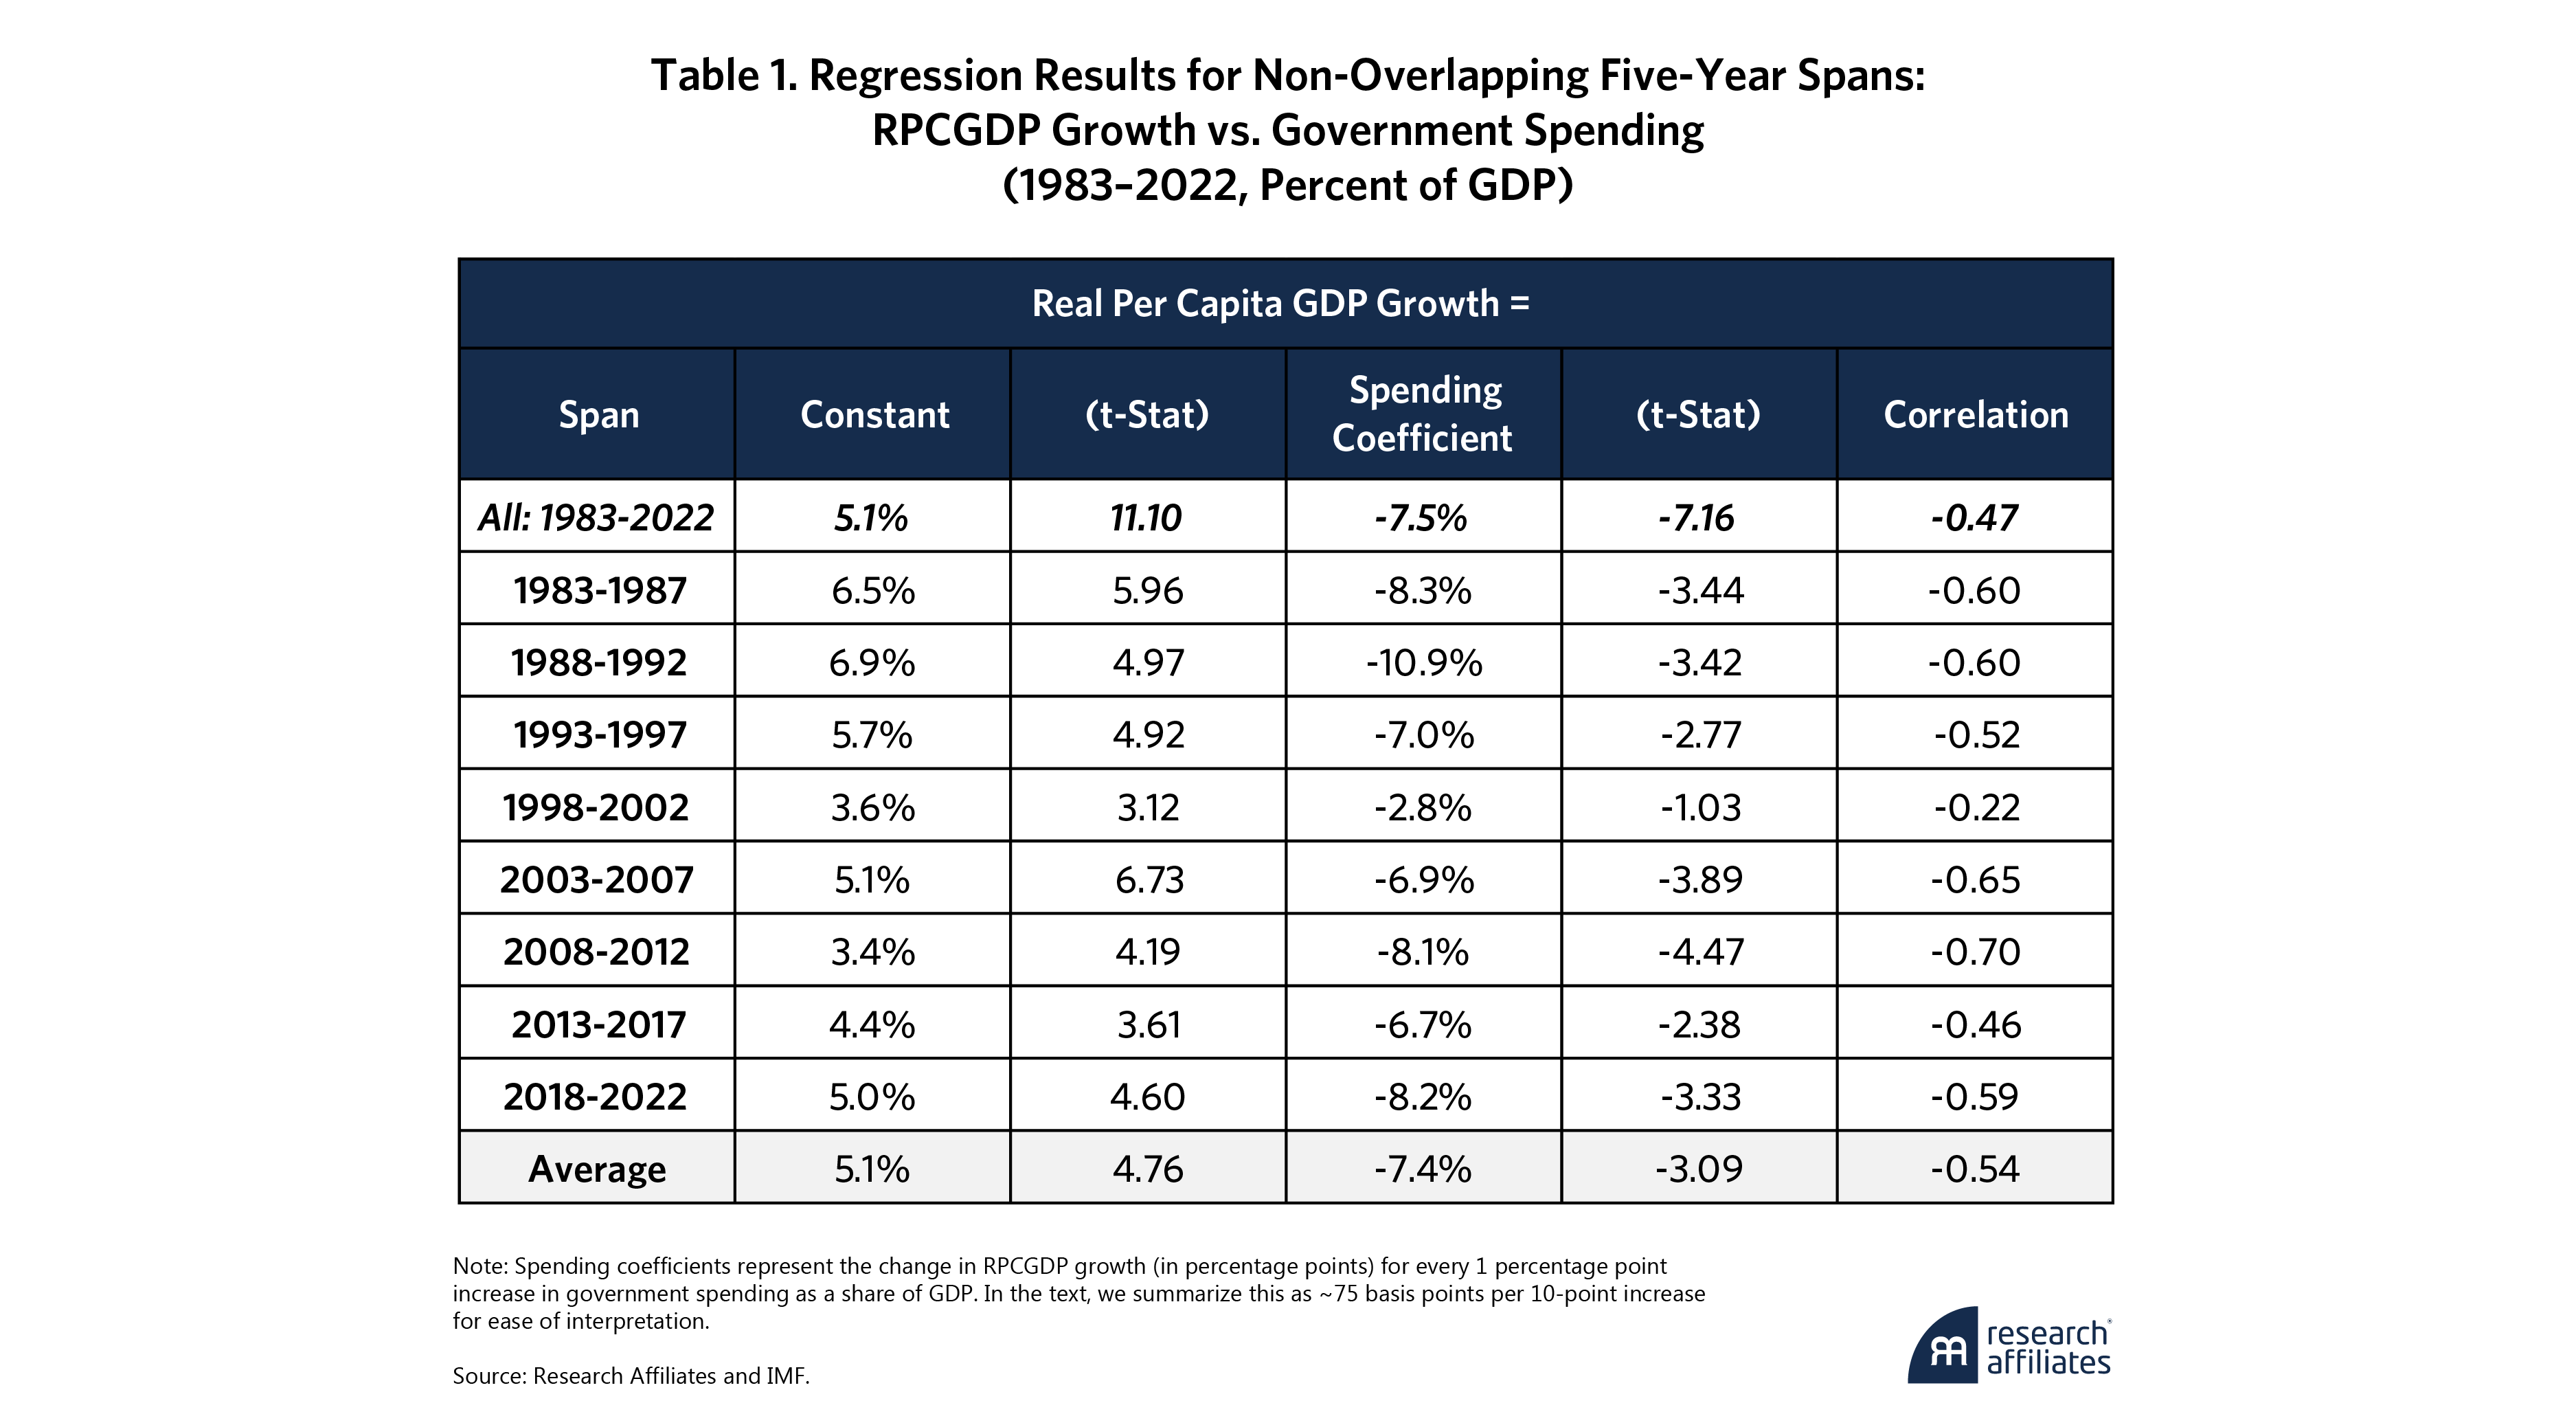
Table 1 shows regression results over eight five-year spans and the full 40-year sample period from 1983 to 2022. They are remarkably consistent. Over the full period, we find that for every 10% increase in government spending as a share of GDP, RPCGDP growth declines by 75 basis points (bps), with a highly significant -7.16 t-Stat.
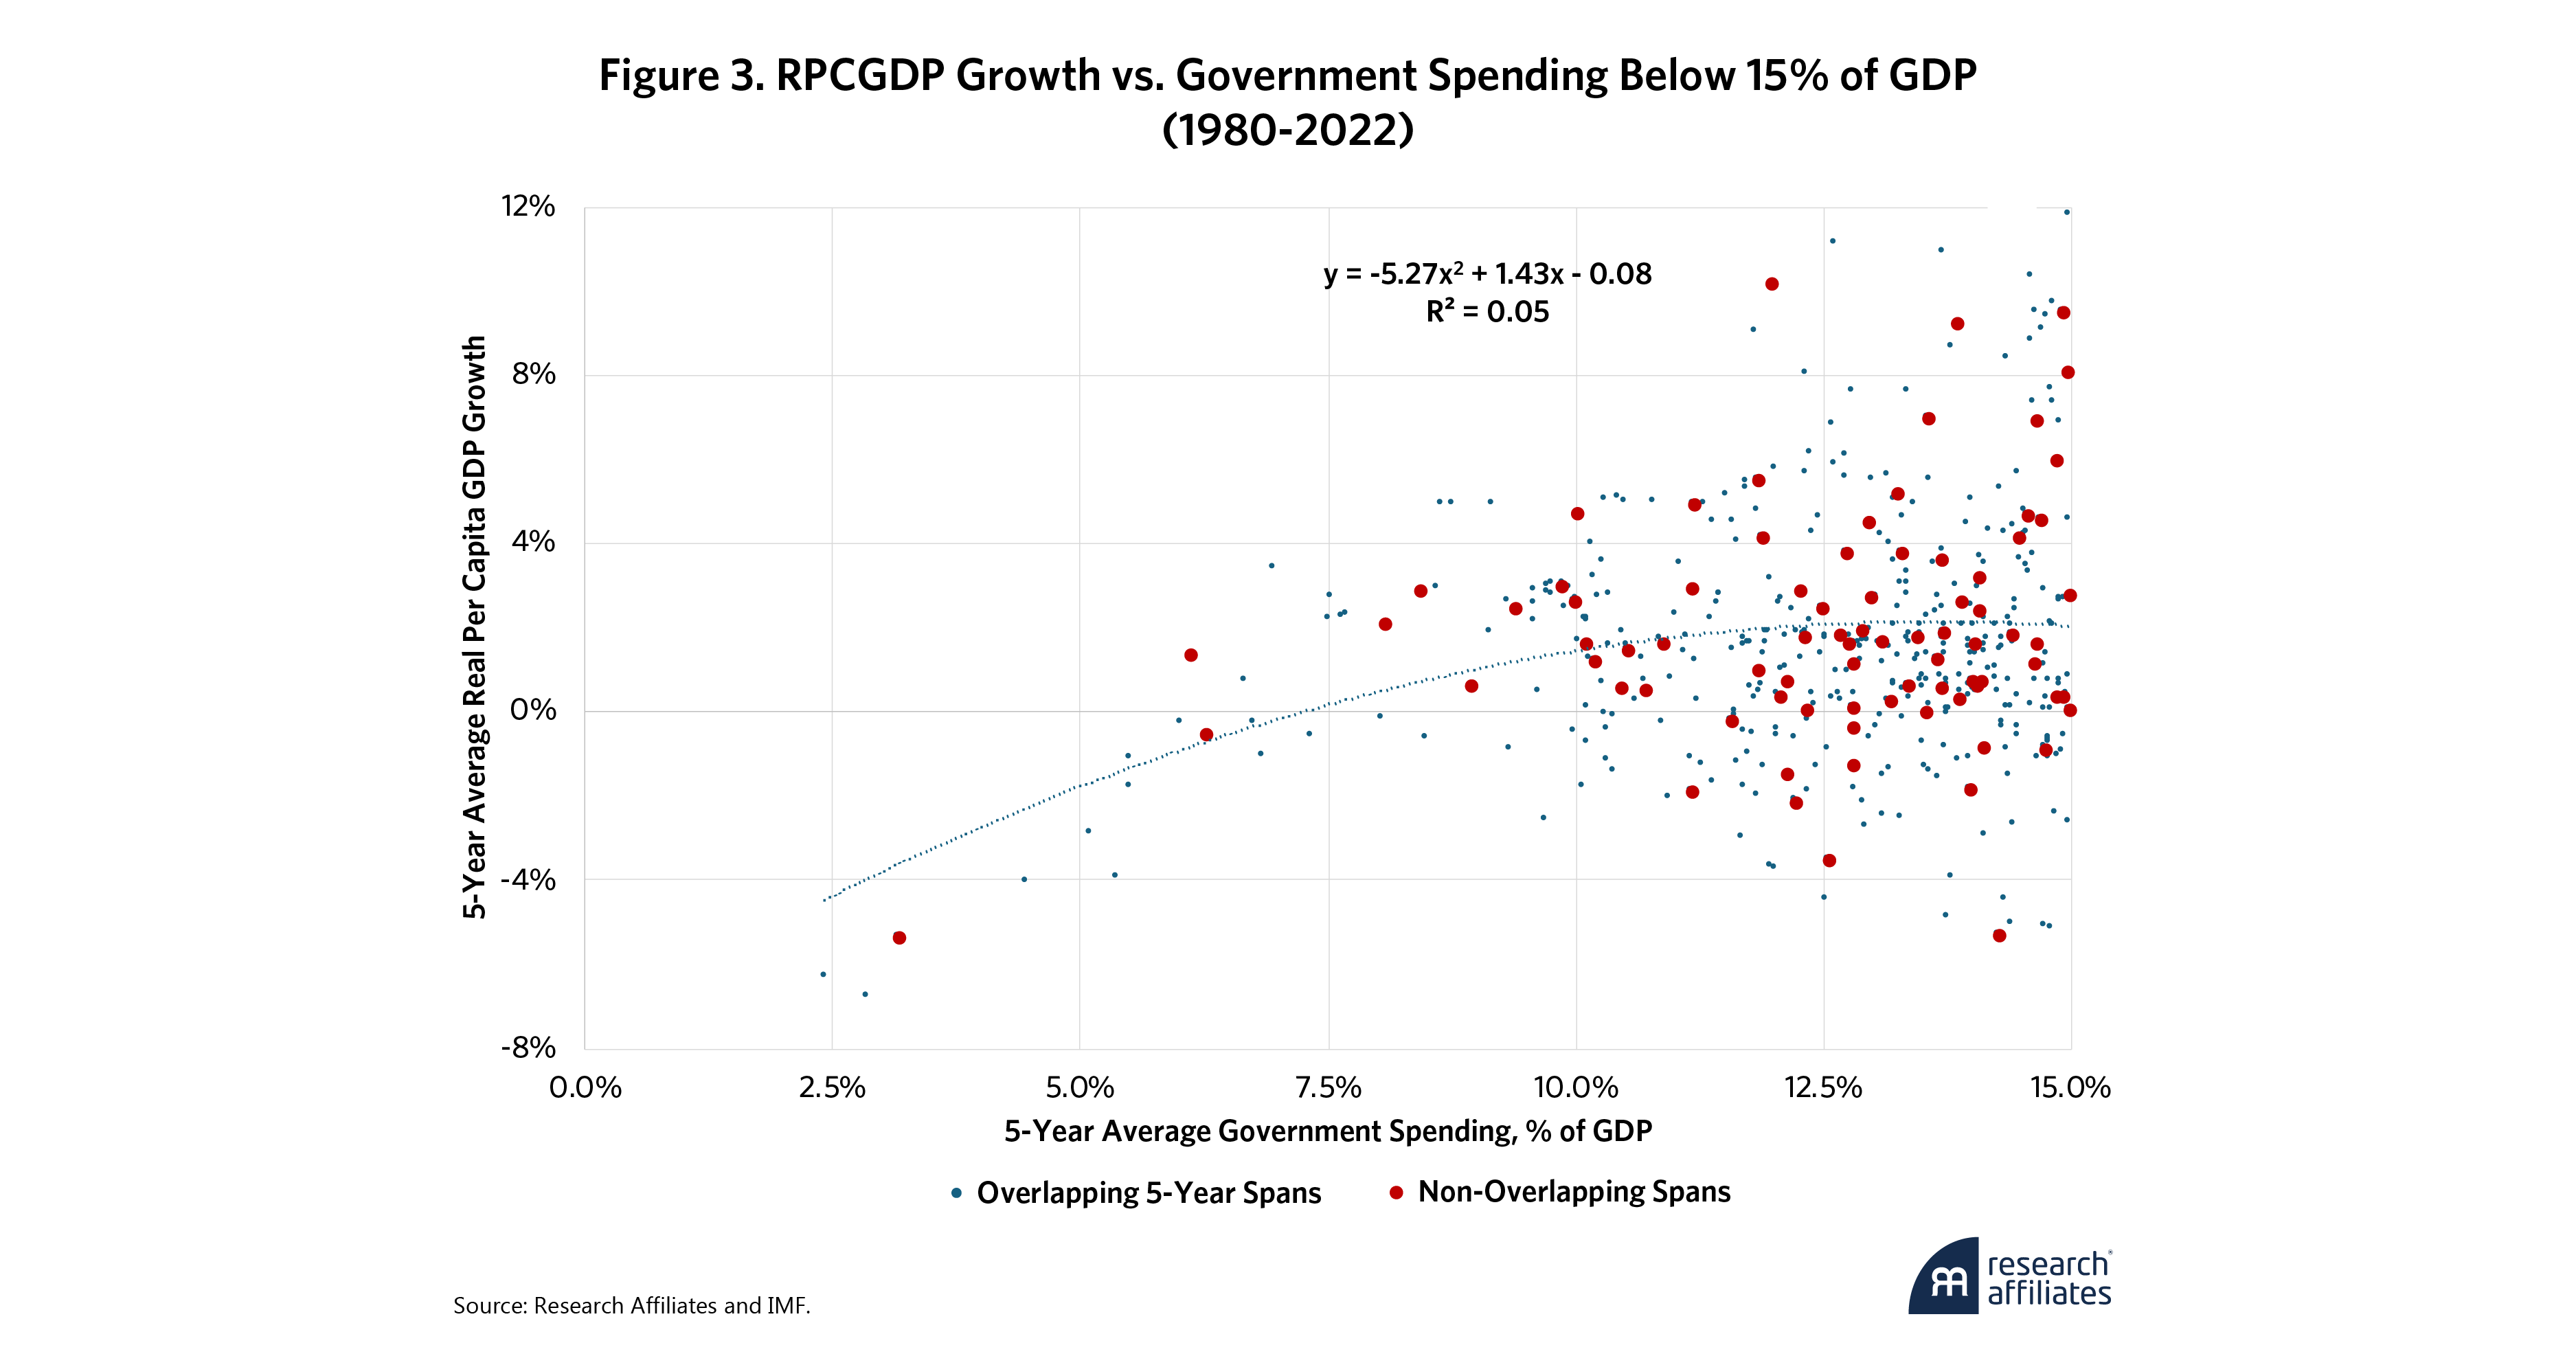
The relationship between government spending and growth is not entirely linear. In particular, it would be naïve to assume that RPCGDP growth will match the intercept of the regressions in Table 1—3.4% to 6.9% annual growth, if only we could eliminate all government spending. Figure 3 shows that government spending below 15% of GDP, which generally happens only in emerging economies, fails to support sustainable development.
Other than Singapore and South Korea, no developed OECD economy has kept government spending below 20% of GDP at any time in the past 40 years. Government is necessary to carry out basic state functions. When government spending falls below 7.5% of GDP, it opens the door to anarchy and warlords.3
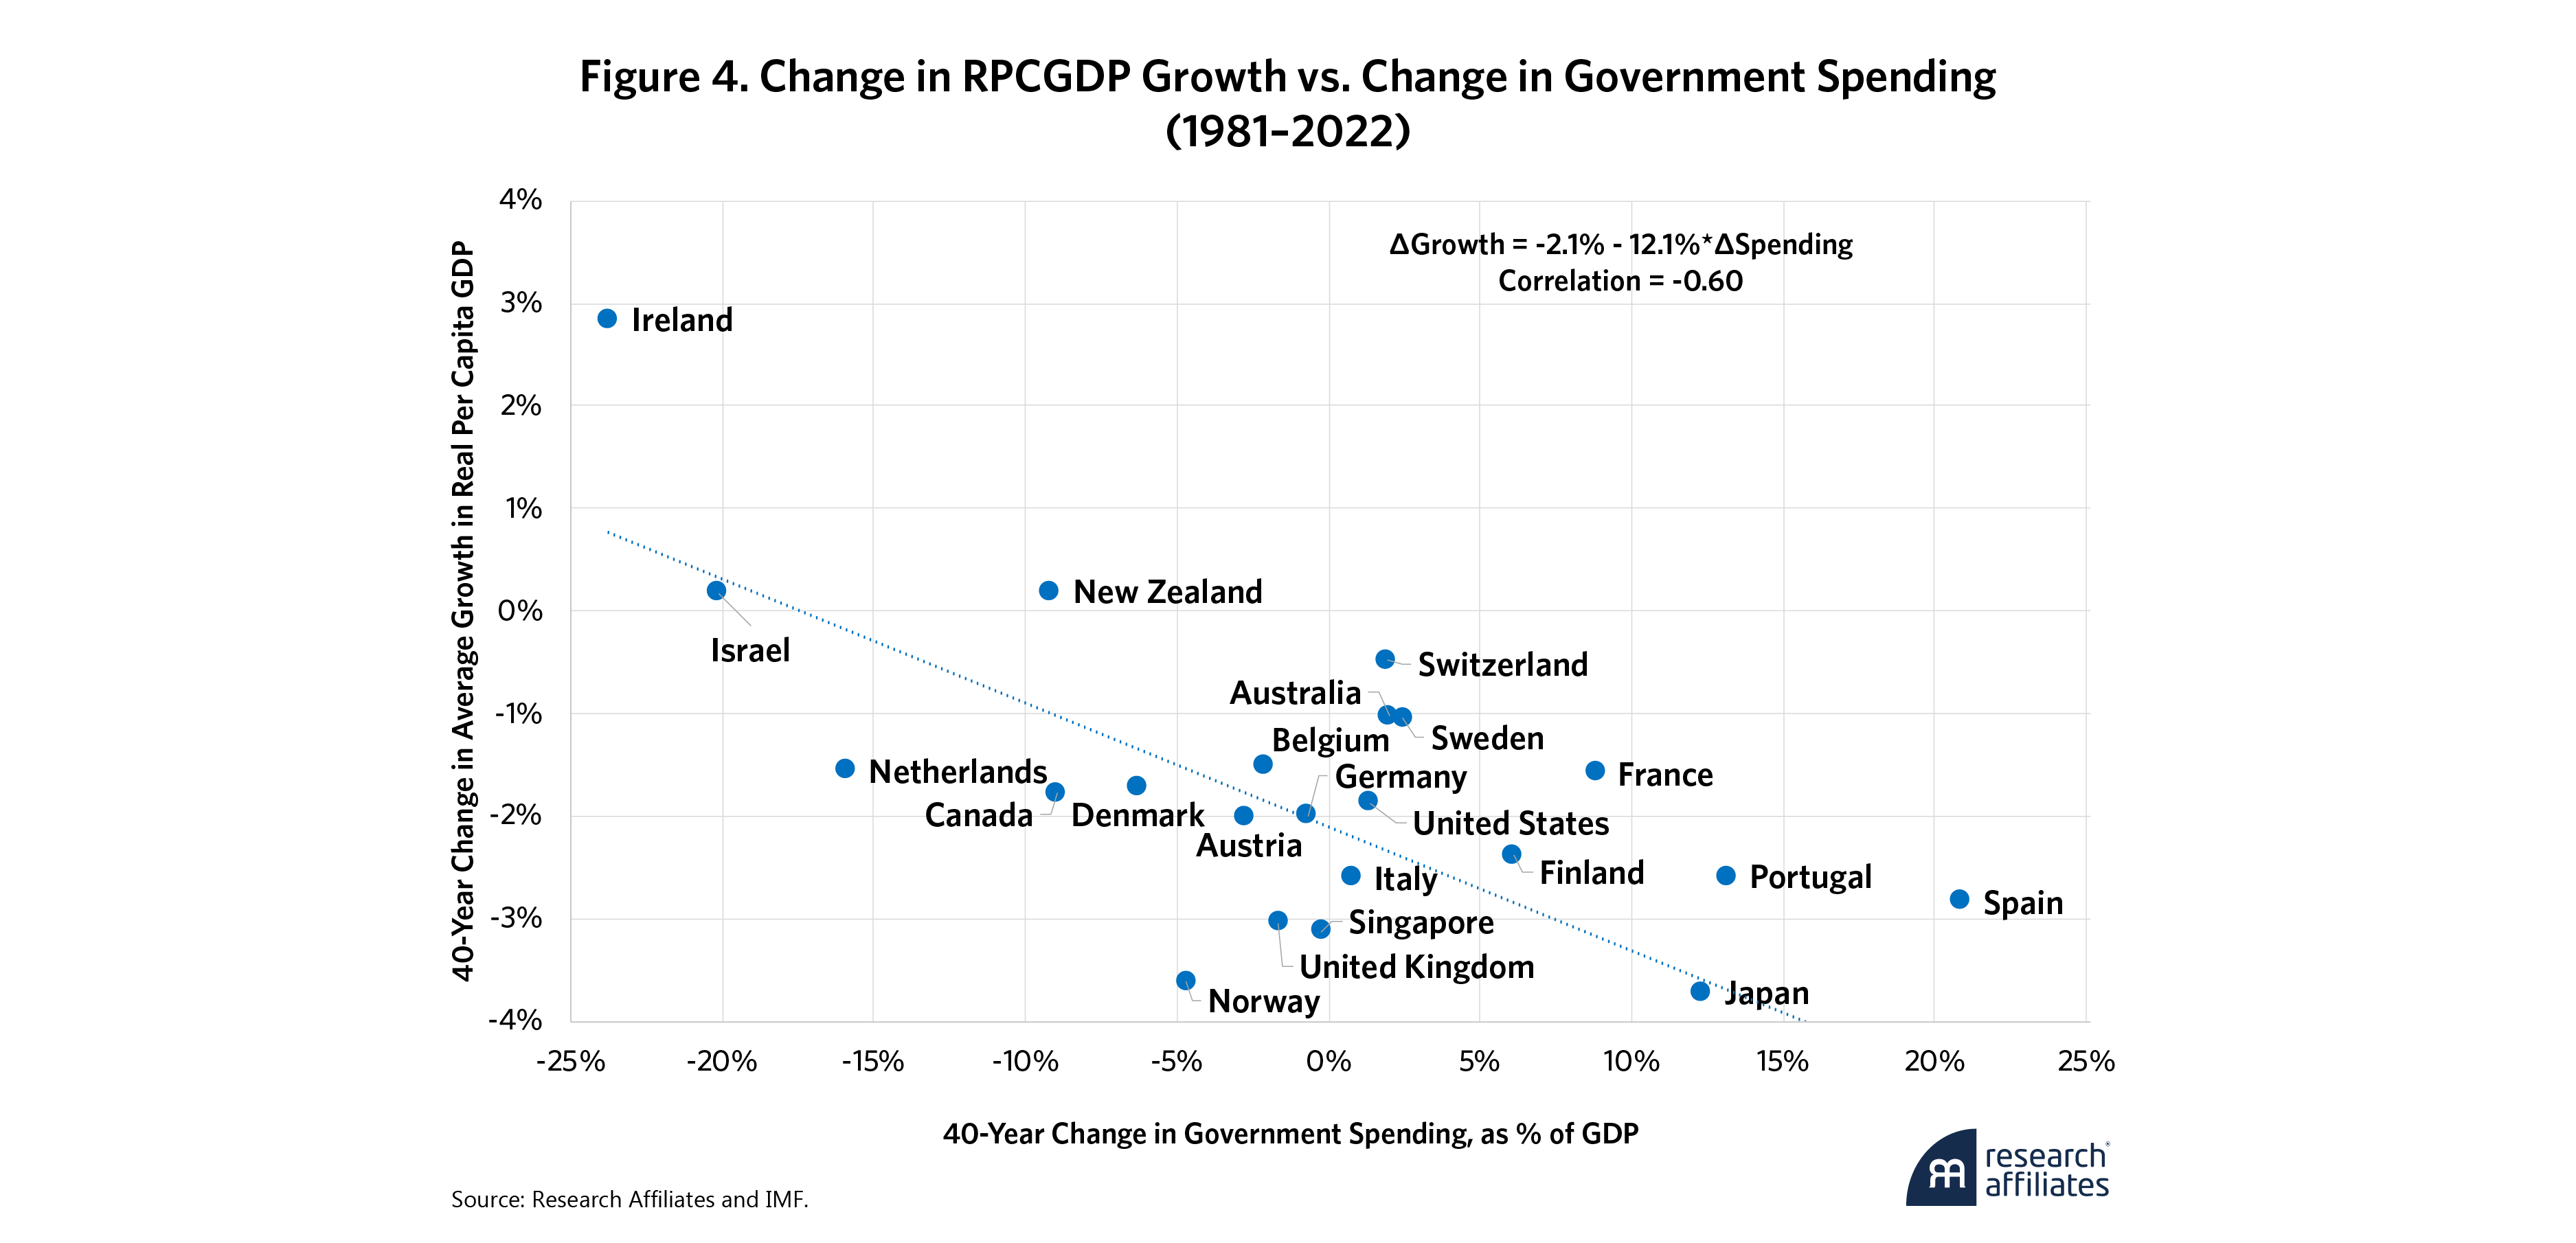
To control for starting development levels, we analyzed in-country changes in spending and growth. Figure 4 shows the change in RPCGDP growth versus the change in spending, with a steeper slope. On average, a 10% increase in spending corresponds with a 121 bps reduction in growth. In Ireland, which reduced government spending by an average of 25% of GDP per year over four decades, the growth rate rose by 320 bps. In contrast, South Korea increased spending by over 10% of GDP annually during the same period and experienced a concurrent 920 bps slowdown in growth (exceeding the bounds of the chart). Changes in spending often yield predictable changes in growth—more spending means less growth.
Do Deficits Matter?
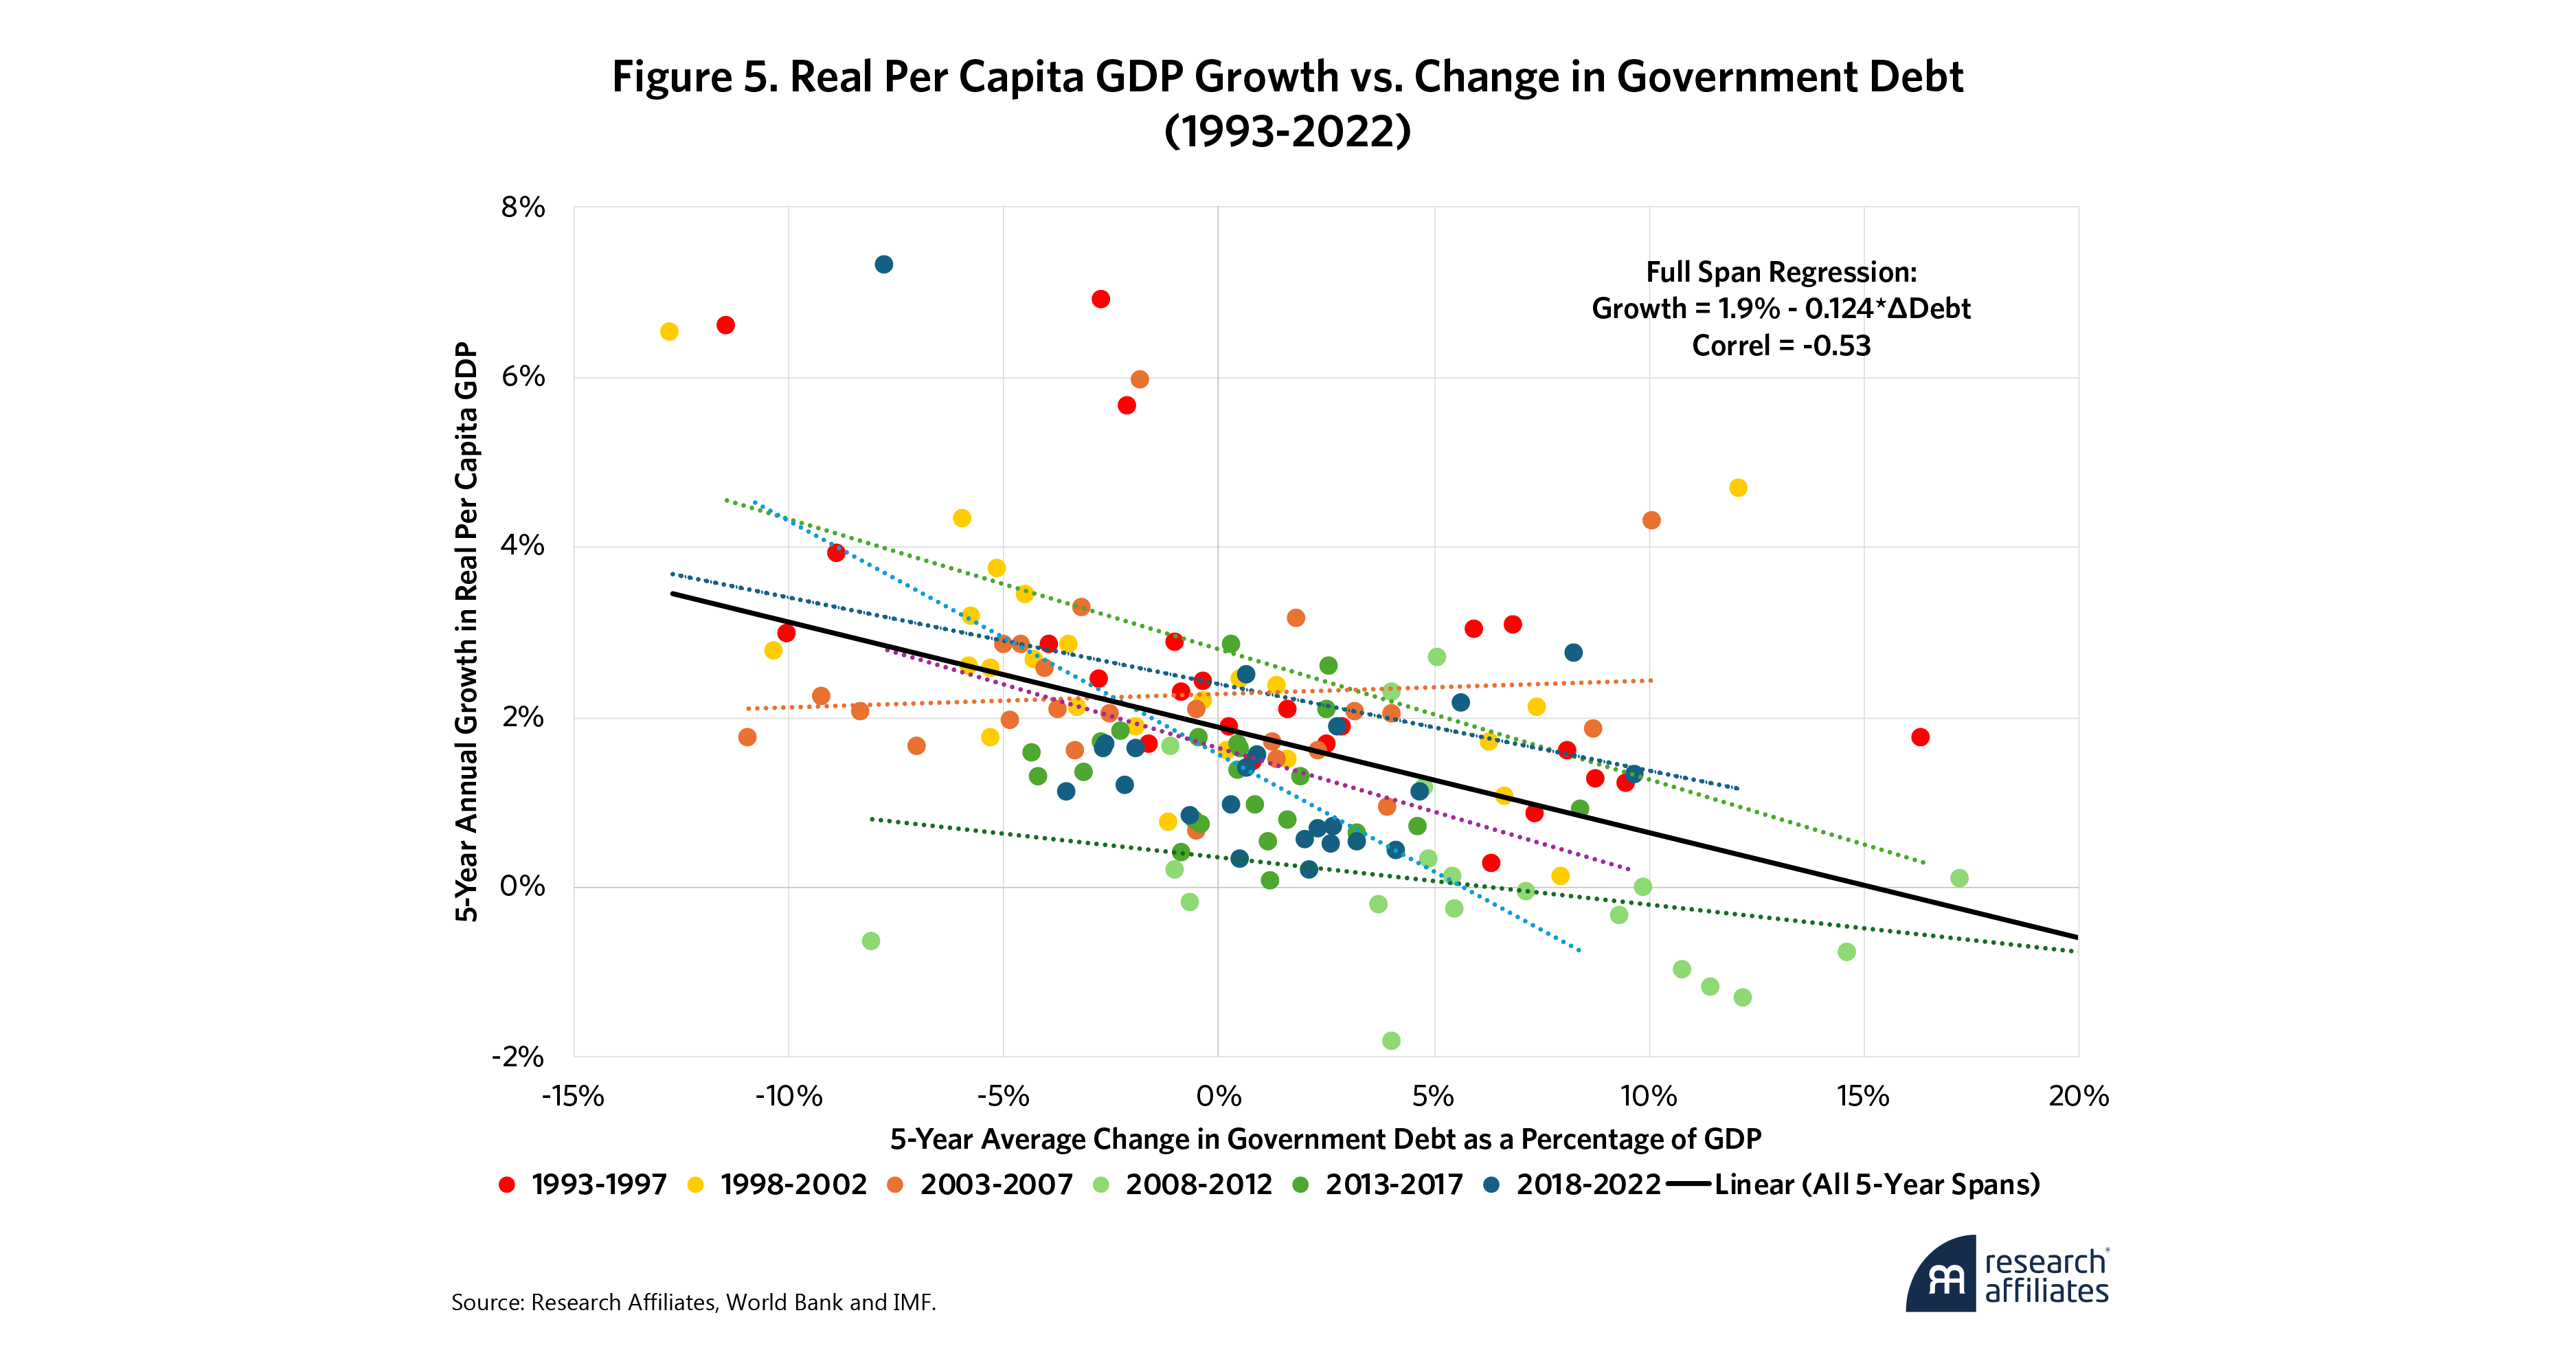
How does rising government debt affect economic growth? We examined OECD country data over six consecutive five-year periods, from 1993 to 2022. Figure 5 shows an overall negative correlation of 53%, with higher government debt linked to reduced RPCGDP growth in the full 30-year span. This negative relationship occurs in five of the six five-year intervals. These findings contradict the premise that debt issuance stimulates economic prosperity. In short, stimulus does not stimulate.
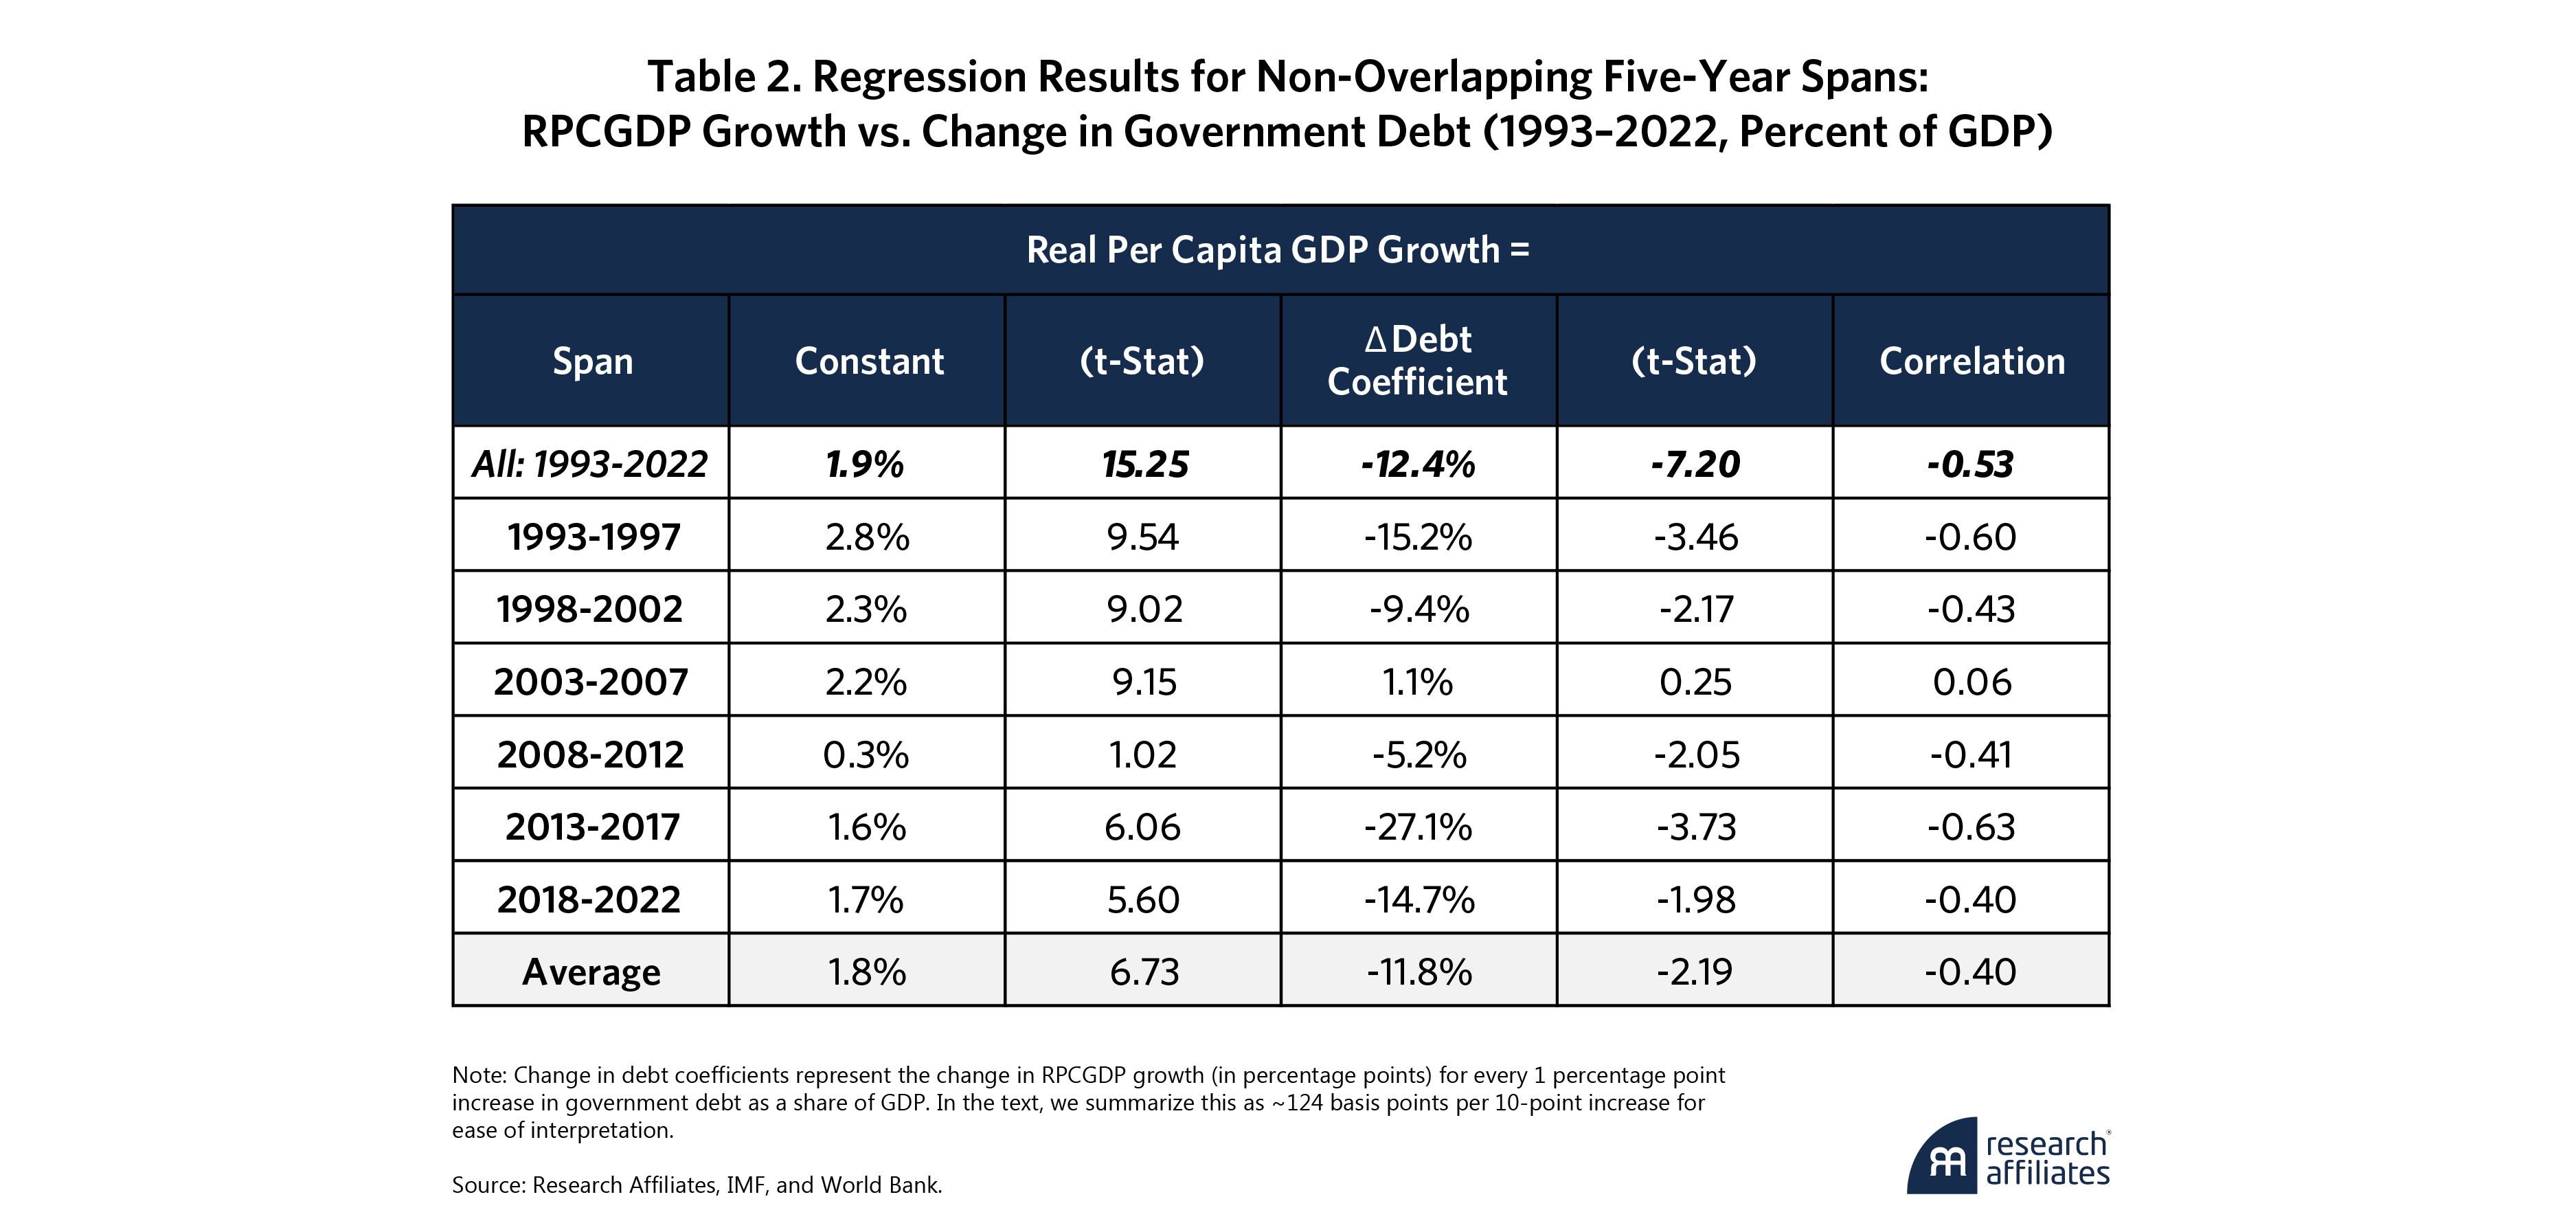
Table 2 shows the regression results for the various five-year intervals as well as the entire span. Over the full period, we find that a 10% increase in debt as a share of GDP corresponds to a 124-bp reduction in growth, with another highly significant t-Stat of -7.20.
Of course, correlation, no matter how strong, does not imply causation. Neo-Keynesians4 and modern monetary theory (MMT) advocates may challenge the proposition that higher spending and debt levels impede economic growth. Yet our findings are too stark to ignore. The likely conclusion is that higher spending actually causes slower growth. At minimum, the potential for unintended consequences must be part of the spending debate. Rather than buy into the stimulus-driven growth myth, we need to ask: How much long-term prosperity are we willing to sacrifice by reallocating economic functions from the private to the public sector?
To be sure, neo-Keynesians may maintain that deficit-financed government spending is essential during economic downturns. That is a sensible approach, when judiciously applied. Keynes himself emphasized the need to balance deficit spending during recessions by running surpluses during expansions. But developed economies have largely abandoned this discipline. U.S. federal budgets were last balanced in the late 1990s under Bill Clinton, and combined federal, state, and local budgets haven't balanced since 1957. Persistent structural deficits ignore this critical Keynesian nuance and risk an unprecedented fiscal crisis.
Changing the Conversation
Terms like “stimulus,” “fiscal impulse,” “monetary stimulus,” and “investment” all imply a lazy acceptance of government policy as a tool for economic growth. But the takeaway from our work, while inconvenient, is as undeniable as its implications are unavoidable. More government spending and higher debt have a strong correlation with slower real per capita GDP growth.
Terms like ‘stimulus,’ ‘fiscal impulse,’ ‘monetary stimulus,’ and ‘investment’ all imply a lazy acceptance of government policy as a tool for economic growth.
”Not all government spending is bad. But it does carry a cost, one that too often goes unacknowledged. Would many of us like more benefits and services from our government? Undoubtedly. But would we still want more if we knew that each additional dollar of government spending means less future prosperity? Perhaps not.
We’ve now quantified that tradeoff. The data shows a clear link between larger government and slower economic growth. Now the question is how much future growth are we willing to give up? That is the real cost of stimulus.
Please read our disclosures concurrent with this publication: https://www.researchaffiliates.com/legal/disclosures#investment-adviser-disclosure-and-disclaimers.
End Notes
1. See Schulthess, Duane, et al. “The Relative Contributions of NIH and Private Sector Funding to the Approval of New Biopharmaceuticals.” Therapeutic Innovation & Regulatory Science. January 2023. “NIH funding for the 18 FDA-approved therapies totaled $0.670 billion, whereas private sector funding (excluding post-approval funding) totaled $44.3 billion. A logistic regression relating the levels of public and private funding to the probability of FDA approval indicates a positive and significant relationship between private sector funding and the likelihood of FDA approval (p ≤ 0.0004).” In other words, the NIH paid 1.5% of the cost of medical research, and NIH-funded therapies were less likely to receive FDA approval.
2. See Worldometer, “Life Expectancy of the World Population.” The 79–80 life expectancy cohort includes Panama, Albania, the U.S., Estonia, Saudi Arabia, and New Caledonia.
3. In our dataset, these instances are characterized by countries like Haiti and the Democratic Republic of the Congo.
4. What’s the difference between Keynesian and neo-Keynesian economics? In our view, the former advocates increased spending to stimulate animal spirits during dispirited times, recessions, while the latter accepts or promotes a policy of perpetual deficit spending.
References
Brightman, Christopher, and Pickard, Alex. “A Stealth Tax on Prosperity.” Research Affiliates, June 2024.
Reinhart, Carmen M., and Rogoff, Kenneth S. “Growth in a Time of Debt.” American Economic Review, 2010.
Clark, Colin. "Public Finance and Changes in the Value of Money." The Economic Journal 55 (220), December 1, 1945.
Scully, Gerald W. “Optimal Taxation, Economic Growth, and Income Inequality.” Public Choice, 2003.
Tanzi, Vito, and Schuknecht, Ludger. “Public Spending in the 20th Century: A Global Perspective.” Cambridge University Press, 2000.
Bergh, Andreas, and Henrekson, Magnus. “Government Size and Implications for Economic Growth.” The AEI Press, 2010.
