
The equity risk premium, a comparison of equity and bond yields that is now close to its historical average, has been used by others as justification that US stocks are fairly valued or even cheap, the position recently taken by Jerome Powell, Chairman of the Federal Reserve.
Although yields are at historically low levels, their recent upward tick appears to be the market’s response to fear of the two-headed monster of slow growth and rising inflation, a circumstance that may likely cause the US Federal Reserve to adopt new policies.
An examination of the policy options available to the Fed leads us to conclude that the central bank will strongly consider yield-curve targeting, which indicates US equities and bonds may be poised for additional positive returns in future.
Now, for ten years we've been on our own,
And moss grows fat on a rollin' stone
But that's not how it used to be.
– Don McLean in “American Pie”
Duration risk, as most investors know, is the risk associated with changes in interest rates. The longer the duration of the asset, the more affected it should be by changes in underlying rates. Duration risk is most often associated with fixed-rate bonds, but equities are also considered long-duration assets. Although opinions vary on how to properly calculate equity duration, a common approach is the inverse of the dividend yield. The dividend yield of the S&P 500 Index has hovered between 1.5% and 2.0% over the last few years, equating to a duration of between 50 and 67 years. This is an interesting factoid, but what does it have to do with anything?
Over the last few years, many in the industry, myself included, have discussed that equities were overvalued, justified by tightening yields and high price-to-earnings multiples. At the same time, others have used the equity risk premium (ERP), a comparison of equity and bond yields, as justification that US stocks, in particular, have actually been cheap. The story goes that stock investors are willing to accept a lower yield because the alternative—bonds—is also trading at a low yield.1
This explanation was recently used by Jerome Powell, Chairman of the Federal Reserve—“Admittedly (price-to-earnings multiples) are high…but that’s maybe not as relevant in a world where we think the 10-year Treasury is going to be lower than it’s been historically from a term perspective” (Cox, 2020)—and Professor Robert Shiller—“But with interest rates low and likely to stay there, equities will continue to look attractive, particularly when compared to bonds” (Shiller, Black, and Jivraj, 2020).
A comparison of the current value of bonds versus stocks within the context of the equity risk premium, coupled with potential US Federal Reserve policy direction, leads us to conclude that risk assets, such as equities and corporate bonds, may be poised for additional positive returns in the future.
Equity Risk Premium
Compared to its own history, until very recently the equity risk premium has indeed been cheap, that is, it had a higher yield than its average over time. The ERP can be computed several ways. I borrow from Professor Shiller and use the inverse of the cyclically adjusted price-to-earnings ratio compared to the real 10-year US Treasury bond yield.2
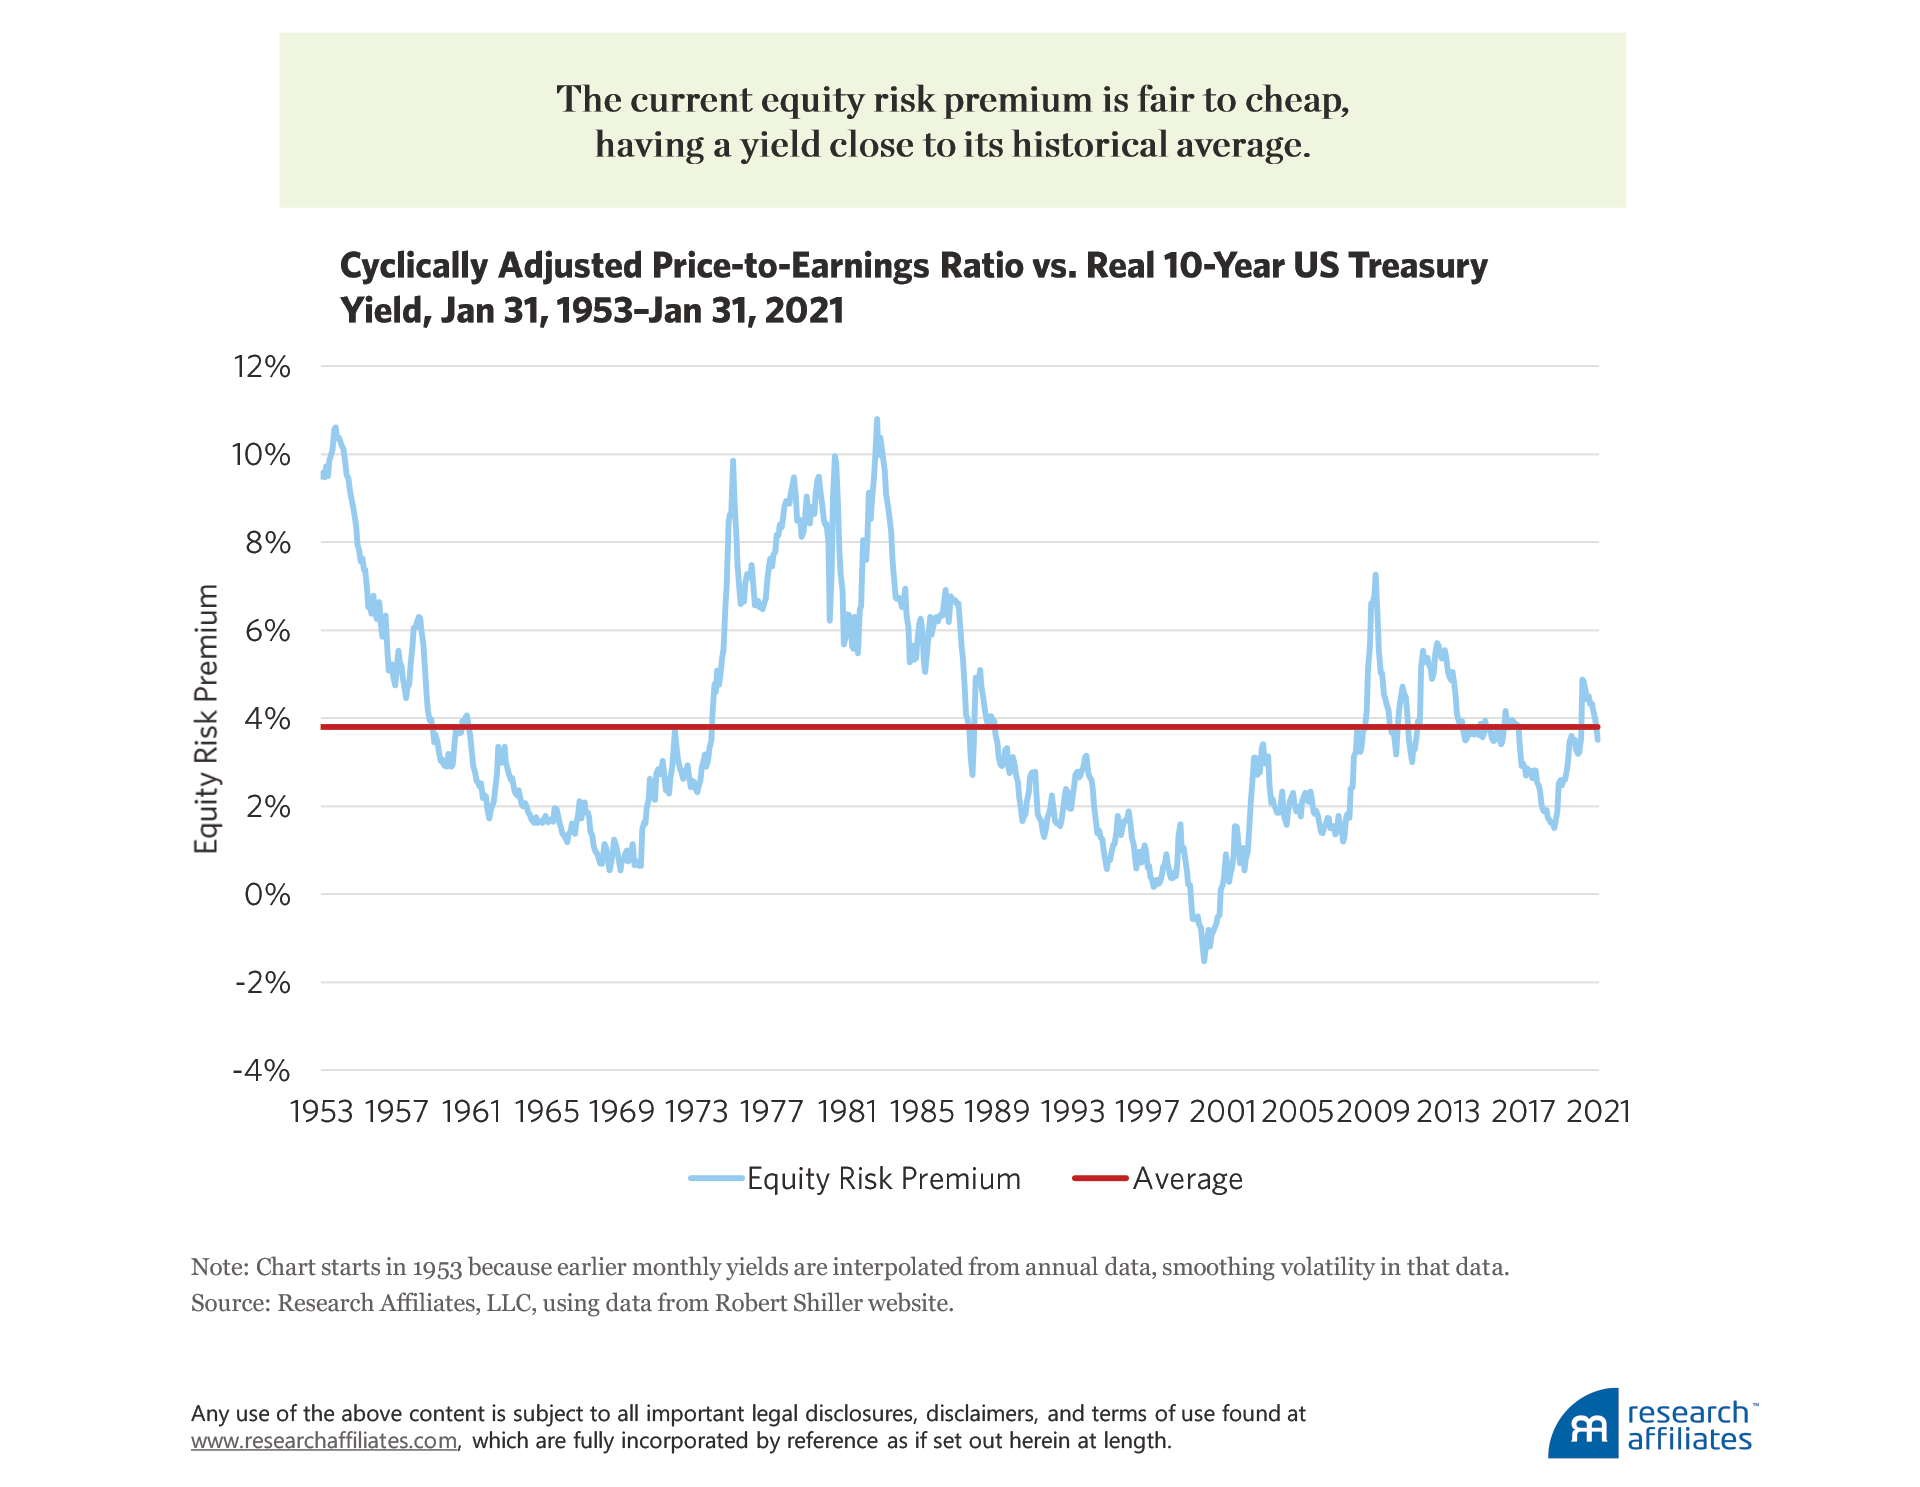
Although the high equity risk premium is used as a justification for the fair, or even cheap, valuation of stocks, and therefore, for an outright long position in stocks, that interpretation is not entirely correct. Because the equity risk premium is based on the relative comparison of stocks to bonds, the appropriate trade is actually to go long equities and short long bonds (or overweight stocks and underweight long bonds relative to a neutral positioning).
This distinction is important because in an ERP view of the world, on an absolute basis, stocks can still be expensive because bonds are expensive. Suppose an investor uses her cash to only buy equities. If bond prices drop because bond yields rise, equity prices are also expected to drop as equity yields rise. Without the offsetting long bond position, the investor would still lose money, and probably not feel any better that bonds were the cause. Investors were facing this scenario in the last weeks of February.
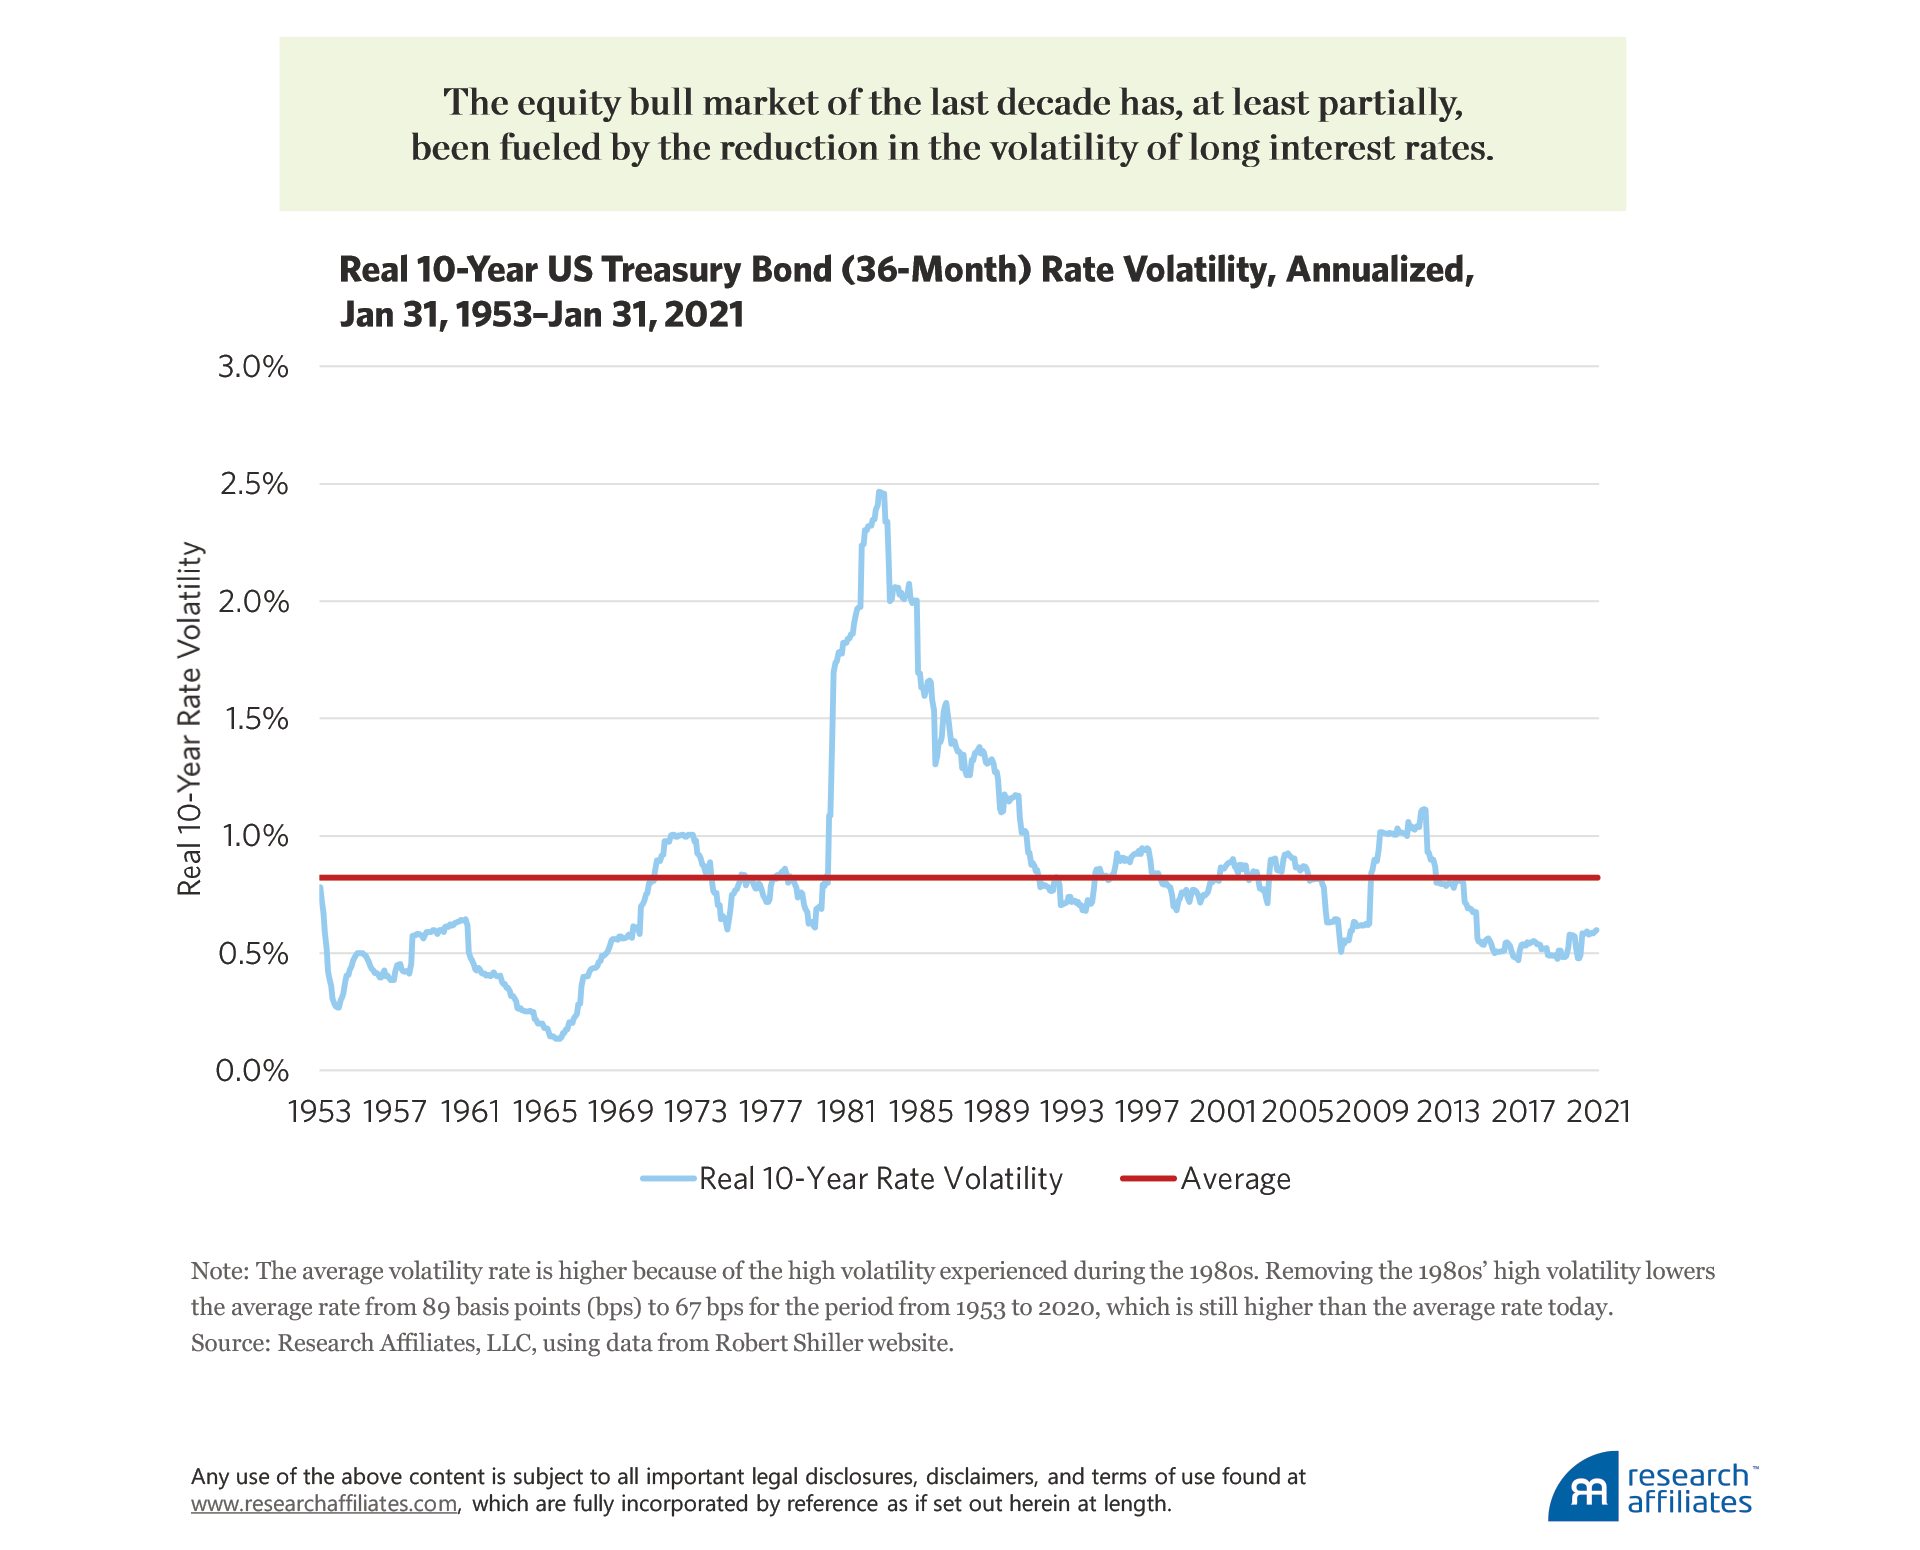
The equity bull market of the last decade has, at least partially, been fueled by the reduction in both the level and the volatility of long interest rates.3 As investors in short-volatility instruments and carry trades, which are inherently short vol, can attest, short-volatility bets can be highly profitable for a time, but can quickly blow up in your face. This is true unless additional information indicates the probability of a blow out in rates is even lower than it should be under normal circumstances.
I believe such information exists. Before getting to that discussion, however, let’s review the drivers of long-term rates in order to gain an appreciation for the current valuation of bonds. After all, if both the ERP and bonds are cheap, an investor’s portfolio positioning becomes much more obvious.
Background on Long-Term Rates
Recalling basic investment theory, bond yields have two distinct drivers: the expectations hypothesis and the term premia. The former is simply the idea that long-term yields are determined by the expected path of short-term yields into the future.4 In a world of zero yield uncertainty, an investor should be ambivalent between owning a long-term bond to maturity or buying and rolling over a series of short-term bonds.
In reality, future yields are uncertain and that uncertainty is captured in the term premia. Uncertainty in government bond yields is mostly related to future changes in monetary policy, whereas uncertainty in corporate bond yields also incorporates an element of counterparty, or default, risk.
Several models decompose bond yields into the two components of expectations hypothesis and term premia. Using the model of Adrian, Crump, and Moench (2013), we can plot these two components to gain a better understanding of the magnitude each has played historically in the 10-year US Treasury yield.
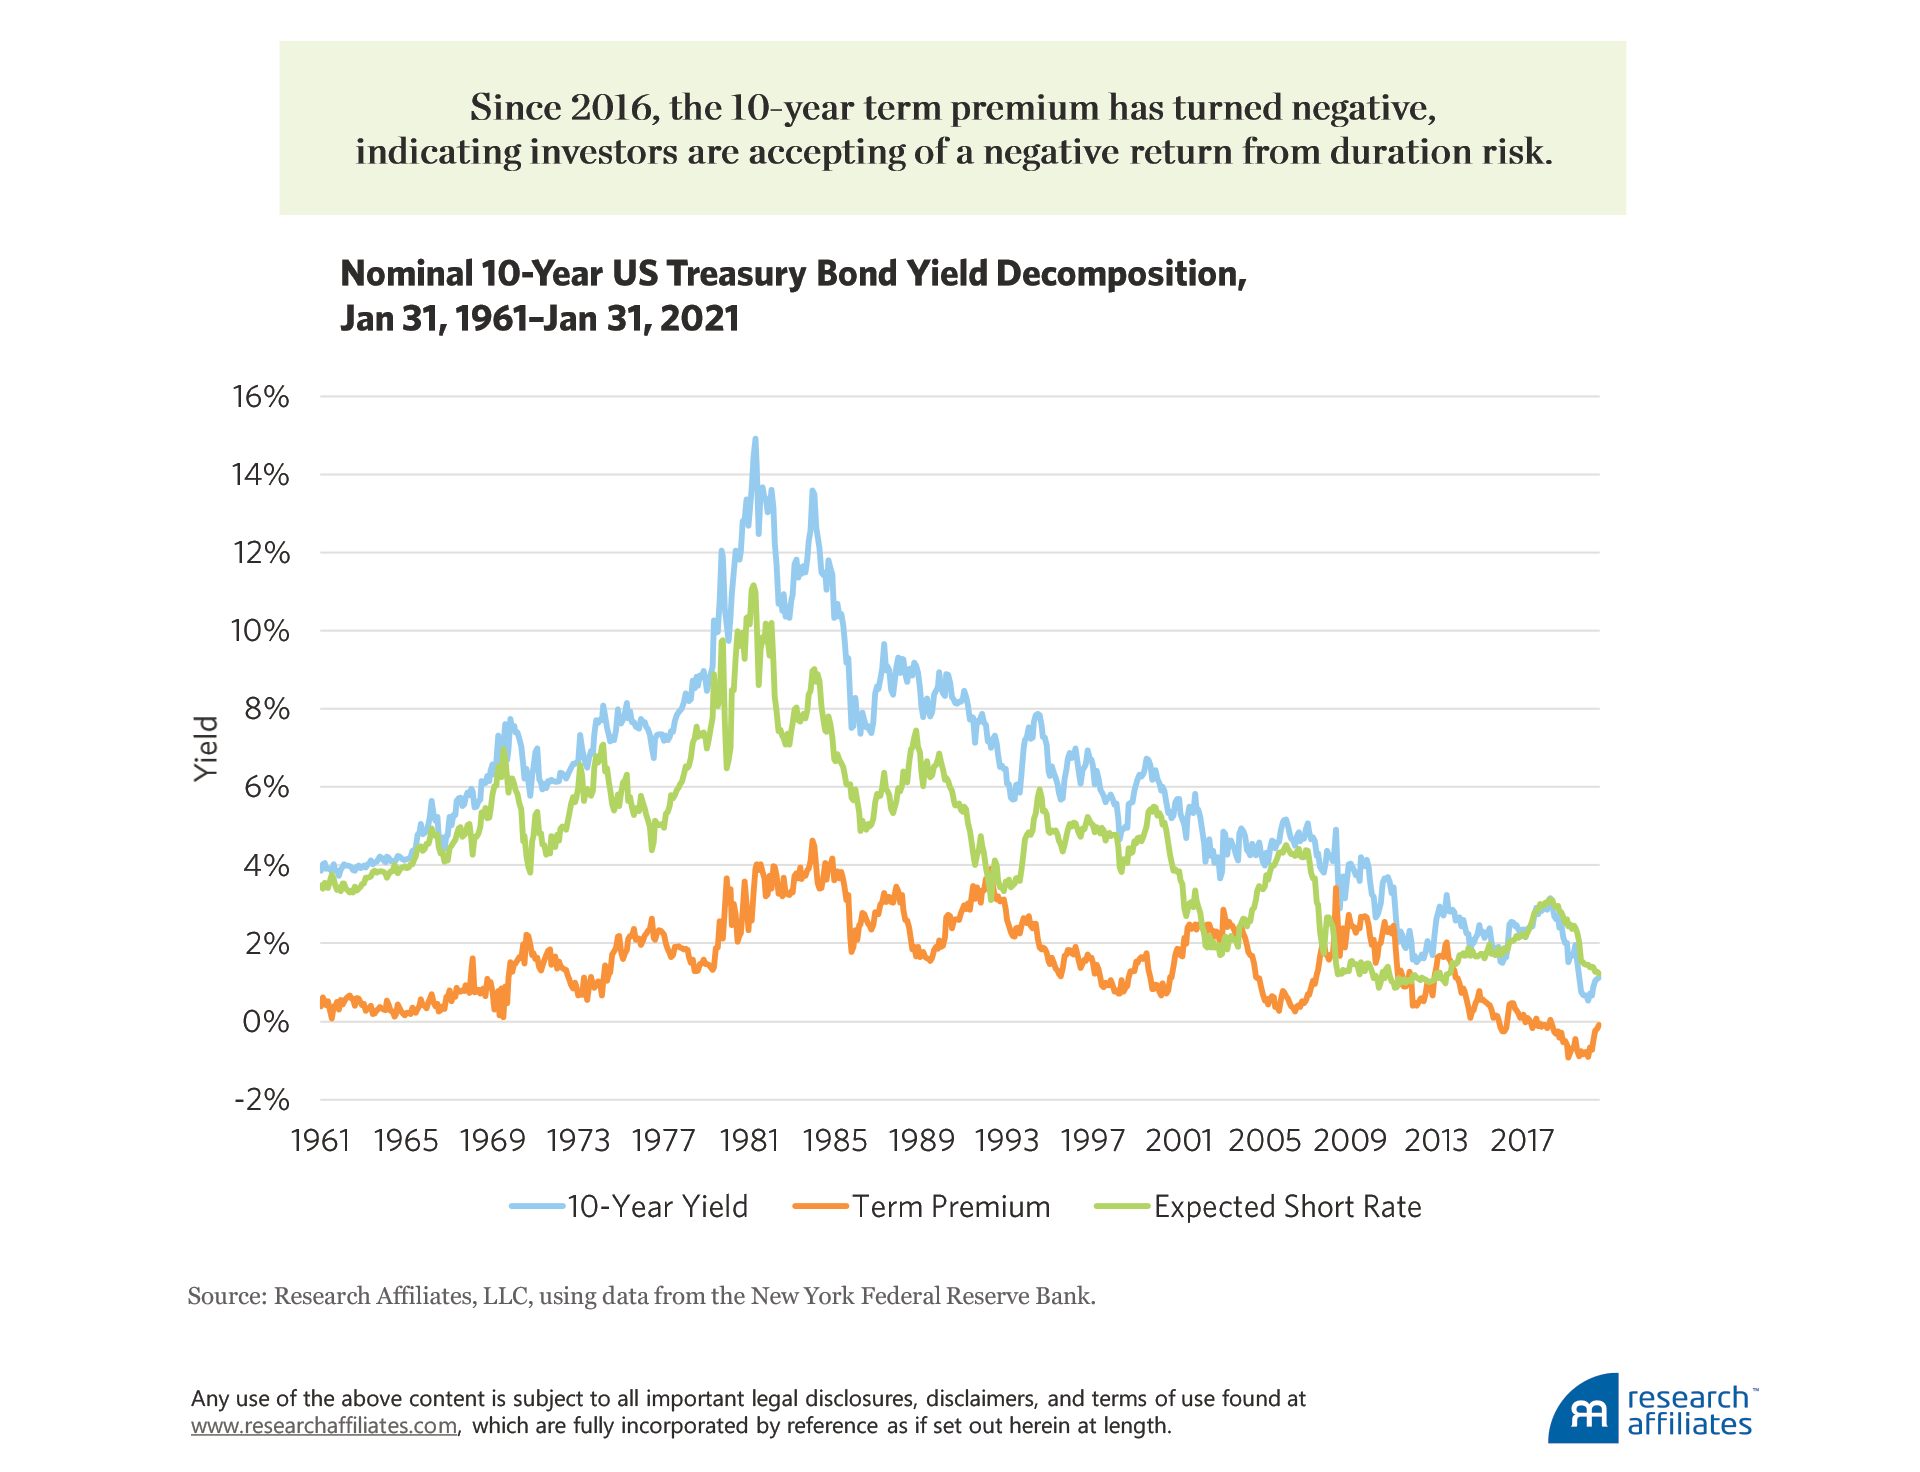
The majority of 10-year US Treasury bond yields have historically (back to 1961) been determined by the expected path of future short-term rates, with unforeseen circumstances usually adding 1% to 2% to the yield and thus compensating investors for taking duration risk. Since 2016, the 10-year Treasury term premium interestingly has turned negative, indicating investors have been willing to accept a negative return from duration risk. This acceptance indicates the richness of bonds as opposed to investing in and rolling over short-term instruments, and that the market has been expecting consistently lower nominal rates for some time. The market’s expectation is not surprising given lower real trend economic growth, relatively low inflation, and low probability of inflation shocks.
Recently, the term premium has turned upward, but as of today remains in negative territory. The upward tick could be due to higher real economic growth or to expectations of rising inflation. Given the slow-growth starting point, it appears the market is fearful of the two-headed monster of slow growth and rising inflation, a circumstance that may likely cause the US Federal Reserve to adopt new policies.
Yield-Curve Targeting
Starting in 2008 and ending in 2014, the Fed expanded its balance sheet by engaging in a series of quantitative easing (QE) programs. The Fed reinstituted these programs in response to the COVID-19 crisis of 2020.
Given the market’s and the public’s familiarity, if not acceptance, of QE policies, the Fed may continue with these policies. If, however, bond yields continue to rise over the next few months, the Fed may need to curb the rise by transitioning to a new paradigm: yield-curve targeting. Both higher real rates and future inflation can be inhibitors of economic growth and full employment, and the Fed is keenly aware of both. Consequently, the probability of yield-curve targeting is rising even if the yield slope is not particularly steep. Today, the 10-year slope is near its 50-year average of 1.5%, but has risen 50 basis points (bps) over the last two months.
A key to understanding a possible change in direction is in understanding the subtle difference between the two types of programs. Quantitative easing focuses on investing a particular dollar amount and letting the market determine yields. In comparison, yield-curve targeting, or yield-curve controls (YCC), focuses on pegging to a particular yield, using whatever dollar amount is needed based on the market.
Forward guidance is another mechanism the Fed uses to signal future intent regarding short-term rates. Yield-curve targeting goes further, indicating target rates for longer-duration bonds and taking the direct market actions needed to defend those pegged values.
Although unknown to many investors, yield-curve controls were adopted by the Fed in 1942 to help the US government finance World War II (Humpage, 2016). At that time the Treasury and the Fed agreed to cap short-term rates at 37½ bps and long-term rates at 250 bps.
Yield-curve targets have also been instituted internationally, including in Japan in 2016 and more recently in Australia in 2020. Even in January 2021, the European Central Bank (ECB) was getting in on the action by discussing their plans for YCC. The unique challenges to a monetary union of multiple countries may mean the ECB would need to focus on targeting spreads between countries as opposed to yield levels. Even if the Fed doesn’t pursue an explicit yield-targeting policy, globally diversified investors should still be aware of these global developments by central banks.
Pros and Cons of Yield Targeting
Because yield-curve controls focus on the Fed’s desired yield, the amount of balance sheet expansion can be relatively small or quite large. In contrast, as previously stated, a QE policy predetermines the amount of central bank buying. The key to successful YCC is the level of persuasiveness the central bank has in the market, not unlike the Fed’s promise to backstop the credit markets by buying corporate debt. The market tended to believe a strong backstop was in place, so that Fed buying never needed to approach predefined limits.
Similarly, if the market is adequately convinced the Fed is willing and able to buy securities at the pre-specified rate, the market clearing price will be set at the target rate and private investors will pick up much of the load of transactions. This is similar to the experience in Japan, where the amount of buying by the Bank of Japan has been less under YCC than under its QE programs. If, however, the market does not believe the central bank has the firepower to maintain the peg, private buyers will not emerge, and the central bank will be forced to buy large amounts of securities.5
What might the key target rate be? To get an idea, let’s look at the historical spread of 10-year Treasury maturities versus the short-term (three-month T-bill) rate over the period 1966 through January 2021. The median spread versus the short-term rate is 1.5%, close to the current level. If we assume the Fed will want to lower yields from where they currently are, but not want to cap rates at too low a level, a value between the current level and one standard deviation below the historical average seems fair. One standard deviation below the average is about 0.5%, meaning that halfway between that level and the current 1.5% is a potential 50 bp reduction from today’s 10-year yield. From the current 10-year Treasury yield, a target of 1.0% would imply price appreciation of 4.0% assuming a duration of about 8 years and no convexity (the appendix provides the derivation of equity duration). Ergo, there may yet be a little skin on the bone for those investors currently holding Treasury bond positions.
Portfolio Positioning
From an absolute valuation perspective, equities are expensive when looking at a variety of different valuation multiples; on a relative basis, however, the equity risk premium is still cheap to fairly valued. By taking an overweight position in equities along with an underweight in Treasury bonds, an investor can extract the ERP, but does so by making an explicit short bet on rate volatility. As most investors know, short volatility bets are prone to crashes—unless investors are aware of unpriced information that indicates rates will stay low. The market’s focus on slow growth with potentially higher inflation, coupled with the Fed’s desire to encourage growth and employment, indicates a potential for yield-curve targeting in the US market. YCC are already underway in many developed countries.
If yields are pegged by the Fed, US equity prices should move higher. Existing US bondholders could benefit as well because historical precedent suggests a potential 10-year pegged rate 50 bps below today’s yield. Should the 10-year Treasury yield hit that lower rate, continuing to hold bonds likely only provides modest yield without opportunity for capital gains. In addition to equities, other risk assets such as investment-grade and high-yield credit, currently trading at compressed spreads, should also benefit, as should gold and other commodities due to tumbling real yields and dollar weakening.
Appendix: Derivation of Equity Duration
Duration captures the percentage change in a security’s price per arithmetic change in rates. To calculate the duration of an equity security, we start with the Gordon Growth Model and take a derivative with respect to rates, r,

Dividing both sides of the equation by 1 over the price and simplifying shows that duration is equal to 1 over r minus growth, as follows:

For convention purposes, the −1 is dropped because duration is usually stated as a positive number. The −1 is important, however, because it indicates that the relationship between yield change and price is negative. Thus, when we calculate a price change due to a change in rates, the duration is then multiplied by −1,

Please read our disclosures concurrent with this publication: https://www.researchaffiliates.com/legal/disclosures#investment-adviser-disclosure-and-disclaimers.

Endnotes
- The comparison of stock and bond yields is often referred to as the Fed model, and compares equity yields to nominal bond yields. We prefer to compare equity yields to real bond yields (i.e., net of inflation).
- Equities have a long duration, so the argument could be made that the 30-year US Treasury bond may be a more appropriate comparison. The US Treasury did not start issuing 30-year bonds until the 1960s, thus we use the 10-year US Treasury bond to provide a longer history.
- The level of bond yields and the volatility of bond yields have been highly correlated in the past.
- The expectations hypothesis is based on extracting forward rates from the current yield curve to determine the future path of interest rates.
- Inflation may be one reason investors would not be convinced. If investors think the capital injection will fire up inflation, they will in turn be wary of the Fed’s ability to maintain a pegged rate. As investors consider how to position their portfolios in an era of YCC, a perspective on inflation is a key consideration.
References
Adrian, Tobias, Richard Crump, and Emanuel Moench. 2013. “Pricing the Term Structure with Linear Regressions.” Federal Reserve Bank of New York Staff Report No. 340 (Revised April).
Cox, Jeff. 2020. “Powell Says Stock Prices Are Not Necessarily High Considering the Low Level of Interest Rates.” CNBC.com (December 16).
Humpage, Owen. 2016. “The Fed’s Yield-Curve-Control Policy.” Federal Reserve Bank of Cleveland (November 29).
Shiller, Robert, Laurence Black, and Farouk Jivraj. 2020. “Making Sense of Sky High Stock Prices.” Project-Syndicate.com (November 30).
