
The Biggest Failure in Investment Management: How Smart Beta Can Make It Better or Worse
The negative gap between investor returns and fund returns is the biggest failure in investment management. Alpha is only a sideshow.
If we extrapolate the investor returns gap to smart beta strategies, poor client timing will completely negate the potential for positive excess returns.
The client service model for smart beta strategies needs to be radically different from other types of strategies to produce better investor outcomes.
What is the mission of investment management? Our interpretation is simple: to maximize the long-term value of the assets we are retained to manage. How do we measure our effectiveness? More than 50 years ago, the Bank Administration Institute (BAI), striving to help pension clients appropriately compare their results and the results of their investment managers, conducted a study that concluded: “The time-weighted rate of return measures the results of investment decisions made by a fund manager. It is not affected by decisions about the timing and amounts of cash flows—decisions which the fund manager typically does not make” (Bain, 1996, p. 5). Twenty years later, a predecessor organization to CFA Institute developed standards for the calculation and presentation of investment performance results, known today as the Global Investment Performance Standards (GIPS®), which measure the time-weighted return of a manager or strategy.
Set on this necessary and valuable foundation, the main act in the investment industry has traditionally been the pursuit of alpha. Research and investment management professionals engaged in active management have sought strategies to generate excess returns, and in the case of passive managers to design the most efficient strategy to capture a given market exposure. In both cases, minimizing transaction costs wherever possible helps clients’ results more closely match the “paper portfolio.” We know how well a manager is doing by measuring the time-weighted return of a strategy against a suitable benchmark. The practice of performance measurement and the databases it’s built on have become a sizeable industry on their own. But the overwhelming focus on time-weighted alpha, which receives center-stage attention, is only a sideshow. As we’ll explain, the client performance experience can deviate, sometimes wildly to the downside, based on investors’ timing of cash flows into and out of their selected investment strategies, which leads to a return gap.
The investing and divesting decisions that drive this gap, as the BAI report noted, are not typically made by the fund manager, but by the investor. What does this mean in smart beta, which has so many backtested returns? As purveyors of smart beta indices, we are interested in helping produce better outcomes for smart beta investors and wholeheartedly believe a robust client-service effort can assist in closing this return gap. We’re convinced a client-service conversation that builds investor confidence in the selected style and helps the investor understand the ups and downs of a long investing journey will result in substantial progress toward closing the gap. To successfully implement this smart-beta client service approach requires, however, an altogether different mindset than the market has adopted until now. But we are confident its time has come.
The BIG Failure
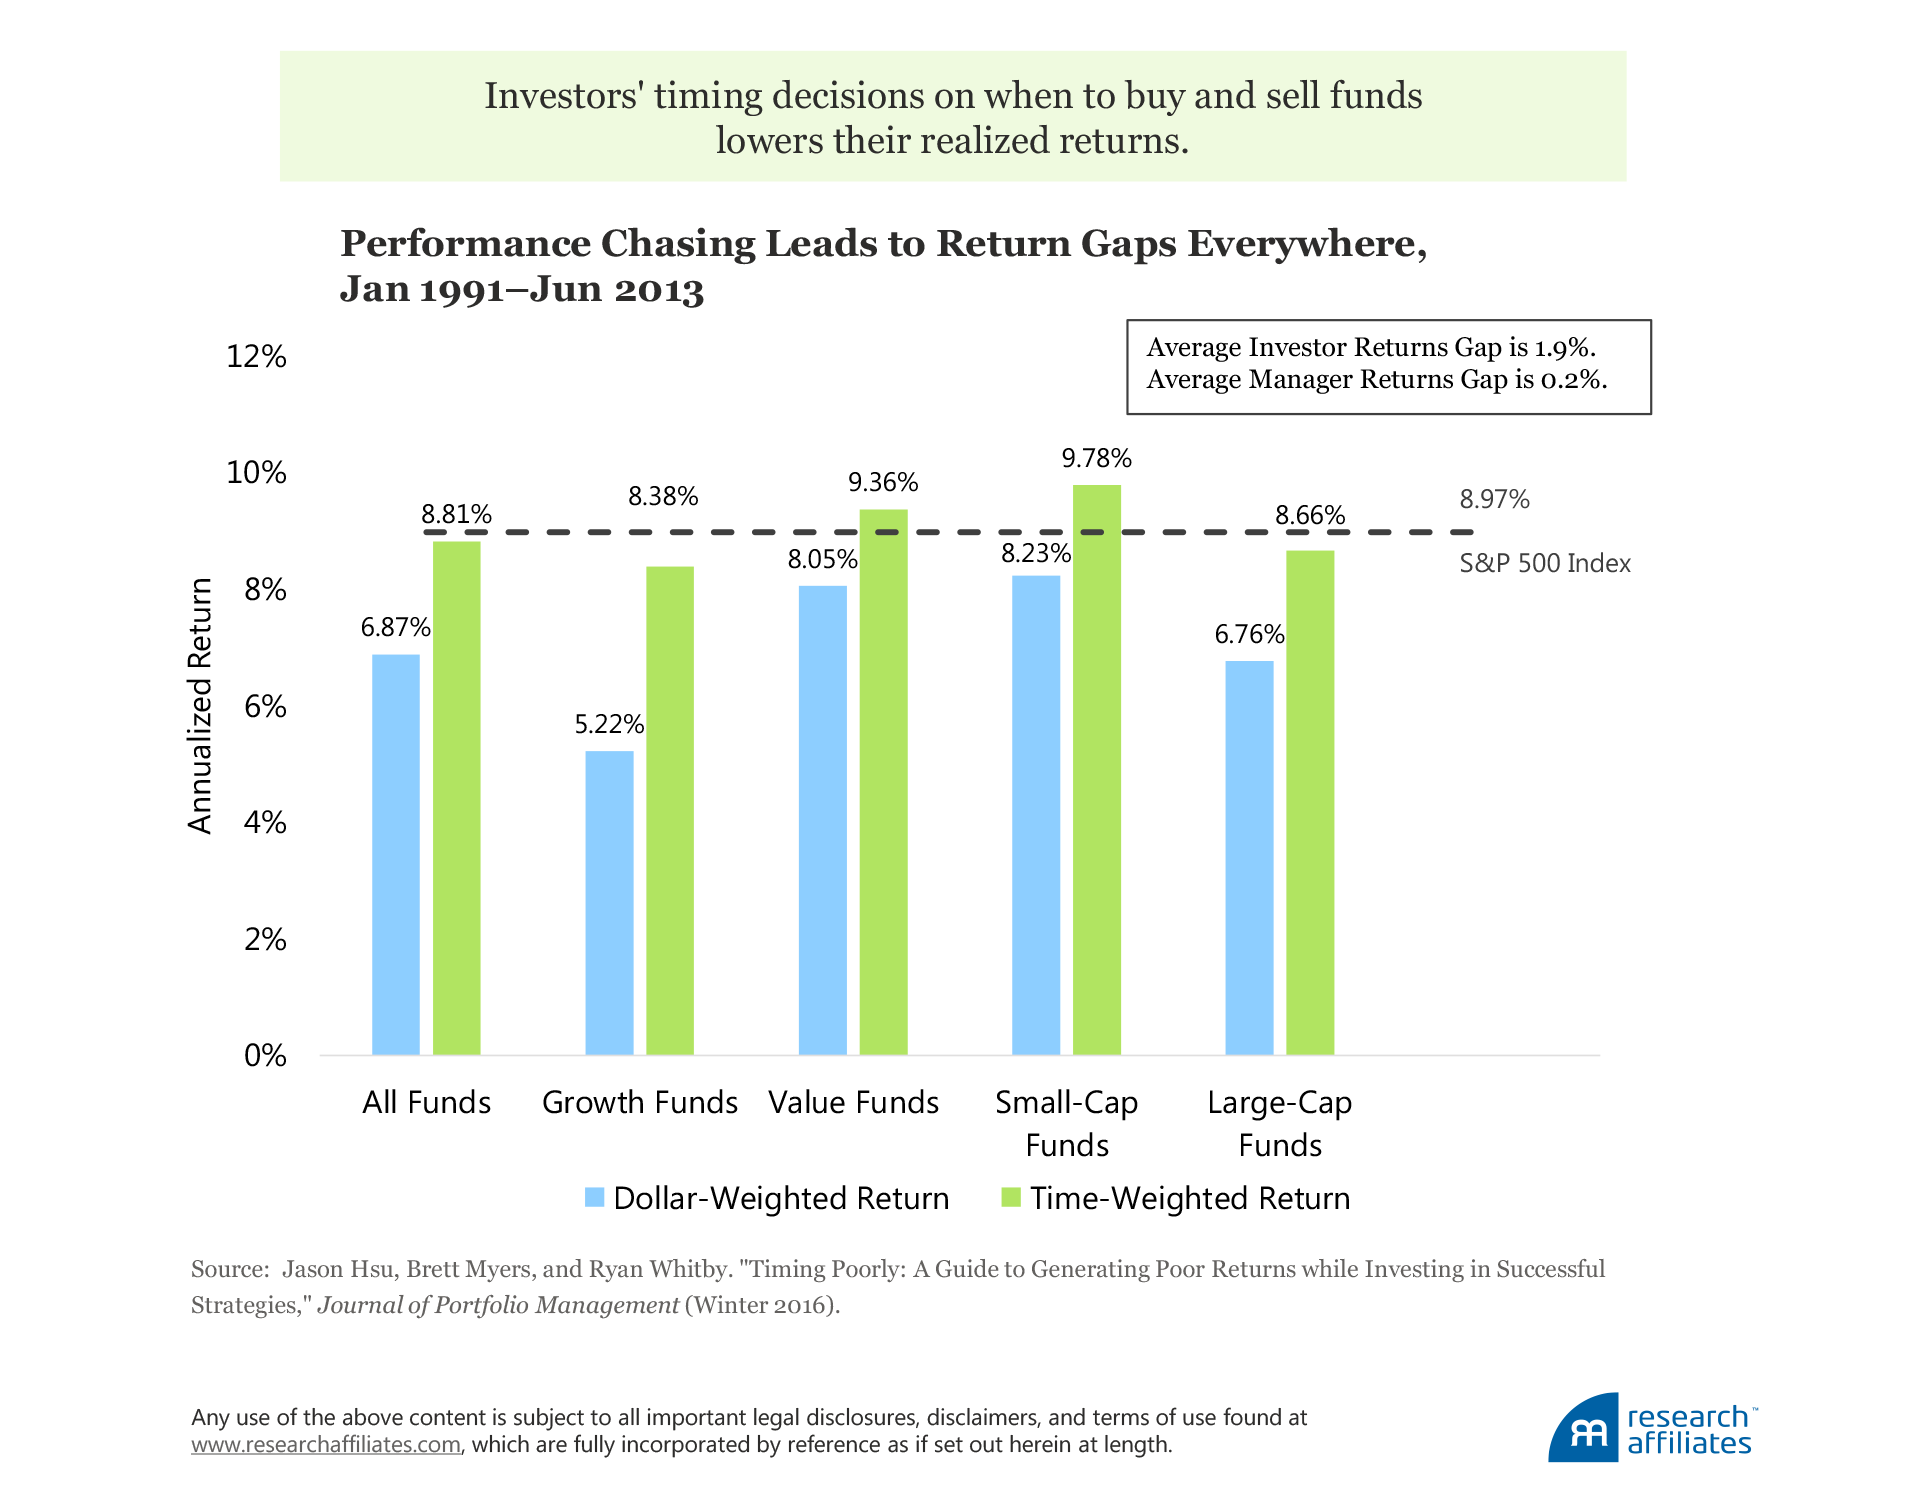
The oft-cited negative alpha of active versus passive equity management, what we’ll call the manager returns gap, obscures a far larger performance issue—the investor returns gap. This latter measure of investor underperformance, identified by Morningstar’s Kinnel (2005) and by Jason Zweig (2002),1 dwarfs the manager gap and was the focus of Hsu, Myers, and Whitby’s (2016) research of US equity mutual fund returns from January 1991 through June 2013. They found that the S&P 500 Index produced an annualized return of 8.97% versus an annualized return of 8.66% for large-cap funds, the most applicable fund classification to the S&P 500,2generating an average manager returns gap of 0.31% a year. Their finding is unsurprising and consistent with several longer-term studies on active versus passive returns (Soe and Poirier, 2018, and Bogle, 2005). The underperformance is also consistent with intuition, because in aggregate the active managers and index should hold the same portfolio, but the higher costs of active management (transaction costs and fees) should lower the investor’s return by the amount of the expenses.3
Some equity fund classifications studied by Hsu, Myers, and Whitby did produce excess returns on a buy-and-hold basis—value funds, for example. The buy-and-hold return for value funds from January 1991 through June 2013 was 9.36%, outperforming the S&P 500 by 0.39% a year. But unfortunately investors did not realize that return. The investor experience, as measured by the dollar-weighted return, was 8.05%, creating an investor returns gap of 1.31%. A winning strategy became a loser in terms of client experience. What skilled active management giveth, poor client timing taketh away.
On the flip side, losses widened substantially after accounting for client flows into and out of the funds for fund categories that underperformed the S&P 500. Investors’ timing decisions increased the aforementioned (and relatively modest) shortfall of 31 basis points (bps) for the large-cap fund category versus the S&P 500 to a staggering 221 bps—a year!—of underperformance. The alpha our industry obsesses over really is a sideshow to the large losses caused by poor client timing. If dollar-weighted alpha is negative, then even successful strategies aren’t accomplishing the mission of investment management—to maximize the long-term value of the assets professionals are hired to manage. In other words, investment professionals are failing. Clients obviously deserve better.
Interestingly enough, the negative investor returns gap isn’t limited to mutual funds whose investors are largely retail and potentially less financially sophisticated. We see the same patterns when we examine institutional funds, whose investors usually have substantial net worth and are typically assisted by investment professionals. Cornell, Hsu, and Nanigian (2017), studying 25 years of institutional mutual fund flows following a standard manager selection method of redeploying assets from underperforming to outperforming managers over a three-year evaluation period, found that funds attracting flows generally underperformed funds bleeding flows by 2.3% a year. Goyal and Wahal (2008), after analyzing 3,400 pension plan sponsors and their hiring and firing decisions, found that terminated managers outperformed newly hired managers over the subsequent three years by a cumulative 1.42%. Even though the pension plans were often advised by large and well-resourced global investment consultants, their firing and hiring decisions were nevertheless dominated by recent two- to three-year performance. Returns chasing into recently successful managers appears to be a primary cause of poor investment timing decisions and the resulting investor returns gap for retail and institutional investors alike.
Can Poor Client Timing Make Smart Beta Dumb? Yes!
Smart beta is exploding in popularity, no doubt driven by the belief these strategies can be a more effective way to gain exposure to key equity return drivers. As Towers Watson (2013), who coined the term smart beta, stated: “Smart beta is simply about trying to identify good investment ideas with better structure…. [S]mart beta strategies should be simple, low cost, transparent and systematic.” But, as we’ve seen, even successful investment strategies can produce suboptimal client outcomes via poor investor timing.
Indeed, smart beta strategies may produce an even larger investor returns gap, if investors are not careful. Smart beta strategies have moderate to high tracking errors to the broad market. Intuitively, this makes sense. With factor strategies, in particular, the concentrated exposure to the desired factor can result in excluding 50–80% of the market, which naturally leads to often sizeable tracking error. Indeed, the median historical tracking error of the 29 smart beta strategies included in the Research Affiliates™ Smart Beta Interactive (SBI) webtool is 5.5% as of June 30, 2018.
Why does this matter? Cornell, Hsu, and Nanigian (2017) found that the return gap grows as tracking error rises. The top decile of tracking error showed a return gap of 3.6%, well above the return gaps of more-diversified categories. What kind of tracking error landed a manager in the top decile? The average was 4.0%, substantially below the historical tracking errors of popular smart beta strategies.
This result implies that investors are more likely to fire and hire managers who run a high tracking error relative to the benchmark. We intuitively understand this because managers with high tracking error are more prone to have both extreme outperformance and extreme underperformance, which tends to get noticed and acted on by investors. Because the manager-switching decision is, on average, ill-timed and counterproductive, high-tracking-error managers are associated with the largest investor returns gaps over time.
In a related comparison, Bogle (2005) examined the investor (dollar-weighted) and manager (time-weighted) returns of the six largest diversified and sector funds over the period 1998–2003. Sector funds, like concentrated factor strategies, exclude a large part (80–90%) of the broad stock universe. We calculated the annualized tracking errors of the funds in Bogle’s analysis and found they ranged from 0.1% to 15.2% for the diversified funds to between 13.4% and 40.2% for the sector funds. Not surprisingly, Bogle observed the average annual return gap for the six largest diversified equity mutual funds (−0.9%) was markedly lower than the return gap for the six largest specialty/sector funds (−11.4%). Indeed, not a single diversified fund had a larger return gap than the sector funds.
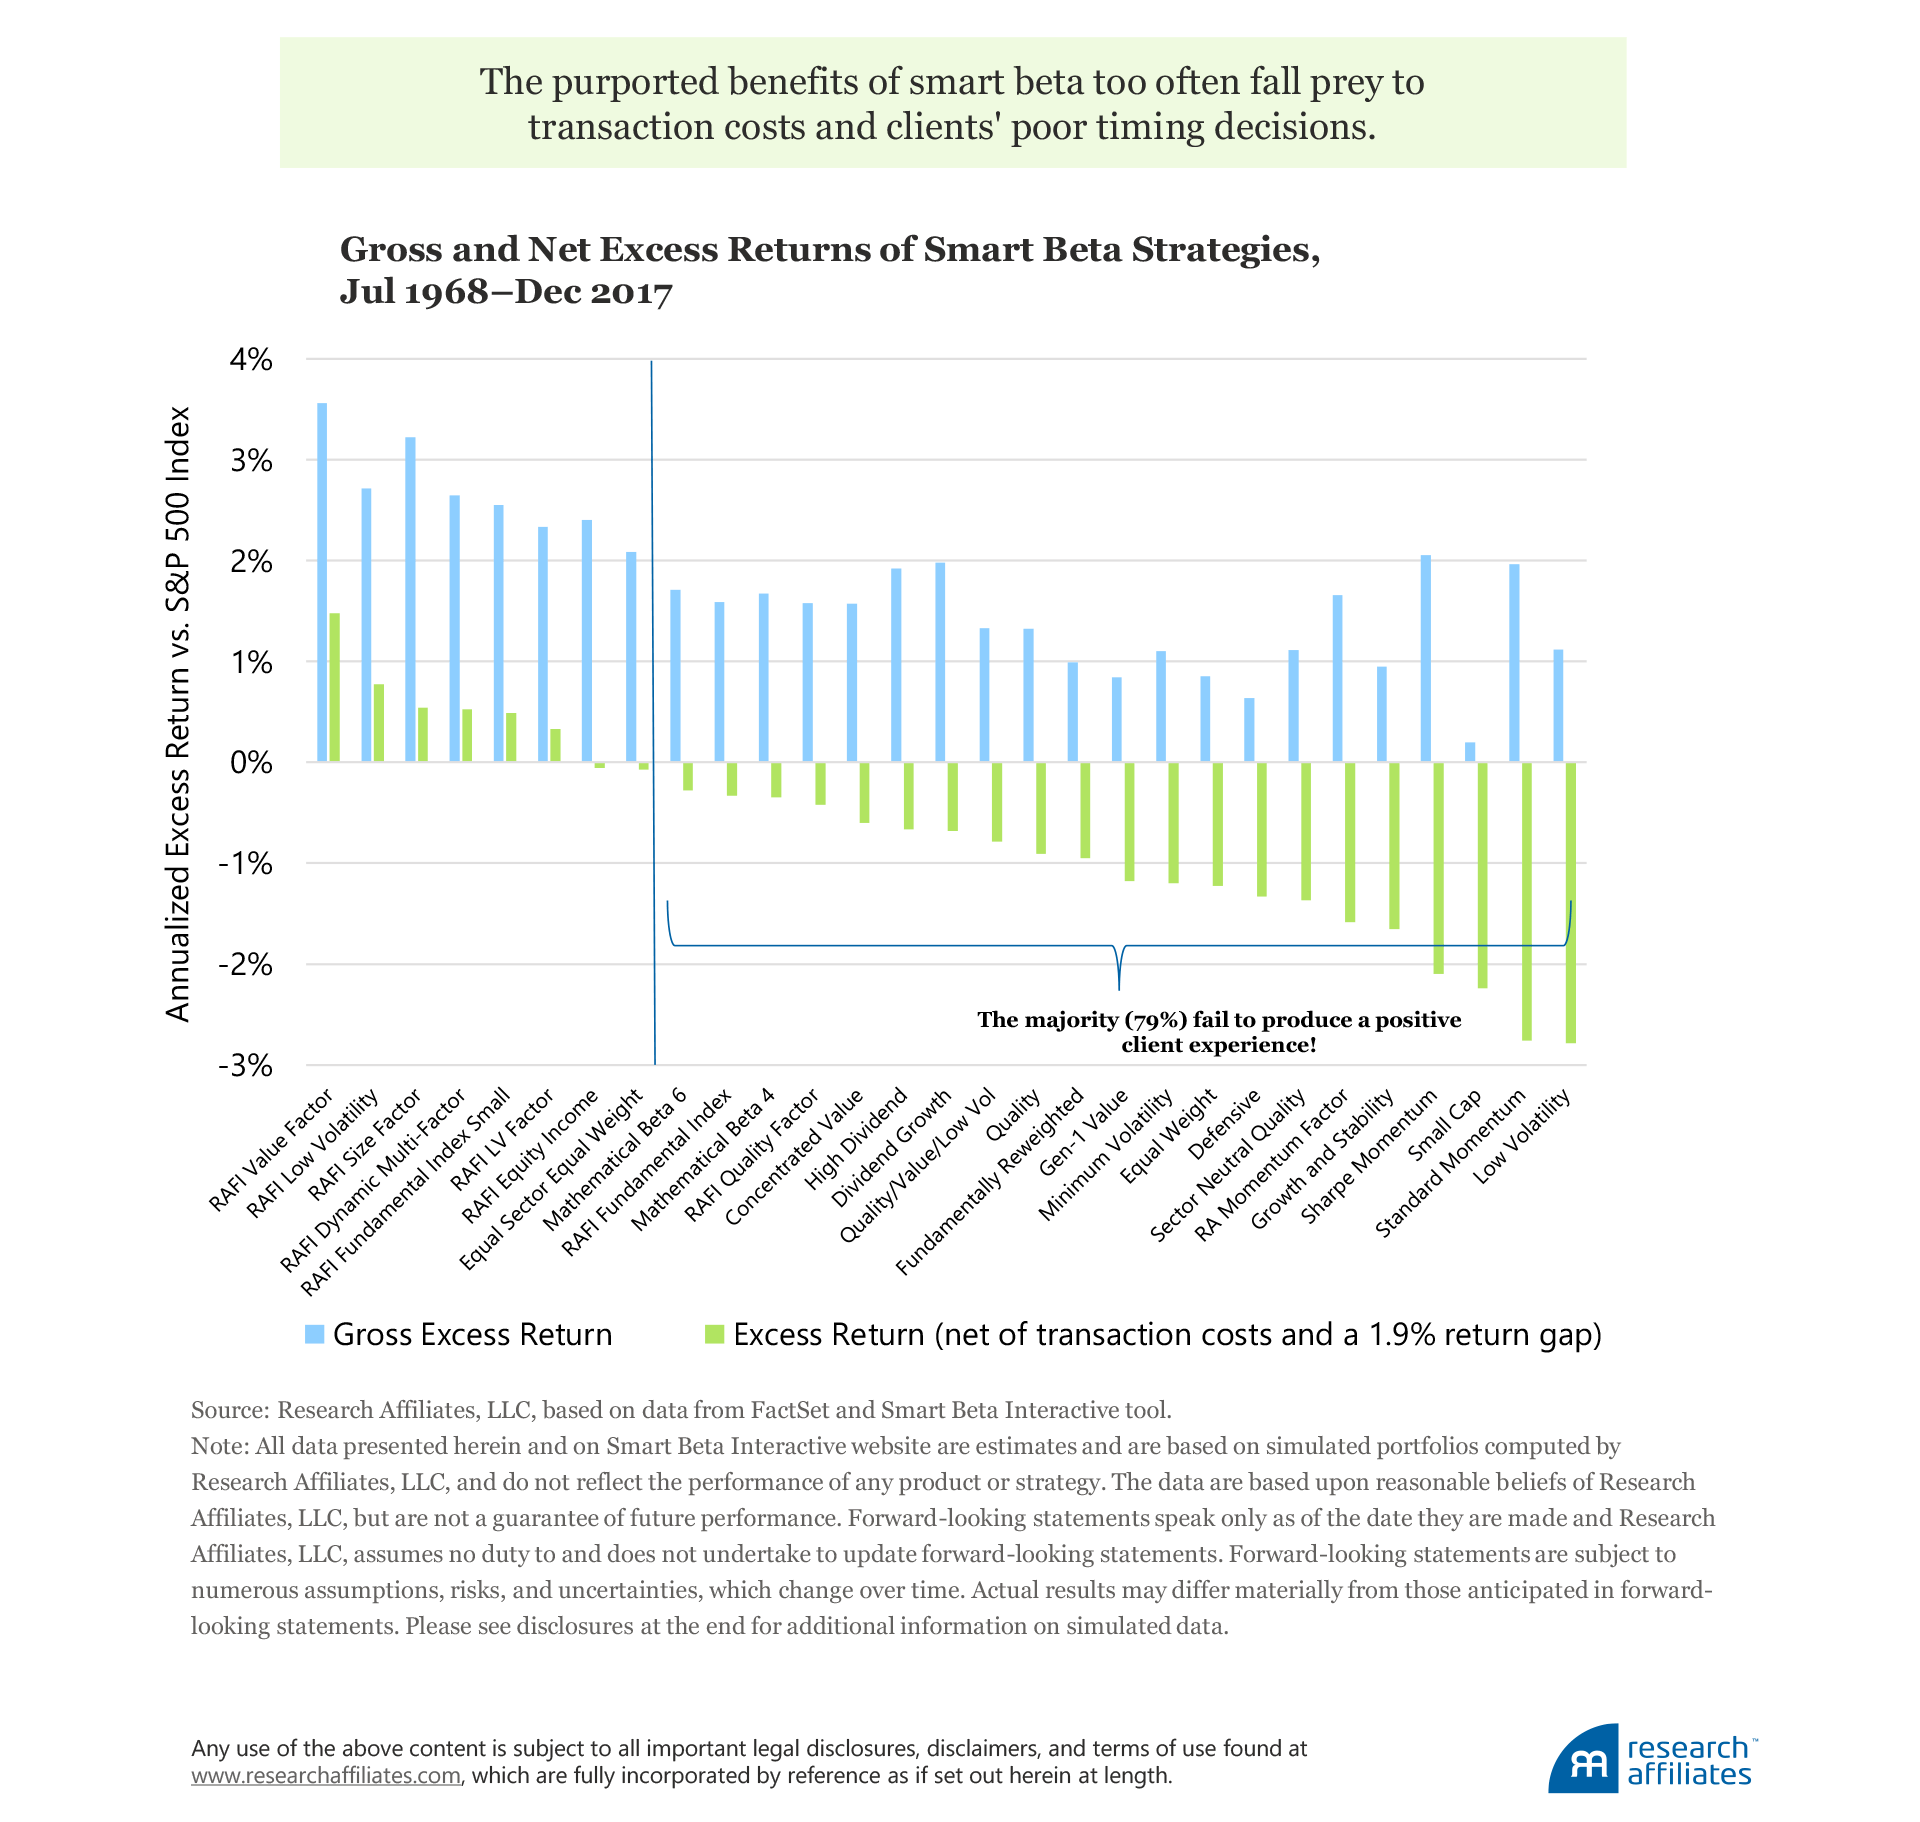
The Research Affiliates SBI replicates 29 popular smart beta strategies in the US market since 1968 to give investors a better idea of the strategies’ longer-term return potential. Every strategy produces a positive gross return, before transaction costs, but they are, of course, mostly backtests. The median excess return of these strategies is approximately 1.5% a year. Netting out expected transaction costs lowers the median excess return a bit to just over 1%.4
If smart beta strategies suffer a return gap similar to the 1.9% return gap found by Hsu, Myers, and Whitby (2016), how many of these 29 smart beta strategies would have historically produced a positive excess return for the investor? The 100% win rate of the smart beta strategies shrinks to about 21% after accounting for transaction costs and the 1.9% return gap. Thus, only 1 of the 29 produced an annualized excess return of 1% or more. Said differently, if the observed return gap applies to smart beta excess returns, most smart beta strategies will fail to produce a positive client experience. The majority of performance-chasing investors would have been better off in buy-and-hold cap-weighted indices.
None of these 29 so-called smart beta strategies would have been launched without positive backtests, or simulations,spanning nearly the last 50 years. So selection bias—rejecting strategies that appear to produce disappointing results—has a powerful influence in strategy selection. In live experience, almost none of these strategies has matched its backtest results. Net of trading costs and the hypothetical 1.9% slippage from client performance chasing, results should be much worse than even what we show here. Is this a rock-solid argument for just going passive? Hardly. It’s a rock-solid argument for not chasing past performance. Investors should pick a strategy they believe will add value—and has added value using live assets—and stick with it. If anything, investors should rebalance, topping up exposure whenever market conditions have been unfavorable to the strategy.
Snatching Dollar-Weighted Alpha from the Jaws of Defeat
We are quite hopeful and optimistic that smart beta strategies will make a meaningful difference in closing the return gap for investors and allowing them to capture the full, anticipated benefits of smart beta. Asset managers and their clients must, however, be deliberate and careful in their approach.
First, let’s begin with the critical advantage smart beta has in shrinking the return gap. As the Towers Watson definition states, smart beta strategies are systematic and transparent. In other words, the beauty of smart beta is that it’s all style investing. Arnott, Kalesnik, and Wu (2017, p. 10) describe the style pendulum’s impacts on the return cycle:
Most funds have persistent factor exposures, and those exposures explain the lion’s share of the fund’s return in excess of the market. When a factor performs poorly it drags down the fund’s return, which contributes to cheap valuations that lead to future superior performance. It also works the other way around: stellar performance of a factor will boost the fund’s return, pushing its valuation higher until they are very expensive and setting the fund up for future disappointing performance.
The dynamic of firing poorly performing managers only to see their replacements subsequently deliver substandard results is particularly hard for clients to understand when vacillating style/factor returns are interpreted as skill. In outperforming times, managers may stress robust philosophies, processes, and people. But when performance turns south, they stress how “out of favor” their style has become. No wonder clients terminate underperformers after a poor three-year run. Client-facing professionals have equated outperformance to positive skill. The natural conclusion, therefore, is that underperformance must mean skill has disappeared.
With systematic strategies delivered via transparent rules, smart beta has no “outsmarting” alpha energy. Consequently, the alpha so often referred to by active managers should not be in the discussion.5 The-heads-I-win (with skill), tails-my-style-is-out-of-favor dynamic disappears. And with it so should client frustration.
Changing the Conversation to Better Outcomes
Investors can improve their investment outcomes by taking two straightforward, but sometimes, challenging steps: 1) truly believe in the ability of the style to deliver return in the long run before investing in the style, and 2) understand that the journey to the end of their investment horizon may be bumpy and may take some unexpected turns along the way, but staying the course will get them—at long last—where they want to be financially.
Step 1. Believing in the Style
If smart beta is solely about investing in a style, the client service conversation, suddenly free from the need to convince a client of outsmarting alpha, shifts to a more constructive starting place. The easiest way to eliminate performance chasing is not to engage in a conversation about performance!!
Instead, focus on the style.
To achieve a better dollar-weighted outcome, we should begin, as our colleague Cam Harvey states, by establishing the economic plausibility of the strategy. In other words, we must encourage philosophical buy-in of the factor or style. If the strategy is expected to win with a systematic and transparent approach, someone must be losing. Who’s on the other side of the trade? What’s their motivation, and why do we expect it to continue? After all, smart beta rules are transparent and easily accessible.
The investment beliefs that Research Affiliates espouses make two assertions consistent with investors who are willing to be long-term losers. First, investor preferences are broader than risk and return. The safety of the herd, a preference for investing in big winners (i.e., positive skew), the psychic benefit of realizing gains, the inclination toward comfortable investing, and other motivations all affect investor choices. Second, lack of conviction and/or governance constraints restrict investors’ ability to exploit long-term value. In other words, some long-term winning strategies simply cannot be implemented due to imposed short-termism.
Establishing and re-establishing the belief in style is critical for client success in smart beta. As we’ll see shortly, smart beta is no silver bullet. It can and will underperform, often for long stretches. Indeed, we find when examining the longer-term histories of the 29 smart beta strategies tracked in our SBI webtool that 14% of the time they are underperforming over rolling 10-year stretches. And this is the case for the strategies with promising backtests!
With a sound and ideally straightforward theory, we can then look at longer-term data to substantiate the robustness of the strategy across regions and factor definitions. We can compare the results to the academic literature for further validation. And we shouldn’t just seek one or two studies, but many. The more independent confirmations from leading sources, the more likely we have a style worth believing in. As Beck et al. (2016, p. 59) stated:
Factors should be grounded in a long and deep academic literature. Taking advantage of academic research that is peer reviewed and generally free from undisclosed conflicts of interest is one of the best strategies for investors. A long literature debating the existence and persistence of a factor strategy, including rigorous attempts to debunk it, is critical to validating a factor. A factor strategy that does not attract follow-on research usually means that the factor has not survived academic scrutiny.
The entirety of the exercise from theory to data to academic support establishes a belief, a Northstar so to speak, that the strategy will deliver.
After we gain conviction for the theoretical underpinning of why a strategy is expected to produce robust results, we need to think practically: Can these results be captured in the real world of trading costs and other frictions? As Yogi Berra’s quip aptly reminds us: “In theory, there is no difference between theory and practice. In practice, there is.” Different and often seemingly small elements of product design, such as portfolio concentration, turnover, liquidity, size, and number of holdings, can lead to substantial differences in expected transaction costs. We therefore must assess how transaction costs will impact the theoretical expected return premium.
Step 2. Understanding the Journey
Most of the return conversation with prospective smart beta clients centers on expected return—not dissimilar to the traditional servicing exhibit that shows trailing 1-, 3-, 5-, and (if available) 10-year annualized manager (time-weighted) returns versus a benchmark. But the expected return is just the midpoint in a range. With shorter periods the range can be massive as the style or risk factor moves from being in favor to out of favor. Underperformance will happen. Investors need to be prepared ahead of time.
A better-outcome client review will spend just as much time on the range of returns as the expected. Here’s where smart beta has another critical advantage. Due to the systematic nature of these strategies, through backtesting across multiple factor definitions and geographies, we can gain substantial insight into not only the expected long-term excess return, but the range of outcomes along the way. Of course, we’ll never be able to estimate the full range of outcomes, but we can at least start with the “known unknowns.”
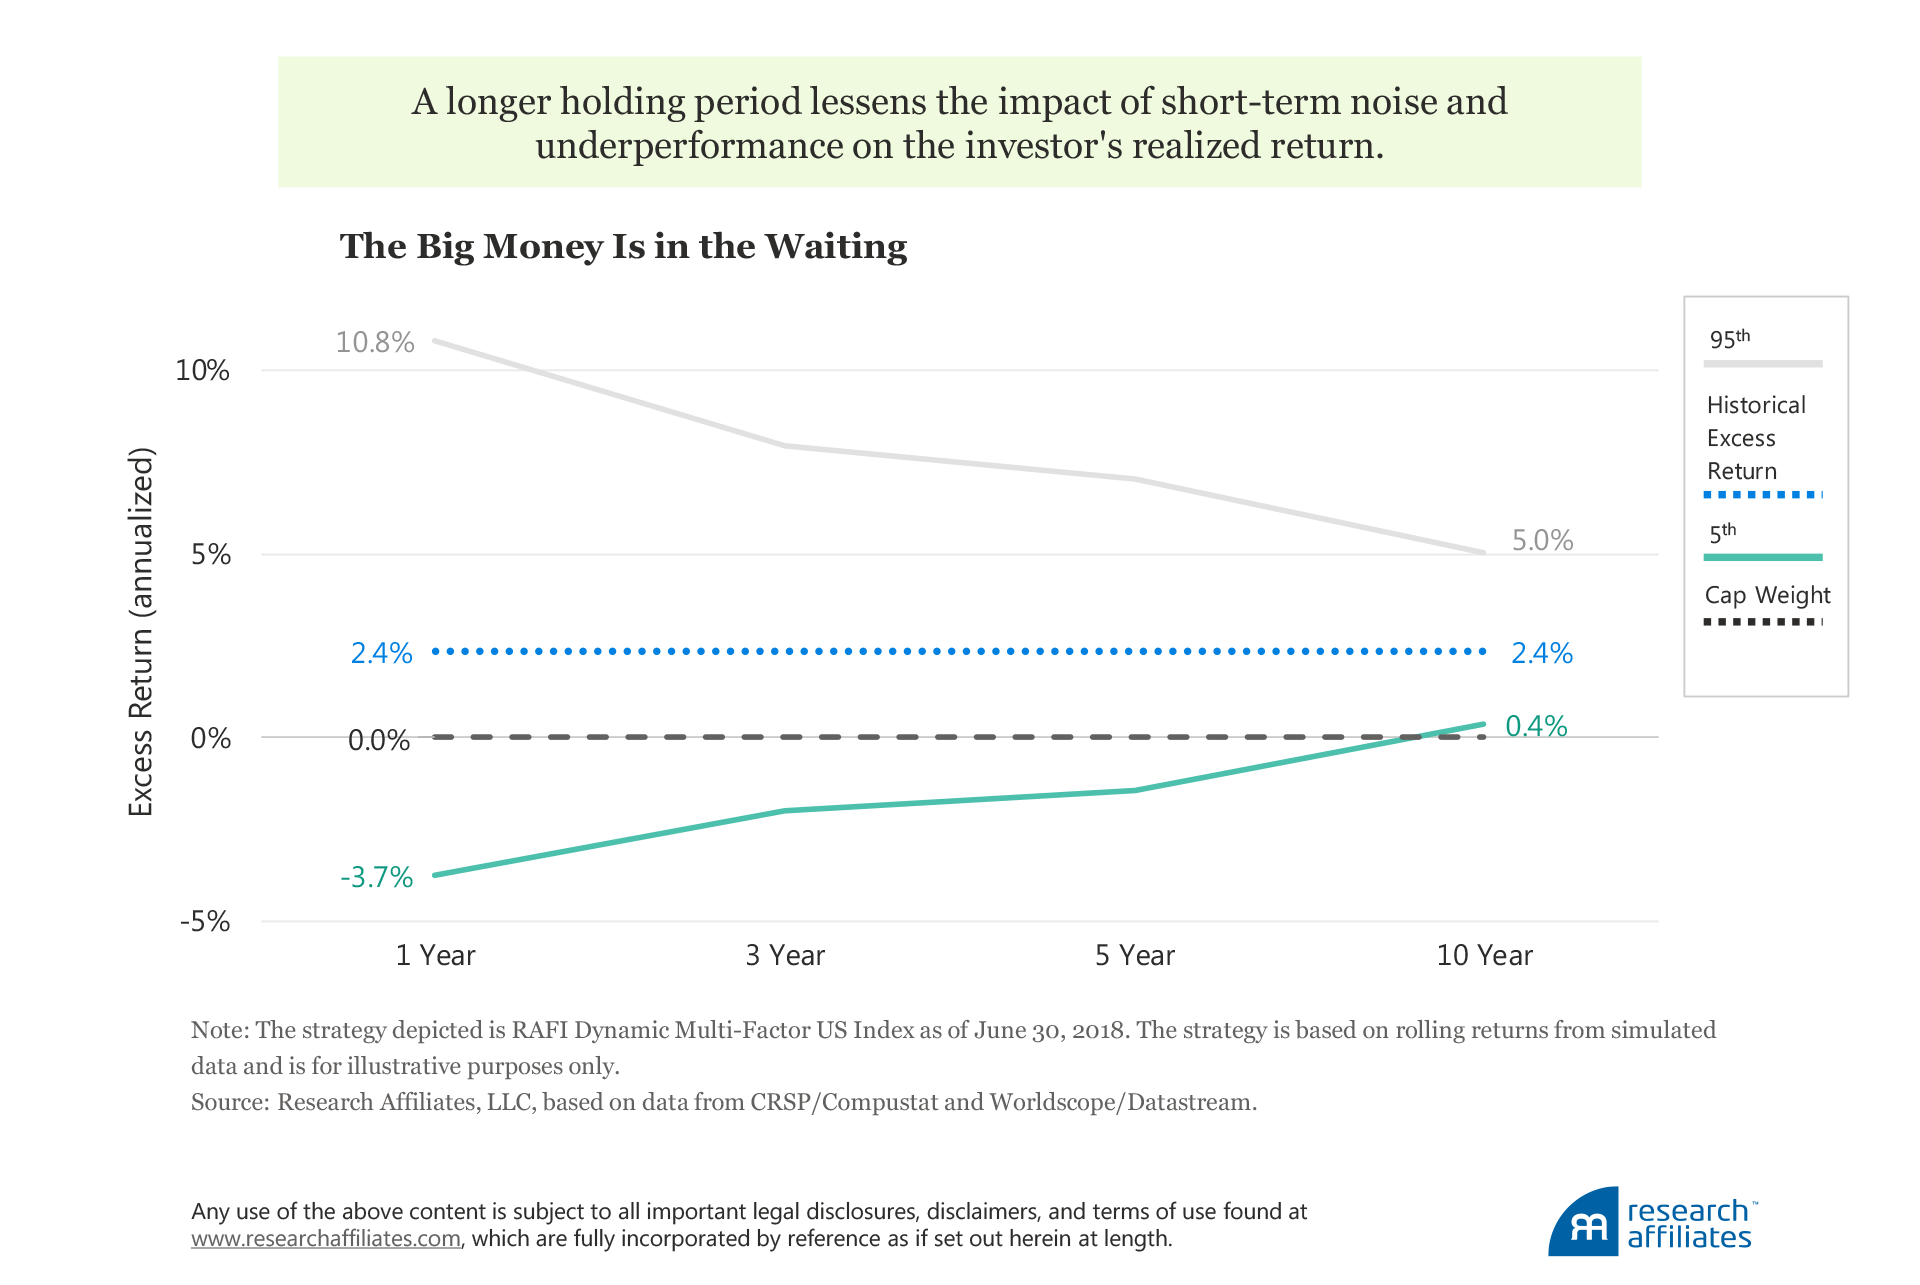
A focus on how the return range narrows with longer horizons can encourage two mindsets, both equally important for better dollar-weighted returns. First, asset managers can communicate the rather wide range of results, which will inevitably have periods (sometimes sustained) of well-below benchmark performance. All performance over the short term will be noisy relative to the long-term expectations of the smart beta strategy. Second, asset managers can help clients appreciate that by extending their holding period, the impact of underperformance on their overall return will be lessened, thereby establishing a mindset of long-termism rather than short-termism. As Charlie Munger said, “The big money is not in the buying and selling … but in the waiting.”
Thus, periods of exceptionally strong performance can be interpreted as an above-normal windfall, ripe for a rebalancing opportunity, and vice versa. Admittedly, easier said than done. A client viewing wonderful trailing one-, three- and five-year returns will have a hard time pulling the sell trigger. Such look-back performance creates an illusion of consistently earned excess return that’s all too easy to extrapolate into the future. The path of least resistance for all of us in the asset manager food chain is to favor recent winners and de-emphasize recent losers. Old habits, especially those that are hardwired, die hard. Mean reversion, however, makes that path of least resistance a losing strategy.
That’s why relative valuation can come in handy. By pairing recent returns relative to a range with current relative valuations, which show future returns are likely to be much lower, we can establish a solid footing for rebalancing away from future low returns. The same holds true for a strategy that has underperformed meaningfully and has chalked up a string of cringe-worthy trailing returns. If the underperformance has come from falling valuations, a forward-looking framing can and should be part of the client conversation about next steps. Ang and Kjaer (2011) suggest institutionalizing contrarian behavior via robust rebalancing procedures as one of four basic steps to help investors exploit their “long-horizon edge.” The systematic nature of smart beta allows the use of relative valuation calibrated over a very long horizon to assist in overcoming what Ang and Kjaer refer to as “procyclical missed opportunities” in order to shift invested capital to future winners.
These two comparisons—a range of returns and relative valuations—are embedded in the RAFI™ Roadmap performance reviews on RAFI.com. Let’s compare them to the performance tables (cumulative annualized returns and annual year-by-year returns) that are a hallmark of a typical client-service review. Rewind the clock to the end of 2008. At the depths of the global financial crisis, a representative low-volatility strategy basked in wonderful historical relative performance.6 At a standard client review, investors would have been shown trailing three- and five-year excessreturns of between 4.0% and 5.5% a year, respectively, over a cap-weighted benchmark. These excess returns were largely due to an outstanding, and utterly unsurprising—given the lower equity beta in a year when the S&P 500 lost 37%—one-year trailing excess return of 13.7%. These results created an illusion the strategy would continue to generate a consistent excess return going forward. A calendar-year review of the last five years only partially offsets this illusion. Yes, the strategy does have individual years of negative excess returns in 2005 and 2007, but they are relatively modest compared to the massive upside experienced in the 2008 bear market.
Based on these impressive relative performance results, industry-wide interest in low-volatility strategies soared.7 But the strategy failed to come remotely close to replicating the results that could (and probably were) inferred from standard performance metrics. Over the five years following 2008, US low-volatility investing trailed the market by an annualized return of 2.6%, with individual calendar-year shortfalls of −11%, −3%, and −8%, in 2009, 2010, and 2013, respectively. The calendar-year underperformance in 2009 and 2013, in particular, would have likely shocked clients engaged in a traditional review framework. Indeed, these returns are not the value-add expected from a winning strategy. If, instead, the 2008 client review of the low-volatility strategy had focused on an expected range of results over the next five years and on current relative valuations, the client’s predisposition toward extrapolating past results into the future would likely have been moderated.
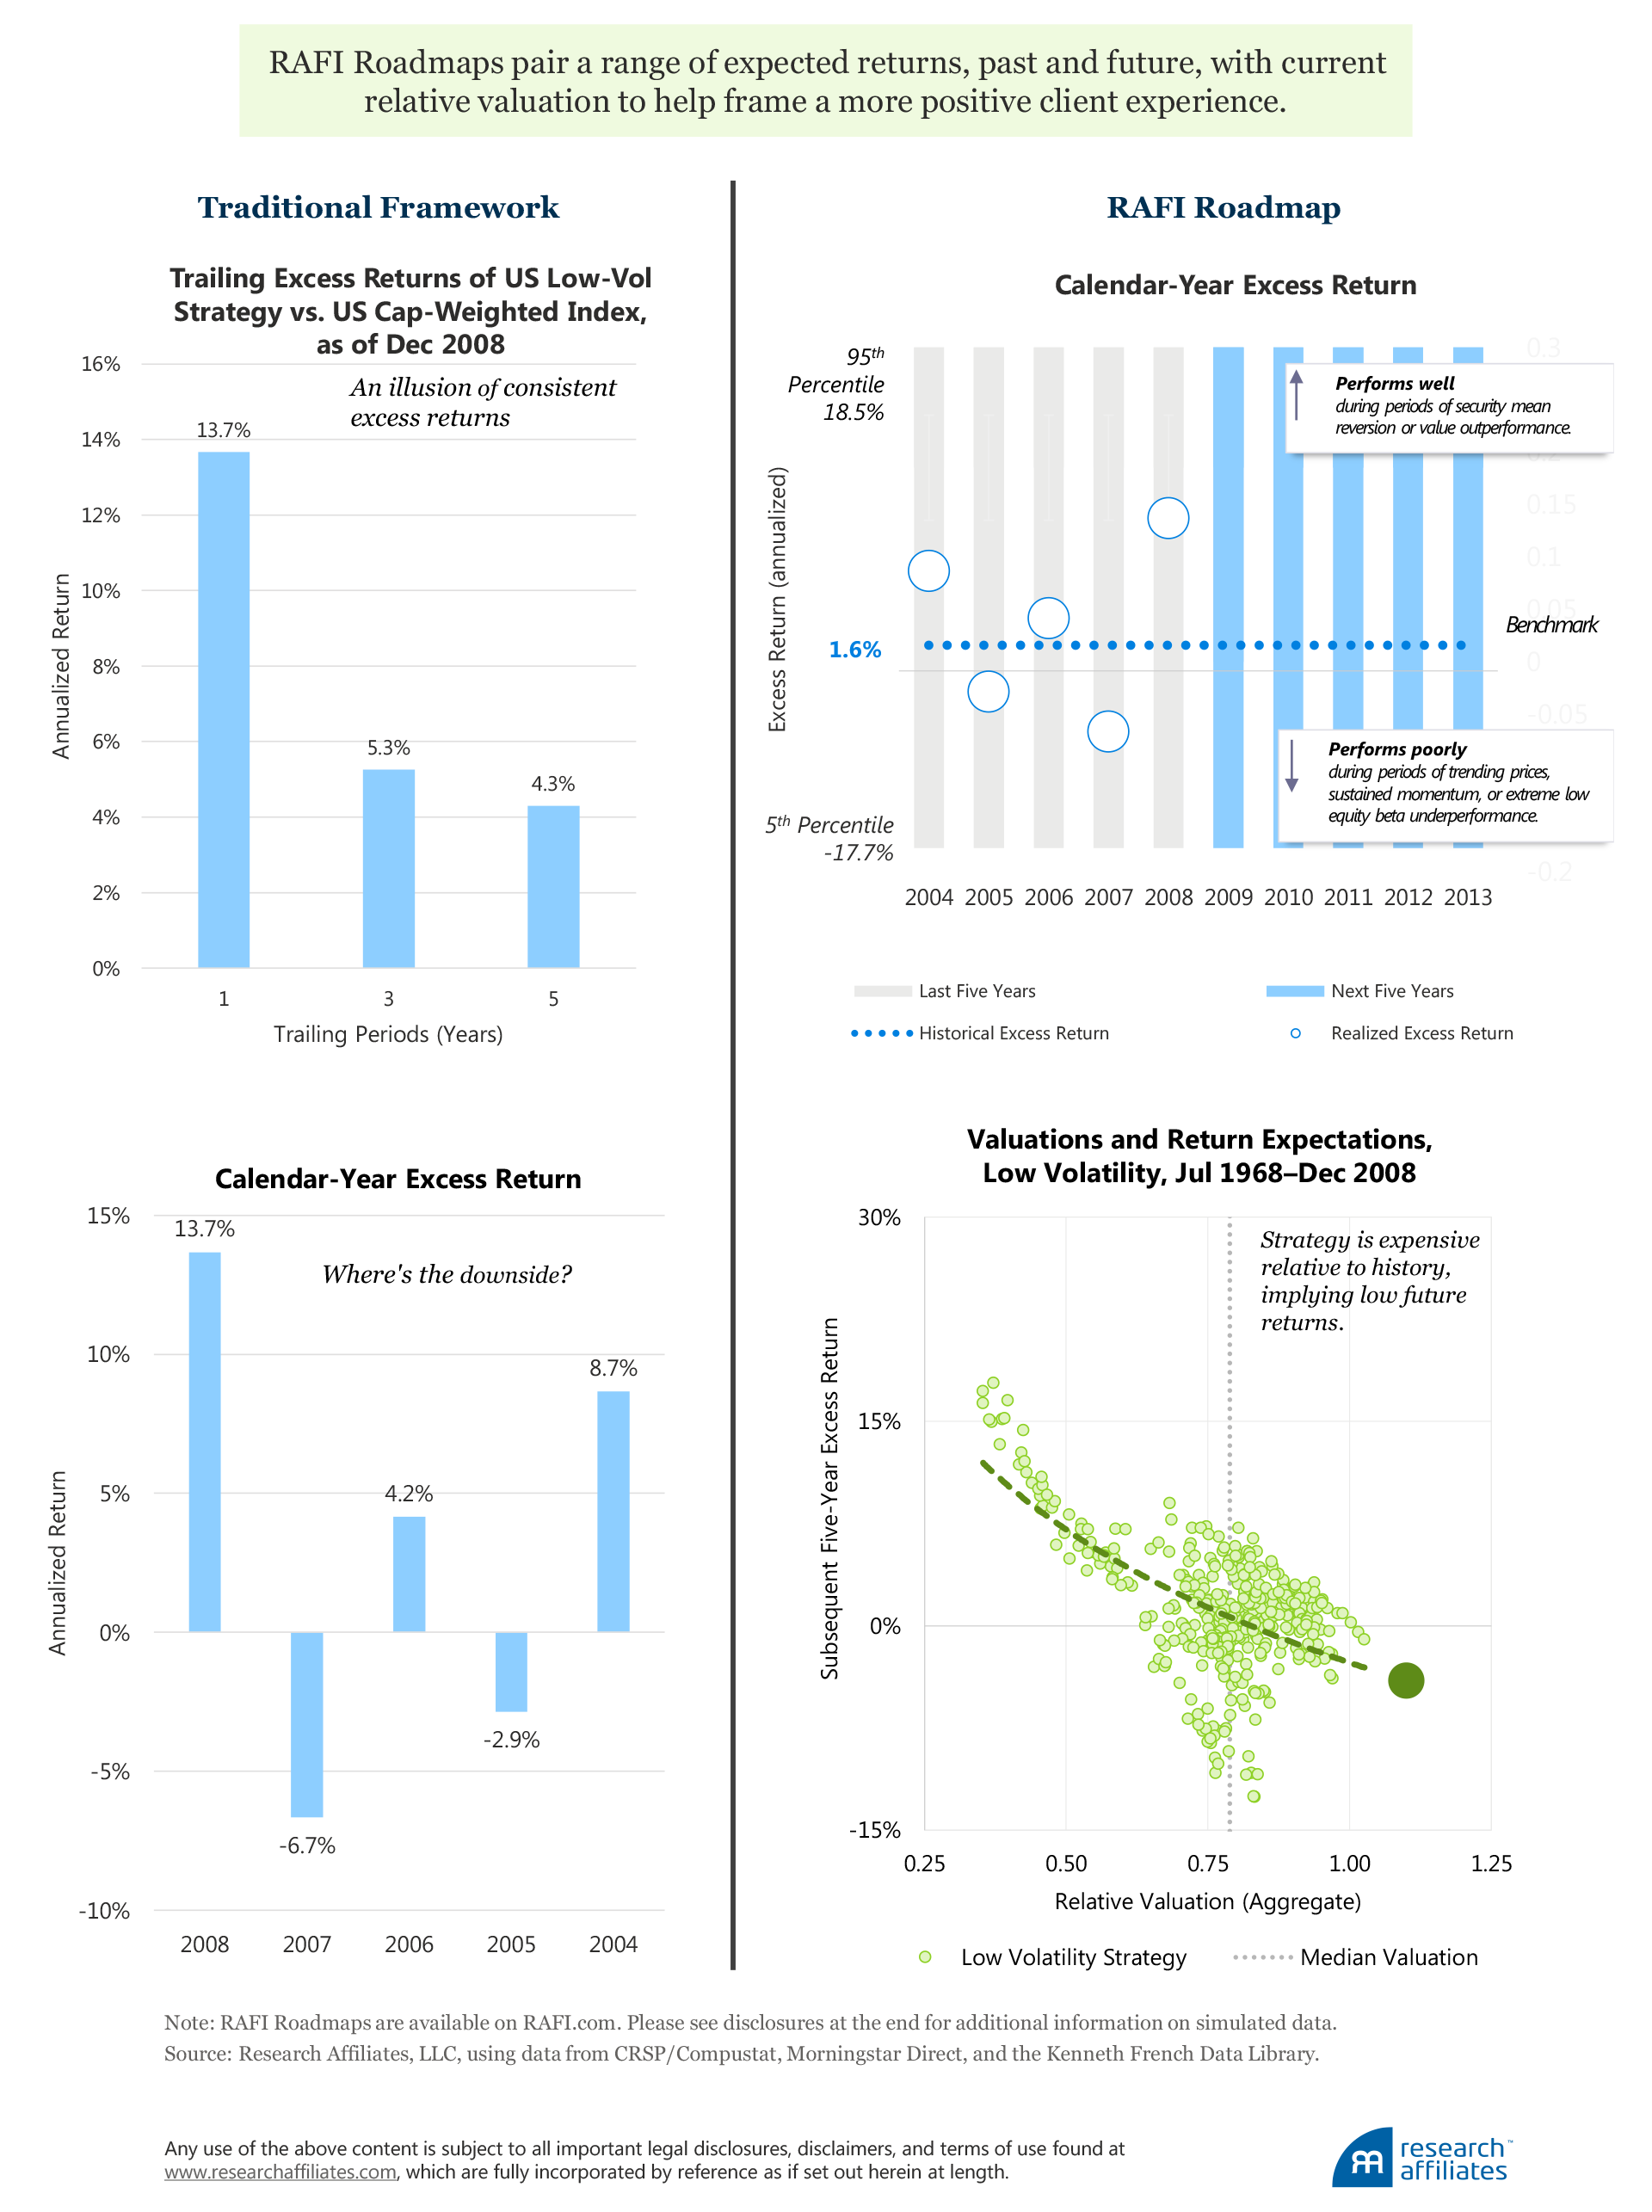
The RAFI Roadmap shows actual calendar-year excess returns over the last five years within the expected range, as indicated by the strategy’s historical tracking error. We believe this framing best prepares the investor for a wider range of results than a single-period return. And if the historical return is skewed to the upside, we should ask if it has led to a relative spike in valuations. Notably, on the latter point, a US low-volatility factor’s valuation relative to the market at the end of 2008 ranked in the most expensive percentile over a span of 40 years! Thus, a valuation framework would have prepared an investor, not for a central expectation of a 4% annualized excess return, but for a return closer to −2% a year, far closer to what actually occurred.
Conclusion
The gap between dollar-weighted and time-weighted returns—the investor returns gap—is a substantially larger figure, and therefore a greater cause of concern for investors, than underperformance versus a benchmark, which typically takes center stage in investment industry conversations and marketing. The investor returns gap means that even for asset managers skilled enough to produce alpha, chances are their clients won’t be able to fully capture it in their own portfolios because of the clients’ investment timing decisions. For this reason, we call the investor returns gap the biggest failure in the investment industry.
At the end of the day, for investment professionals to successfully deliver on their mission to clients, they must help them earn a positive dollar-weighted alpha over time. This means not only must investment professionals design strategies with robust sources of return and implement them in a cost-effective manner, they must also strive to help clients understand how to stay the course by understanding the styles in which they choose to invest. A new mindset is called on for both professionals in how they frame their advice and for clients as they learn to adjust their expectations and adopt longer horizons for assessing performance.
Sadly, many high-tracking-error smart beta strategies may actually exacerbate the investor returns gap, especially if noisy short-term performance is sold to trend-chasing clients. The investor returns gap of nearly 2% will wipe out the majority of smart beta strategies’ long-term returns. But we’re optimistic. We believe this cycle can be broken. Robust, academic-quality research and efficiently designed products are important, but no longer enough. To avoid the biggest failure in investment management, we must embrace a new conversation. We’re taking this step at RAFI.com via our RAFI Roadmaps, and look forward to sharing these with you.
Endnotes
1. Zweig (2018) explores some evidence that the return gap may be closing as a result of low volatility and a sustained equity bull market.
2. Hsu, Myers, and Whitby (2016) used the CRSP Survivorship-Bias-Free U.S. Mutual Fund Database as the source for monthly return and quarterly fund characteristics data. The authors created equity mutual fund portfolios weighted by total net assets. A fund is classified as being an equity fund if greater than 80% of its assets, on average, are allocated to equities. If a fund does not disclose its allocation to equities, it is classified based on its Wiesenberger, Strategic Insights, Lipper, or Morningstar classification. Funds with total net assets below $10 million are excluded from the data set. Size and style classifications are made using the fund’s prospectus-stated benchmark, obtained from Morningstar Direct and mapped to the CRSP data by fund CUSIP. The Active Share methodology of Cremers and Petajisto (2009) is used when a fund benchmark is not available.
3. Bogle (2003) explains why costs matter in investing.
4. A strategy’s design and implementation can lower transaction costs (Li and Shepherd, 2018). Arnott (2011) provides information on construction details, which can maximize the efficiency of a fundamentally weighted implementation.
5. We are not saying that smart beta providers don’t have skill, just that it’s a different kind of energy than the forecasting, outsmarting, “guru alpha” clients gravitate toward. The skill of smart beta providers manifests itself in craftsmanship (an extremely fitting term we first heard from Ronen Israel of AQR) in product design, which means the ability to efficiently gain exposure to a factor or style while minimizing transaction costs (Israel, Jiang, and Ross, 2017, and Li and Shepherd, 2018).
6. As described in the Low-Volatility Strategy section of the Research Affiliates Smart Beta Interactive (SBI) webtool, the low-volatility simulation selects the 100 lowest-volatility stocks from the top 500 by market cap. Volatility is defined as the standard deviation of daily returns over the prior year. Stocks are weighted by 1/volatility and rebalanced quarterly.
7. Based on our estimates using eVestment Alliance, Bloomberg, and fund profile factsheets, total assets under management of low-volatility strategies rose from approximately $4.6 billion at the end of 2008 to $91 billion, five years later at the end of 2013.
References
Ang, Andrew, and Knut Kjaer. 2011. “Investing for the Long Run.” In A Decade of Challenges: A Collection of Essays on Pensions and Investments, edited by Tomas Franzen. Stockholm: Andra AP-fonden, Second Swedish National Pension Fund: 94-111.
Arnott, Rob. 2011. “Little Things Make Big Things Happen.” Research Affiliates Fundamentals (February).
Arnott, Rob, Vitali Kalesnik, and Lillian Wu. 2017. “The Folly of Hiring Winners and Firing Losers.” Research Affiliates Publications (September).
Bain, William. 1996. Investment Performance Management. Cambridge, UK: Woodhead Publishing, Ltd.
Beck, Noah, Jason Hsu, Vitali Kalesnik, and Helga Kostka. 2016. “Will Your Factor Deliver? An Examination of Factor Robustness and Implementation Costs.” Financial Analysts Journal, vol. 72, no. 5 (September/October):55−82.
Bogle, John. 2003. “Whether Markets Are More Efficient or Less Efficient, Costs Matter.” CFA Magazine, vol. 14, no. 6 (November/December).
———. 2005. “The Relentless Rules of Humble Arithmetic.” Financial Analysts Journal, vol. 61, no. 6 (November/December):22–35.
Cornell, Bradford, Jason Hsu, and David Nanigian. 2017. “Does Past Performance Matter in Investment Manager Selection?” Journal of Portfolio Management, vol. 43, no. 4 (Summer):33–43.
Cremers, K. J. Martijn, and Antti Petajisto. 2009. “How Active Is Your Fund Manager? A New Measure That Predicts Performance.” Review of Financial Studies, vol. 22, no. 9 (September):3329–3365.
Goyal, Amit, and Sunil Wahal. 2008. “The Selection and Termination of Investment Management Firms by Plan Sponsors.” Journal of Finance, vol. 63, no. 4 (August):1805–1847.
Hsu, Jason, Brett Myers, and Ryan Whitby. 2016. “Timing Poorly: A Guide to Generating Poor Returns While Investing in Successful Strategies.” Journal of Portfolio Management, vol. 42, no. 2 (Winter):90–98.
Israel, Ronen, Sarah Jiang, and Adrienne Ross. 2017. “Craftsmanship Alpha: An Application to Style Investing.” Journal of Portfolio Management, vol. 44, no. 2 (December Multi-Asset Special Issue):23–39.
Kinnel, Russel. 2005. “Mind the Gap: How Good Funds Can Yield Bad Results.” Morningstar FundInvestor, vol. 13, no. 11 (July):1–3.
Li, Feifei, and Shane Shepherd. 2018. “Craftsmanship in Smart Beta.” Research Affiliates Publications (February).
Soe, Aye M., and Ryan Poirier. 2018. “SPIVA U.S. Year-End 2017 Scorecard.” S&P Dow Jones Indices research paper (March 15).
Towers Watson. 2013. “Understanding Smart Beta.” TowersWatson.com (August).
Zweig, Jason. 2002. “Is Your Brain Wired for Wealth?” Money (September 27).
———. 2018. “Congrats, Investors! You’re Behaving Less Badly Than Usual.” Wall Street Journal (June 29).
