
When a Storm Is in the Offing: Fundamental Growth in the U.S. Equity Market
Nearly one-third of the time, equity market momentum can be misleading in predicting future dividend growth.
When investors rely solely on historical price returns to inform their future investment opportunities, they are at risk of allowing random price fluctuations to drive perceptions, going to cash too late and staying in cash too long. Broadening decision-making inputs to include economic data can improve forecasting ability.
The last several years have been smooth sailing in the alignment of real stock price growth and real dividend growth, but investors would do well to check which way the economic wind is blowing; it may be time to chart a different course to avoid a storm in the offing.
So tremendous had the force of the sea been when it broke the ship, that it had beaten one great ingot of gold, deep into a strong and heavy piece of her solid iron-work: in which, also, several loose sovereigns that the ingot had swept in before it, had been found, as firmly embedded as though the iron had been liquid when they were forced there.1
—Charles Dickens from The Uncommercial Traveller, 1867
Today we enjoy all manner of weather prediction, from daily temperature forecasts and rain probabilities to warnings of severe storms replete with heavy winds and wave surges. Nonetheless, extreme storms that impact life and property are fairly infrequent, giving us the paradox of prediction: forecasts are mostly boringly mundane, but sometimes crucially important. The luxury of such forecasts is a relatively recent phenomenon.
Late in the afternoon of October 25, 1859, the largest storm of the nineteenth century ripped out of the Irish Sea and up the west coast of Wales, England, and Scotland. A total of 133 ships were sunk and 90 more damaged. Some 450 lives were lost on the Royal Charter, a steam clipper nearing the end of its journey from the goldfields of Australia. The Royal Charter Gale, as the storm came to be called, unleashed its fury just as the newly invented telegraph was enabling swift communications between distant places. As Peter Moore recounts in The Weather Experiment, the need to avert another such catastrophe impelled the development of modern weather forecasting, and the telegraph was the cutting-edge technology that made it possible.
The forecasting of equity fundamentals, such as earnings and dividends, suffers from the same paradox of prediction as the forecasting of weather. Long periods of sameness are punctuated with infrequent bouts of tumultuous change that can abruptly destroy livelihoods and toss accumulated wealth across the sands for others to claim as their own. During times of calm in the market and in the economy, the classic dividend discount model works, and stock prices provide significant information about fundamental dividend growth.2 Yet as we shall demonstrate, nearly one-third of the time, the steady-as-she-goes approach proves imprudent. Just as the information provided by the telegraph improved weather forecasting, macroeconomic data can be helpful in mitigating the risks of price momentum. In particular, we find that macroeconomic information can forecast when the market’s intelligence is not useful.
The Calm
As a means to create better storm prediction for the equity markets, we can begin by investigating the knowledge factored into market prices. In January 2016, Adam, Marcet, and Nicolini (henceforth, AMN) published a Journal of Finance article titled “Stock Market Volatility and Learning.” AMN show that the majority of stock market volatility is generated by the learning process around the future growth rate in fundamentals, such as dividends. Simply put, investors do not intrinsically know the long-term growth rate of equity earnings or dividends, but have to learn about it. Recent stock price movements prove to be a good way to model future stock price behavior. The elegant model proposed by AMN generates market-mimicking momentum and mean reversion in the stock price as a byproduct of the learning process.
Seeing recent price movements as a useful indicator of prospective dividend growth helps us think about the extent to which price changes might be fundamentally justified. Figure 1 shows that trailing real-price changes in the U.S. equity market are positively correlated (R2=0.41) with next year’s dividend growth.3 Most of the time, the market is knowledgeable and the recent price trends are the best indicators for tomorrow. But in many instances—about one-third of the time in the 1949–2015 period we study—we observe a disconnect; that is, the sign of equity market returns and subsequent dividend growth differs.
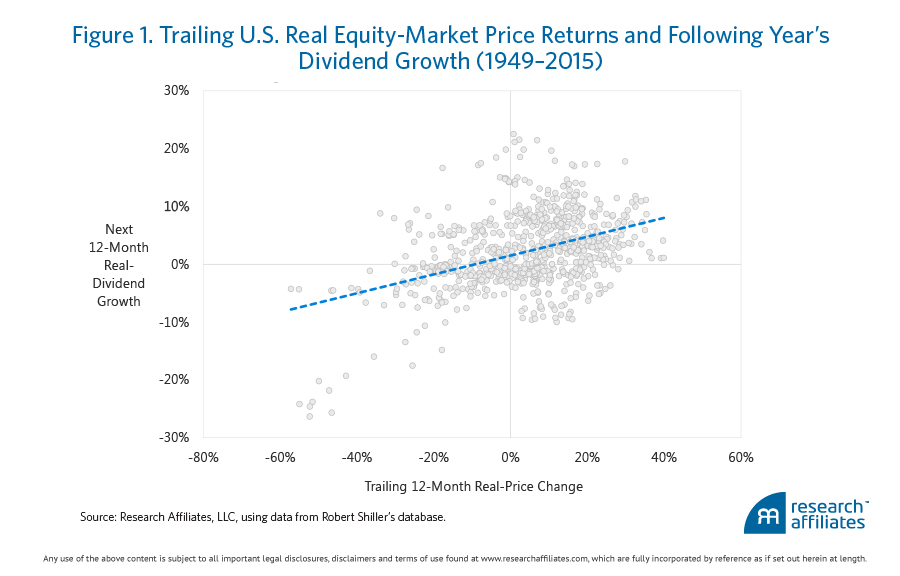
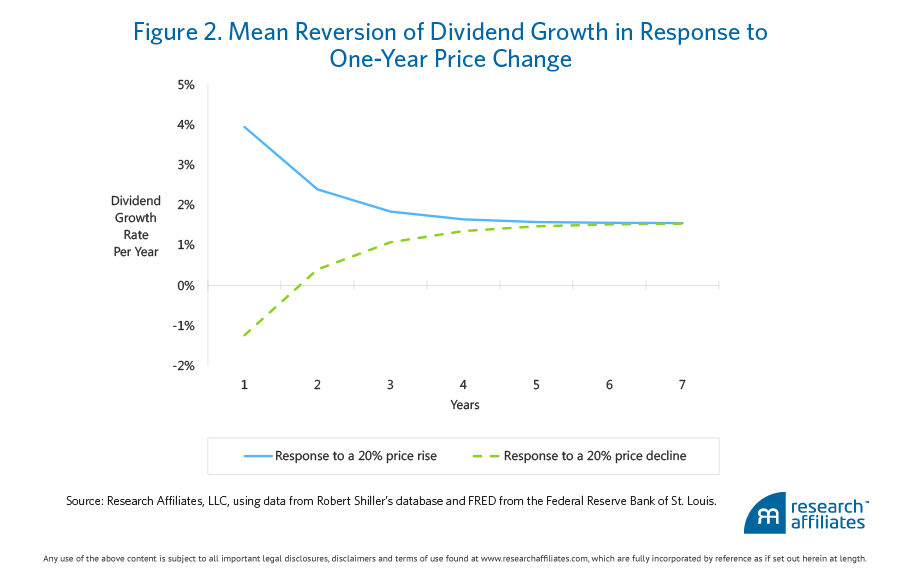
For the period 1949–2015, each percentage point increase in price of the U.S. equity market is associated with a positive 13-basis-point change in the dividend growth rate in the coming year.4 The deviation of dividend growth rates from their long-term averages is also persistent. If last year’s dividend growth was above trend, about 40% of the excess growth will persist into the following year. Figure 2 shows the inferred response in dividend growth to a one-year price change, given that growth was at trend. For example, a 20% price rise will cause the expected real-dividend-growth rate to rise from the 1.5% average to nearly 4% in the next year. The growth rate will slowly revert to trend over the following several years. Likewise, a 20% reduction in the market’s value implies a real-dividend-growth rate of −1.25% the following year. Historically, deviations in growth from long-run averages decay over a period of years.
Clouds on the Horizon?
At times, the risk to your ship, passengers, crew, and cargo differs from what fellow mariners’ activity would suggest. Take heed. In such times, chart your own course to the nearest port. No less importantly, when weather conditions once again turn favorable—and others are still sleeping it off in the alehouse—the swiftest to move will collect the largest bounty. Similarly, when investors allow historical price returns to be their sole source of information about future investment opportunities, they run the risk of allowing random price fluctuations to drive perceptions, going to cash too late and staying in cash too long.
In this domain, however, the pursuit of knowledge is a bumpy ride. Not a well-behaved, self-limiting process, the relationship between current prices and future dividend growth is dynamic: prices predict growth, which begets price changes. AMN demonstrate that the dividend growth model is inherently unstable. Accordingly, the AMN model—just like markets—displays characteristics of bubbles and crashes, a pleasing replication of the observed market phenomena. As Figure 1 shows, mean reversion sets in up to one-third of the time. In calm periods, when investors are lulled into confidence that the sun will shine again tomorrow, market-price changes may differ in sign from future dividend growth rates. Many of these cases are small aberrations, similar to a passing shower on an otherwise-crystal-clear day. Less frequently—but far more consequentially—other cases result in unforecasted changes in the environment that can prove very expensive, either through direct loss (by staying at sea too long) or opportunity cost (by staying in port too long).
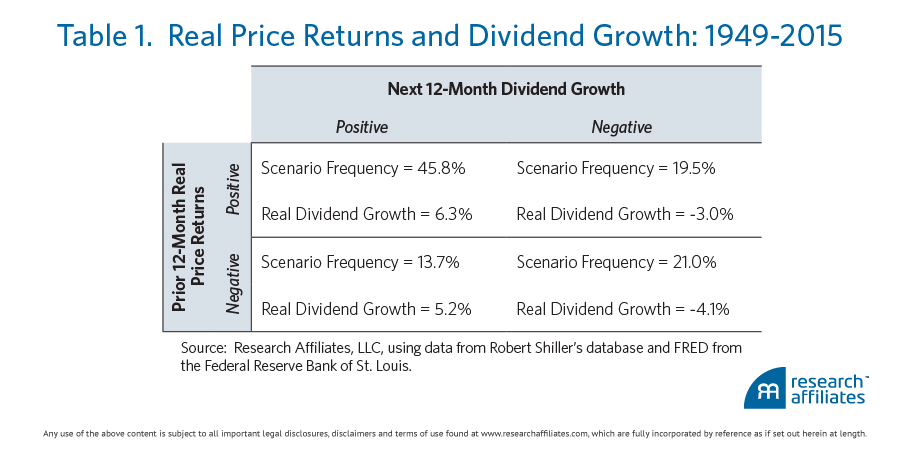
Exactly how expensive are unforecasted changes? Table 1 displays the statistical incidence and investment impact of agreement and disagreement in historical price returns and subsequent dividend growth. For example, in 19.5% of the observations, the market return over the previous 12 months was positive, and the next 12 months’ growth in dividends was negative. The real-dividend-per-share growth difference was a whopping 9.3% lower (i.e., 6.3% under the positive/positive scenario and the negative 3.0% under the positive/negative scenario) than its average in the more usual case of both prior market return and subsequent dividend growth being positive. The real-dividend-per-share growth difference was similar in magnitude (i.e., 5.2% under the negative/positive scenario and the negative 4.1% under the negative/negative scenario), but opposite in sign, when the prior market return was negative and subsequent dividend growth was positive.
Predicting the Unexpected?
To essentially see beyond the horizon, when shorter-term price movements aren’tindicative of future changes in fundamentals, we can consult an improved guide, a more fundamental driver—predictive changes in the economy. We can define periods of economic and market agreement and periods of discord by using timely variables, such as the New Orders series from the monthly Institute for Supply Management (ISM) Report, to forecast the probability, at any time, of agreement between the economy and the market.5 Typically macro-based measures suffer from a significant lag in reporting as well as frequent revisions, making them inferior to the immediacy of observing market data, month by month, day by day, even tick by tick. Using ISM data allows us to sidestep this concern.
Figure 3 can be viewed as a map to the zones of continuing predictability and to the zones or periods requiring heightened attention to our future investment direction. We can view the map as being a superior weather forecast to simply looking skyward or counting ships still at sea. When the market and macro environments are in agreement and harmony (the top-right and bottom-left quadrants), we can expect a continuation of the current positive trend in stock price and dividend growth. We are either on the high seas with the other sailors or holed up with them in port. In the top-left quadrant, surprise squalls are possible and we should run close to port; fundamental growth is slower and the probability of a severe storm is higher. During the calm after the storm (bottom-right quadrant), the fundamental growth rate is recovering; we can venture out of port ahead of others who are still awaiting the assurance of a cloudless sky. Even so, we should remember to stay reasonably close to shore because we might need to seek shelter again. The transition zones of the top-left and bottom-right quadrants allow us to position ourselves for the heightened possibilities of large, positive fundamental changes that may be in the offing.6
The two paths in Figure 3 show representative evolutions from growth to slowdown over the 1989–1990 period (blue line) and slowdown to growth in 2009 (green line). In the former case, the economy began to show signs of slowing as the New Orders Index fell below the neutral reading of 50 in mid-1989. At that juncture, the trailing real-price return of the equity market was a healthy 14%, and not until August 1990 did the equity market post a negative annual return. In the latter case, both the economy and the market were unarguably weak in early 2009, but by August, the New Orders Index had ticked above the neutral stance of 50, even with the equity market’s trailing real-price return down a depressing 22%. The rebound was swift and vigorous, practical evidence that the macro and market environments can shift very quickly, and when the change is for the better, it is well for investors to be underway.
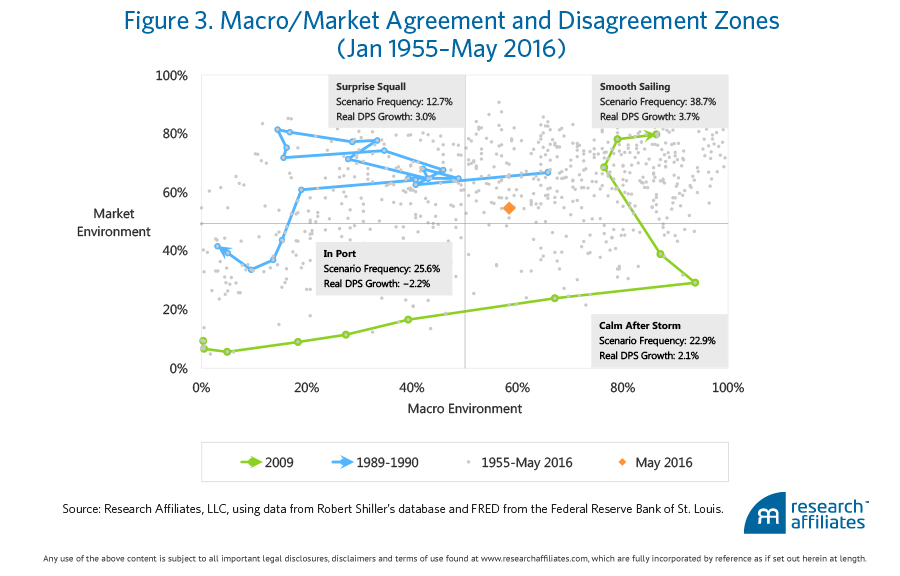
Chart Your Own Course
As with the weather, the generally safe assumption is that tomorrow’s investing environment will be similar to today’s, that the market has it right and stock prices provide significant information about fundamental dividend growth. In these cases, whether holed up in port or out on the open sea, those who follow the market and those who interpret the constellation of economic information will draw the same conclusions. But when—and this is a catastrophic “when”—the wind changes, for fair or foul, astute investors will heed the warning offered by the economy and set their own course. Once the winds turn sweet again, these investors can slip out of port, passing the wrecks strewn along the coast, leaving behind those hesitant to venture forth until the sun is high in a midday, cloudless sky. The adventuresome investors will be first to reap the bounty of the open seas, buying equities early, before the impending fundamental dividend growth is evident to less independent-minded and knowledgeable investors. Since 2009, when real-dividend-per-share growth was negative and wise investors were in port, investors have been enjoying smooth sailing. It may be time for investors to check the way the economic wind is blowing and chart their own course to steer away from a storm in the offing.

Appendix: Macro and Market Growth Probabilities
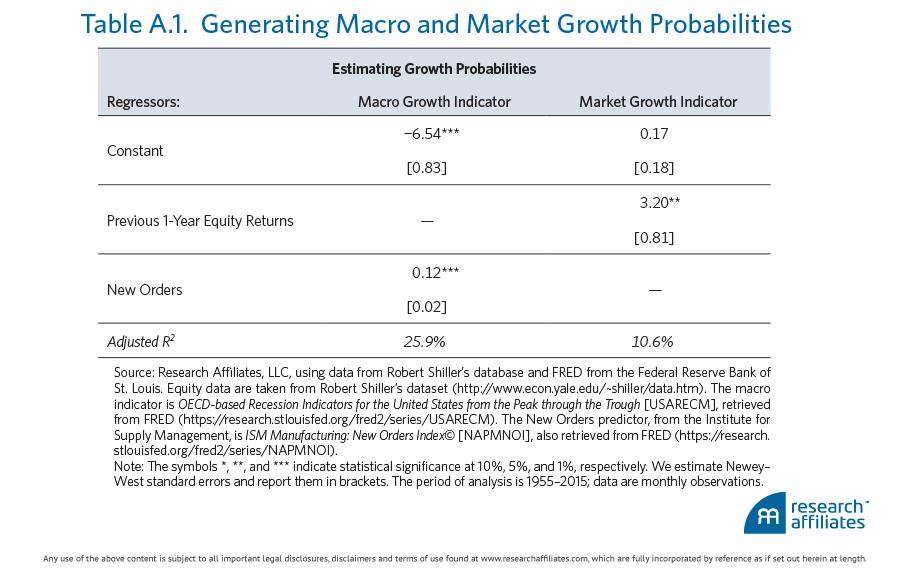
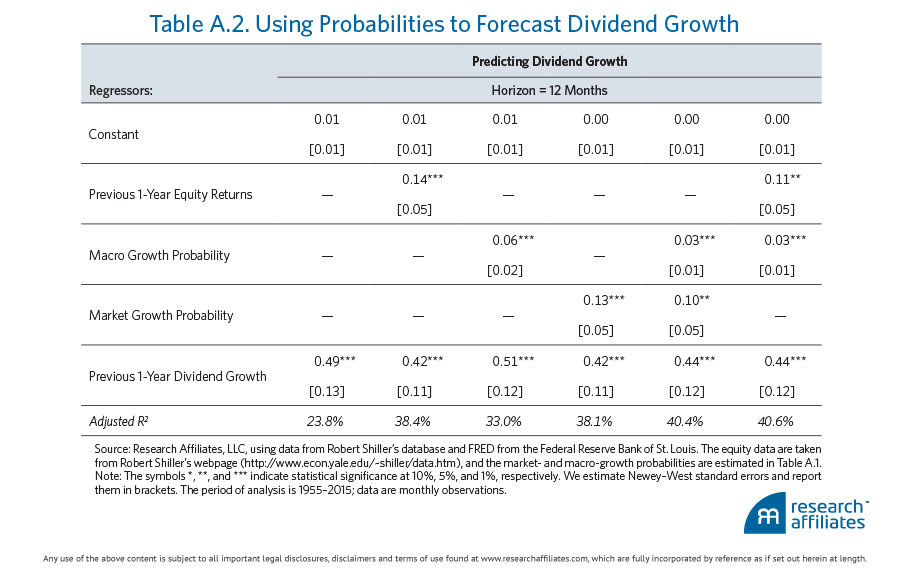
Table A.1 summarizes the empirical models used to generate the macro and market growth probabilities, which are used to construct Figure 3. Table A.2 corroborates the actual forecasting power of these probabilities.
Table A.1. presents the estimates of two probit regressions: in the first column, the macro-dependent variable is the OECD Composite Leading Indicator; in the second column, the market-dependent variable is a dummy variable that takes the value of 1 if the next 12 months’ real-dividend-per-share growth is above its long-term average, and zero otherwise.
In Table A.2., we forecast year-over-year real-dividend-per-share growth (linear regressions).
Endnotes
- Dickens (1901), p. 4.
- Of course, precisely because the market is a good indicator of the future environment, prices adjust accordingly, and little profit can be gained from the knowledge.
- All equity- and market-related estimates in this article are based on Robert Shiller’s equity dataset.
- We present the formal statistical tables for the regressions in the appendix.
- The appendix provides more details concerning the formulation of these probabilities.
- The offing is the sea close to land and just beyond the area traditionally used for anchoring. The word also refers to the near future.
References
Adam, Klaus, Albert Marcet, and Juan Pablo Nicolini. 2016. “Stock Market Volatility and Learning.” Journal of Finance, vol. 71, no. 1 (February):33–82.
Dickens, Charles. 1901. The Uncommercial Traveller, The Lamplighter to Be Read at Dusk Sunday under Three Heads and The Lazy Tour of Two Idle Apprentices. London: Chapman & Hill, Ltd., and New York: Charles Scribner’s Sons. “Printed from the edition that was carefully corrected by the author in 1867 and 1868.”
Moore, Peter. 2015. The Weather Experiment: The Pioneers Who Sought to See the Future. New York: Farrar, Straus and Giroux.
