We agree with today’s narrative: AI promises to revolutionize the economy and our lives.
Because Nvidia has emerged as the cornerstone company designing chips for the AI revolution, investors are understandably euphoric about the prospects for its stock price.
We believe that, like Cisco and Qualcomm in 1999-2000, Nvidia has terrific long-term business prospects and its stock price may be a bubble.
For nearly four decades, Moore’s Law has been the governing dynamic of the computer industry, which in turn has impacted EVERY industry. The exponential performance increase at constant cost and power has slowed. Yet, computing advance has gone to lightspeed. The warp drive engine is accelerated computing and the energy source is AI.
”The incipient artificial intelligence (AI) revolution has taken the markets and the broader world by storm. From the announcement of ChatGPT-3.5 in November 2022, the markets and much of the public have been enthralled by the seemingly limitless possibilities of AI. 1
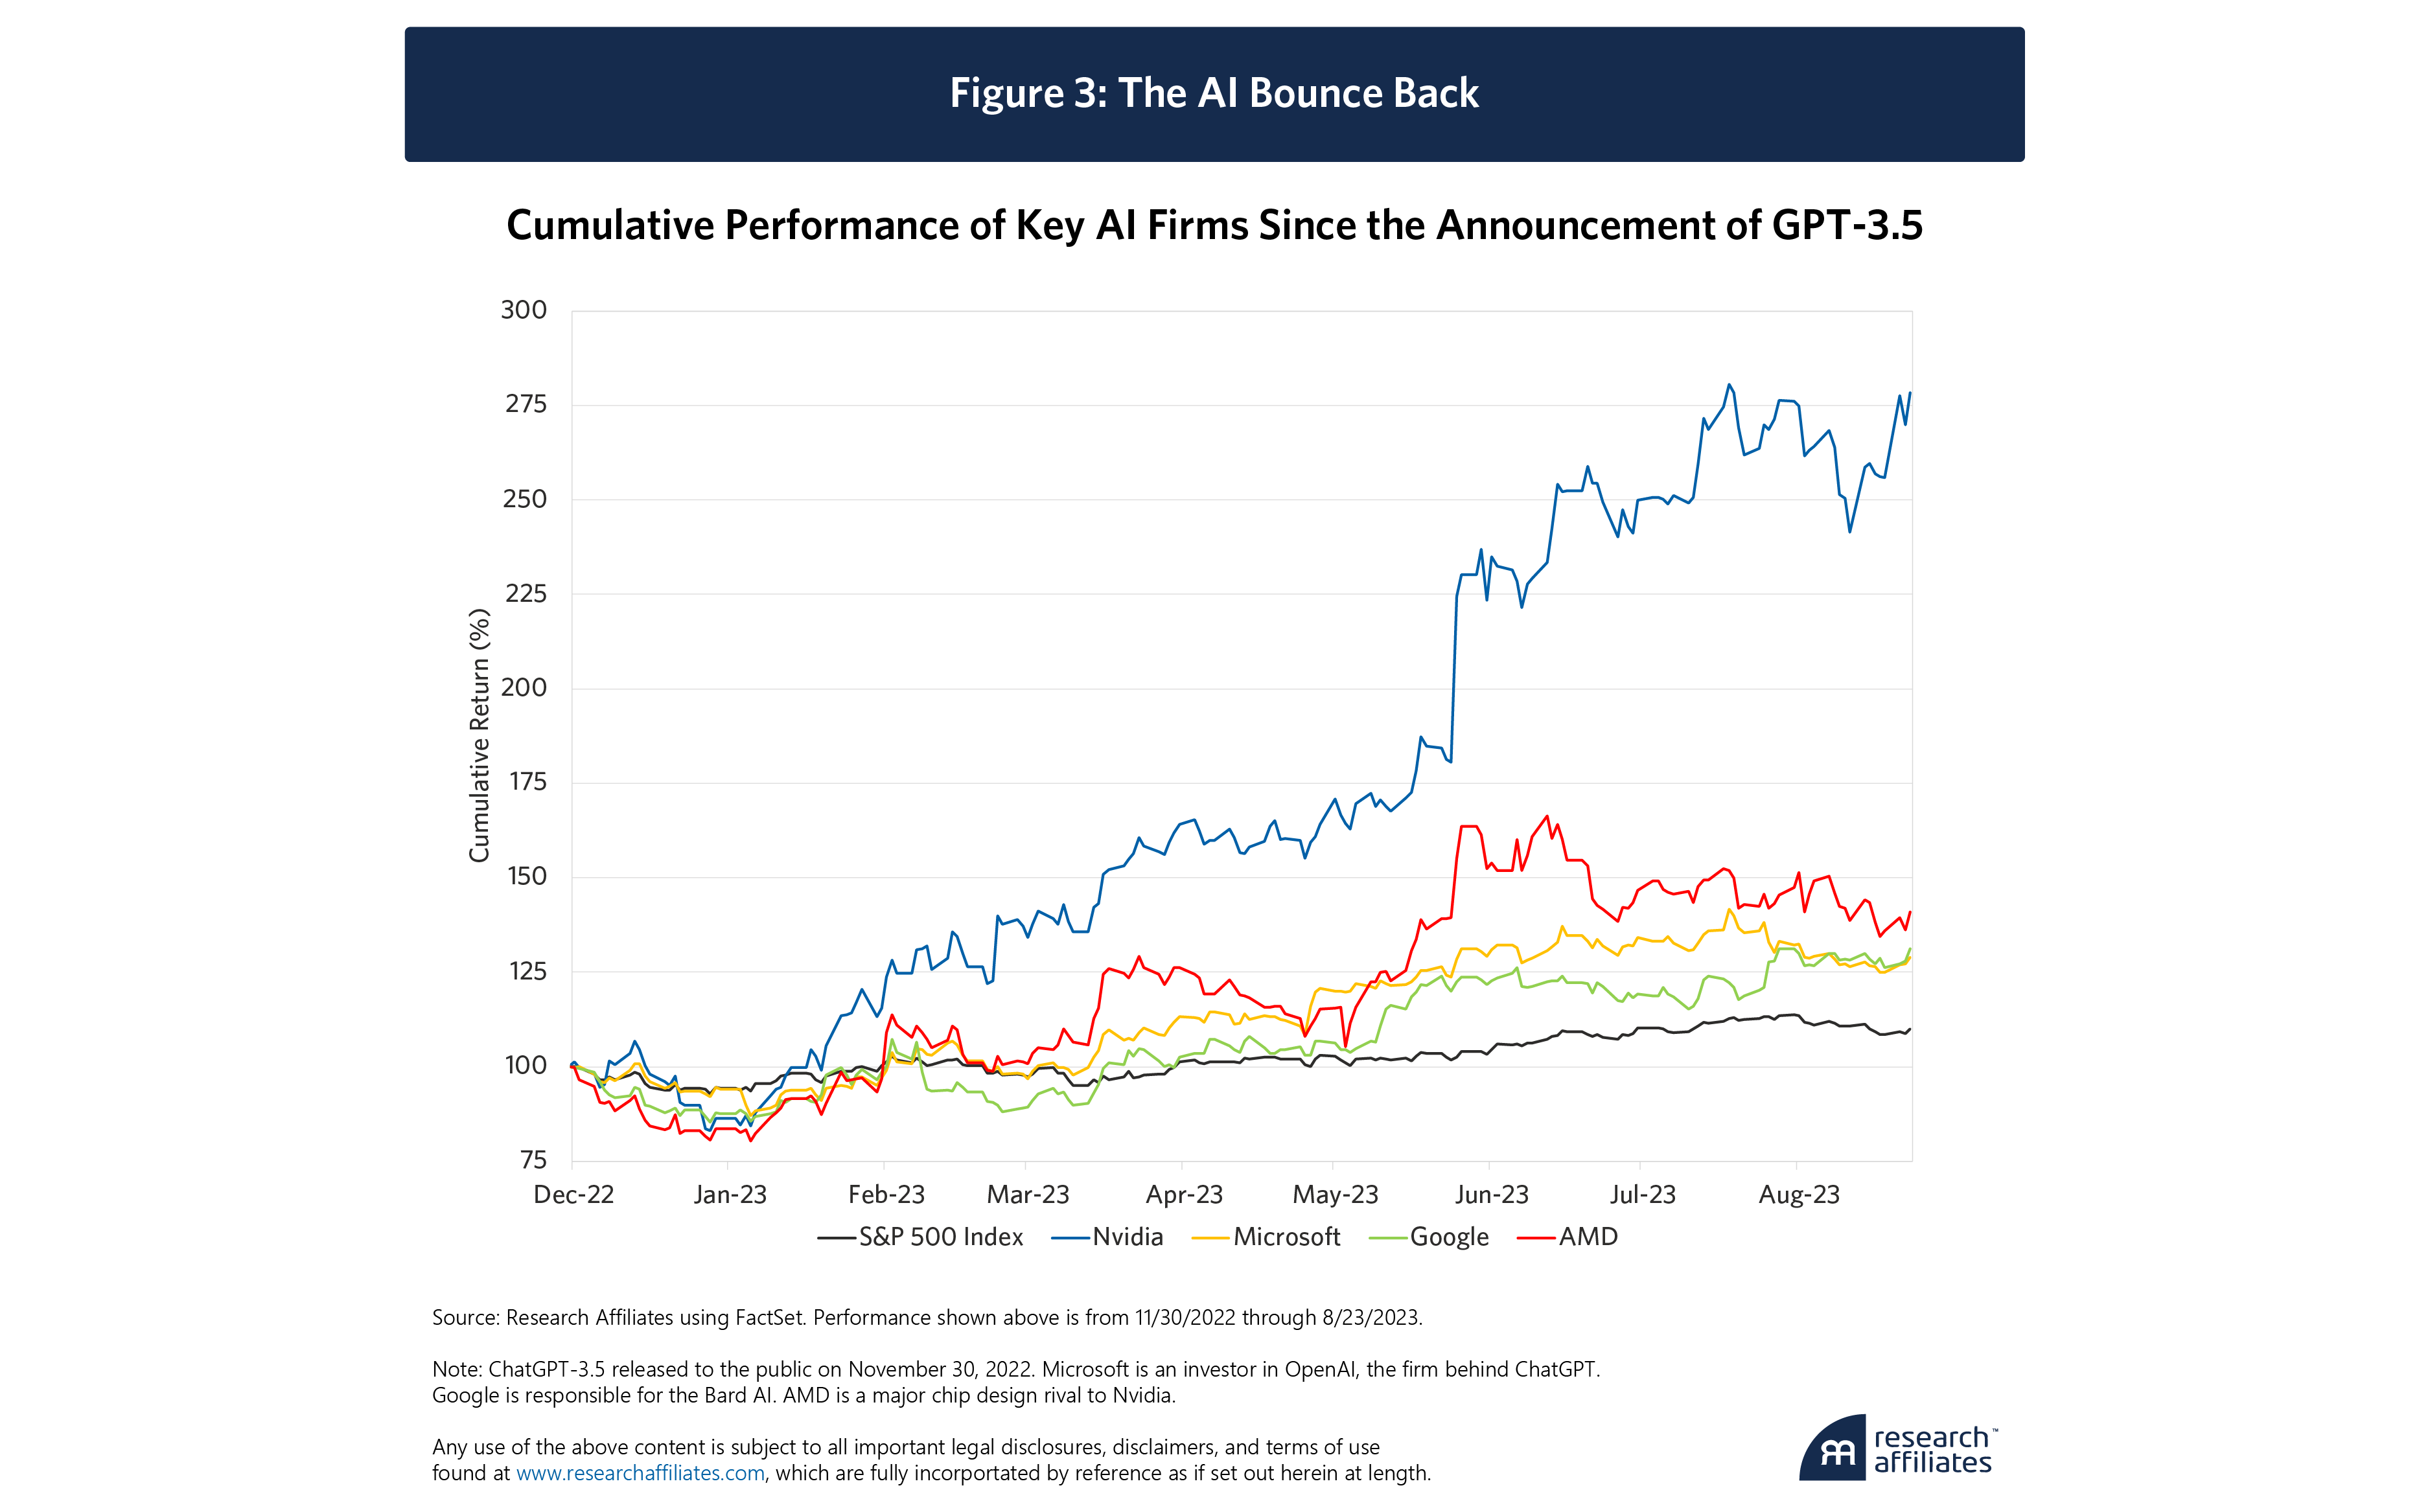
Markets have wholeheartedly embraced the AI narrative by capitalizing expected future earnings in today’s stock prices. No company illustrates the market’s present enthusiasm more than Nvidia. Its stock price has surged more than 278% since November, spiking to a trillion-dollar market cap, thoroughly expunging any memory of its 60% decline in early 2022.
Create your free account or log in to keep reading.
Register or Log in
Narratives have the advantage of usually being partly or wholly true. They have the disadvantage of being entirely discounted by current share prices. For a popular company bolstered by an optimistic narrative to outperform the market, its future must prove even brighter than its glowing present outlook.
Consider the “New Paradigm” of 1999 and 2000
Brad Cornell and Aswath Damodaran coined the expression “big market delusion” (Cornell & Damodaran, 2020) to describe situations where a narrative about a nascent industry gets ahead of the plausible reality.2 In 1999 and 2000, the dot-com bubble inflated on the narrative that the internet represented a “new paradigm” that would change the way we communicate, share ideas and information, and buy and sell goods.
All true, but it didn’t help the dot-com investors, because the good news was fully reflected in share prices!
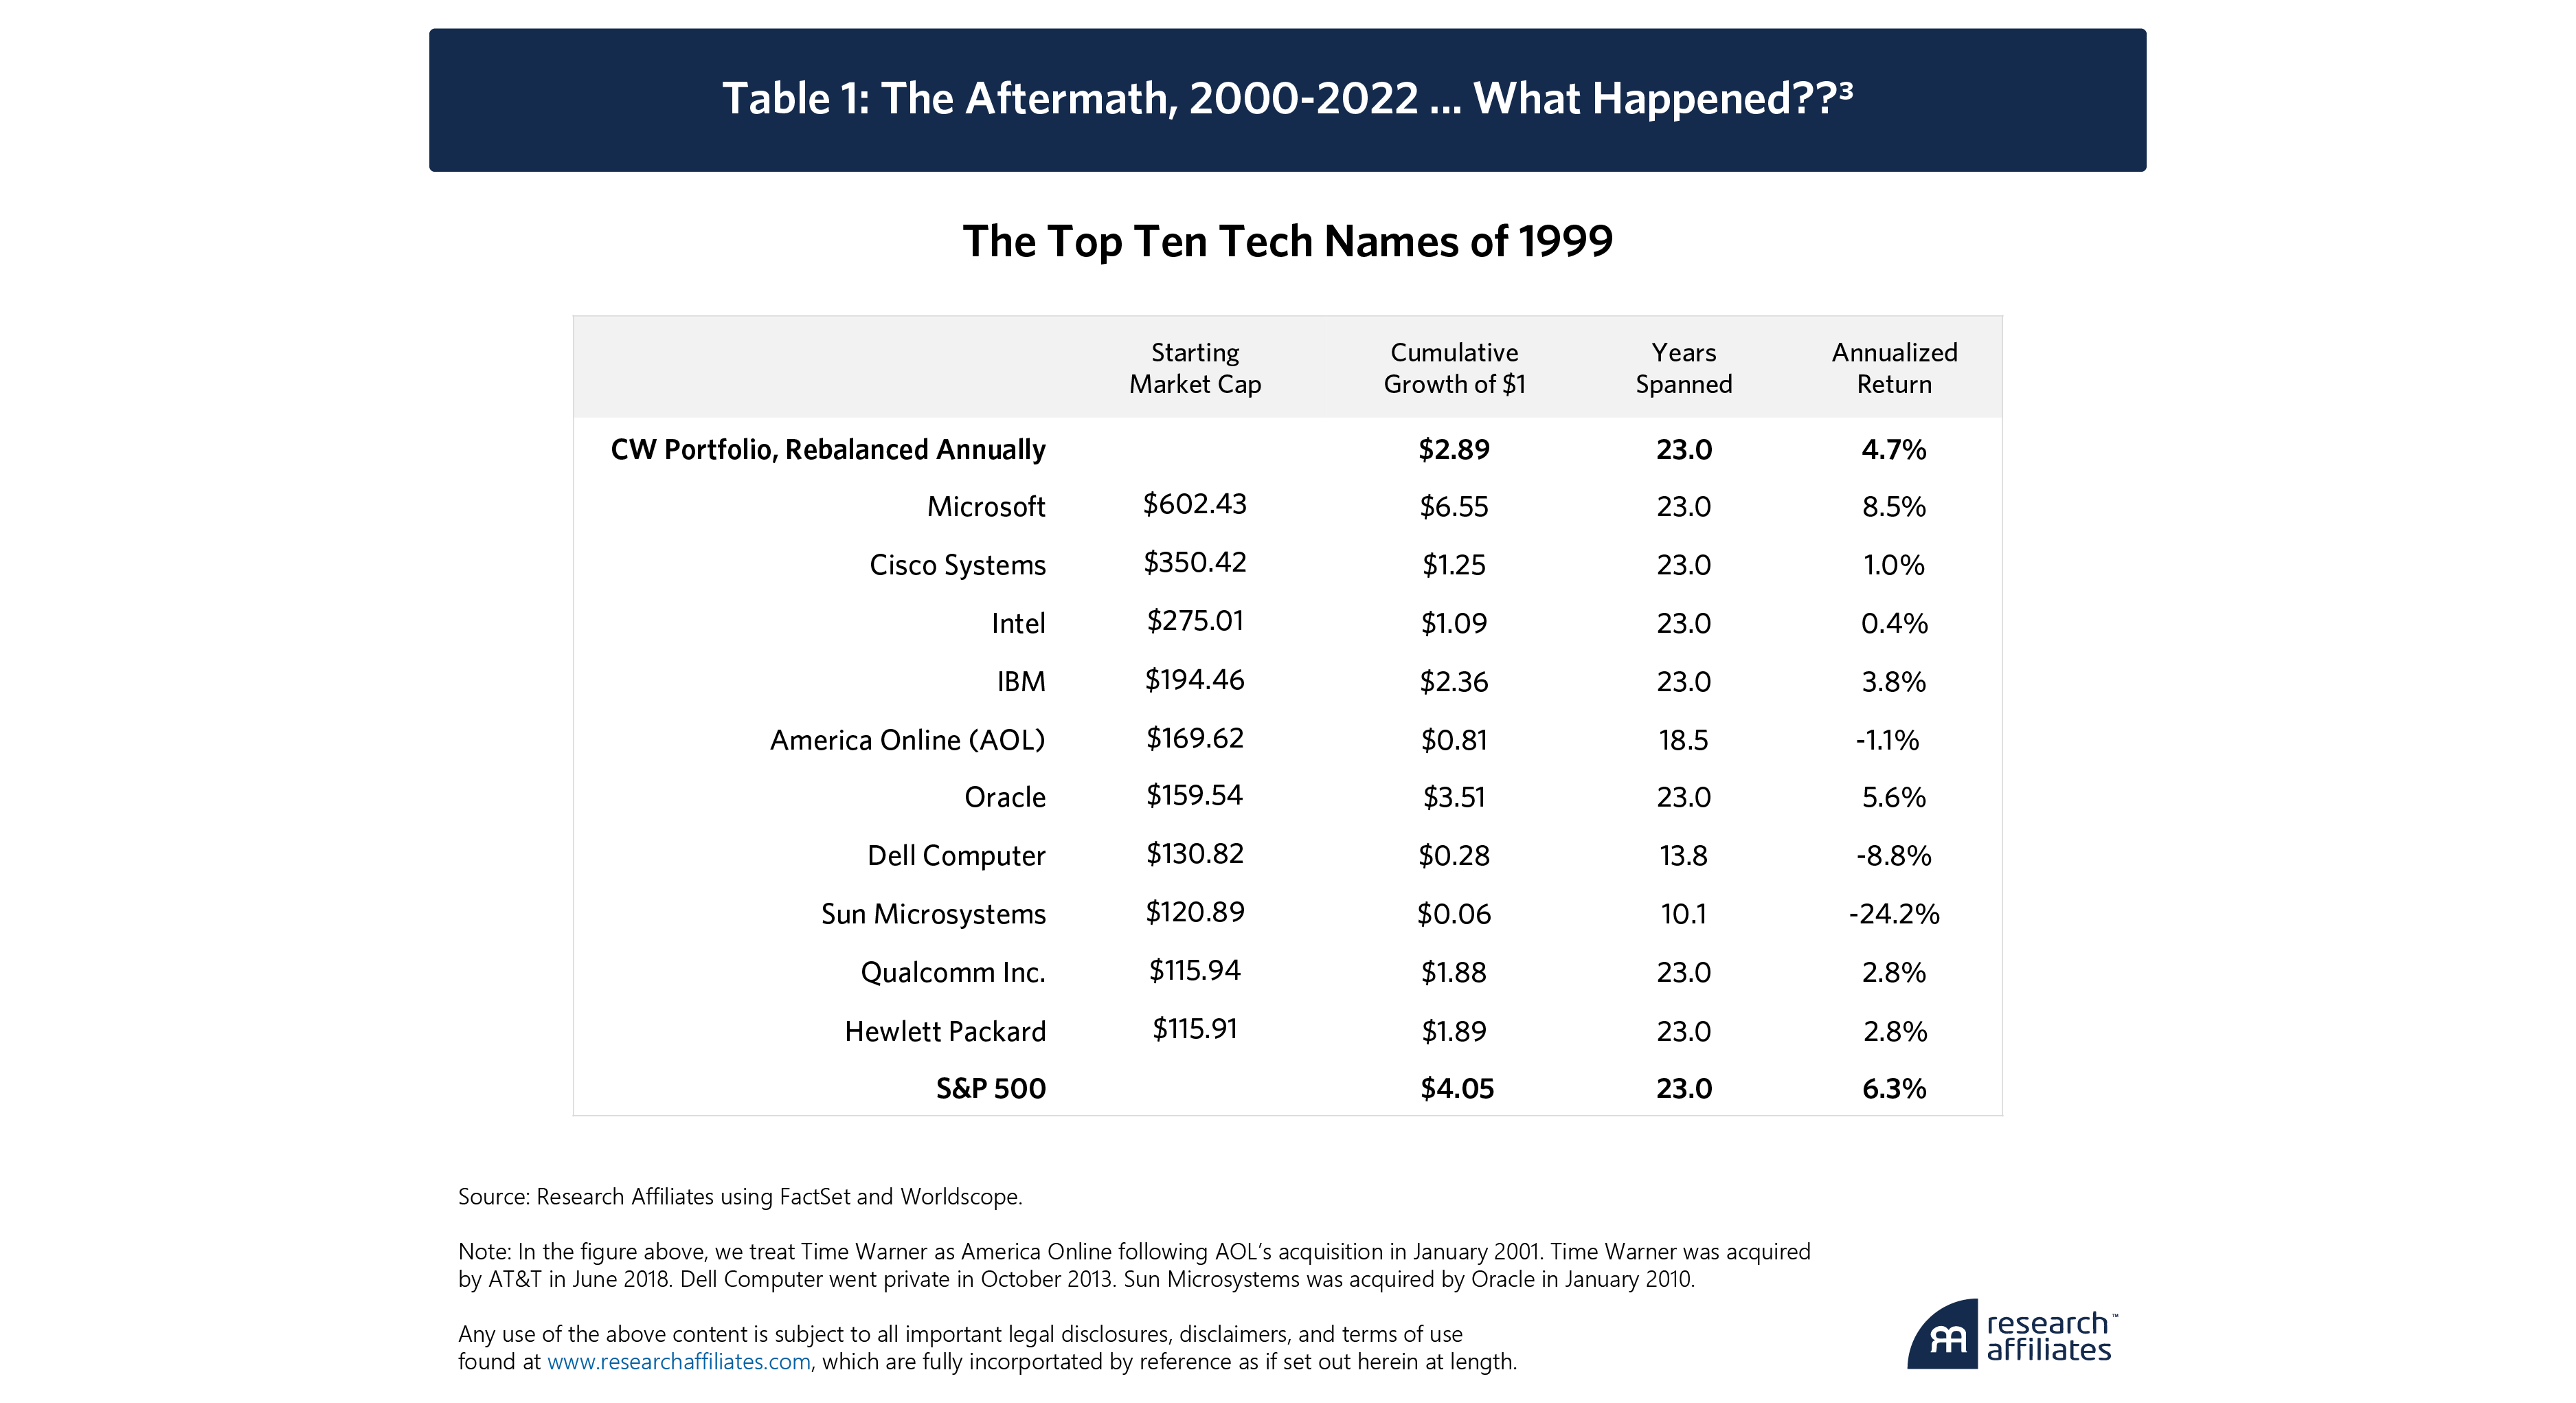
As growth fell short of the narrative, the dot-com bubble deflated. How many of the ten most valuable tech stocks in the world at the peak of the dot-com bubble beat the market by the time of the next bull market peak in 2007? None. How many were ahead at the end of 2022, fully 23 years after the dot-com bubble crested? One: Microsoft. (Table 1.)
Why does this list not include Apple or Amazon, both actively traded in 2000? Neither made the top 10 cut. In the wake of the famous “Amazon-dot-bomb” research report in 1999, Amazon fell sharply, and would have ranked 23rd on the largest-cap tech list, between Solectron and Gateway (remember them?). Meanwhile, Apple was struggling to survive—Steve Jobs had just returned to try to right the ship—and ranked as the 30th most valuable tech stock at the start of 2000.
After 23 years, the median outcome for the top-ten tech stocks list from 2000 is a 61% shortfall in eventual wealth relative to an investor in the S&P 500. And because Microsoft, the only company on the list to outpace the S&P 500 over the 23 years, was already the largest market-cap stock in the world at the end of 1999, an investor in the cap-weighted portfolio of the top-ten tech stocks of 2000 was “only” 29% poorer than the S&P 500 index fund investor.
Microsoft was the sole winner out of the top 10 list, a respectable 2.2% per year ahead of the S&P 500. Still, it lost its way under Steve Ballmer throughout the decade of the 2000s. Its stupendous success was mostly achieved after Satya Nadella replaced Ballmer in 2014. Indeed, for eighteen years, Microsoft was a laggard relative to the S&P 500.
Let’s consider Qualcomm, the top-performing stock in the world in 1999, rising 26-fold in a single year. Qualcomm was the herald of the wireless future and priced accordingly. Qualcomm was trading at 278 times earnings at its December 1999 peak. How has it fared since?
Qualcomm’s business growth has been stupendous. In the following 23 years, its sales and profits per share grew by 14% and 19%, compounded per annum. Qualcomm’s profits are now 60 times as large as they were at its peak in 2000.
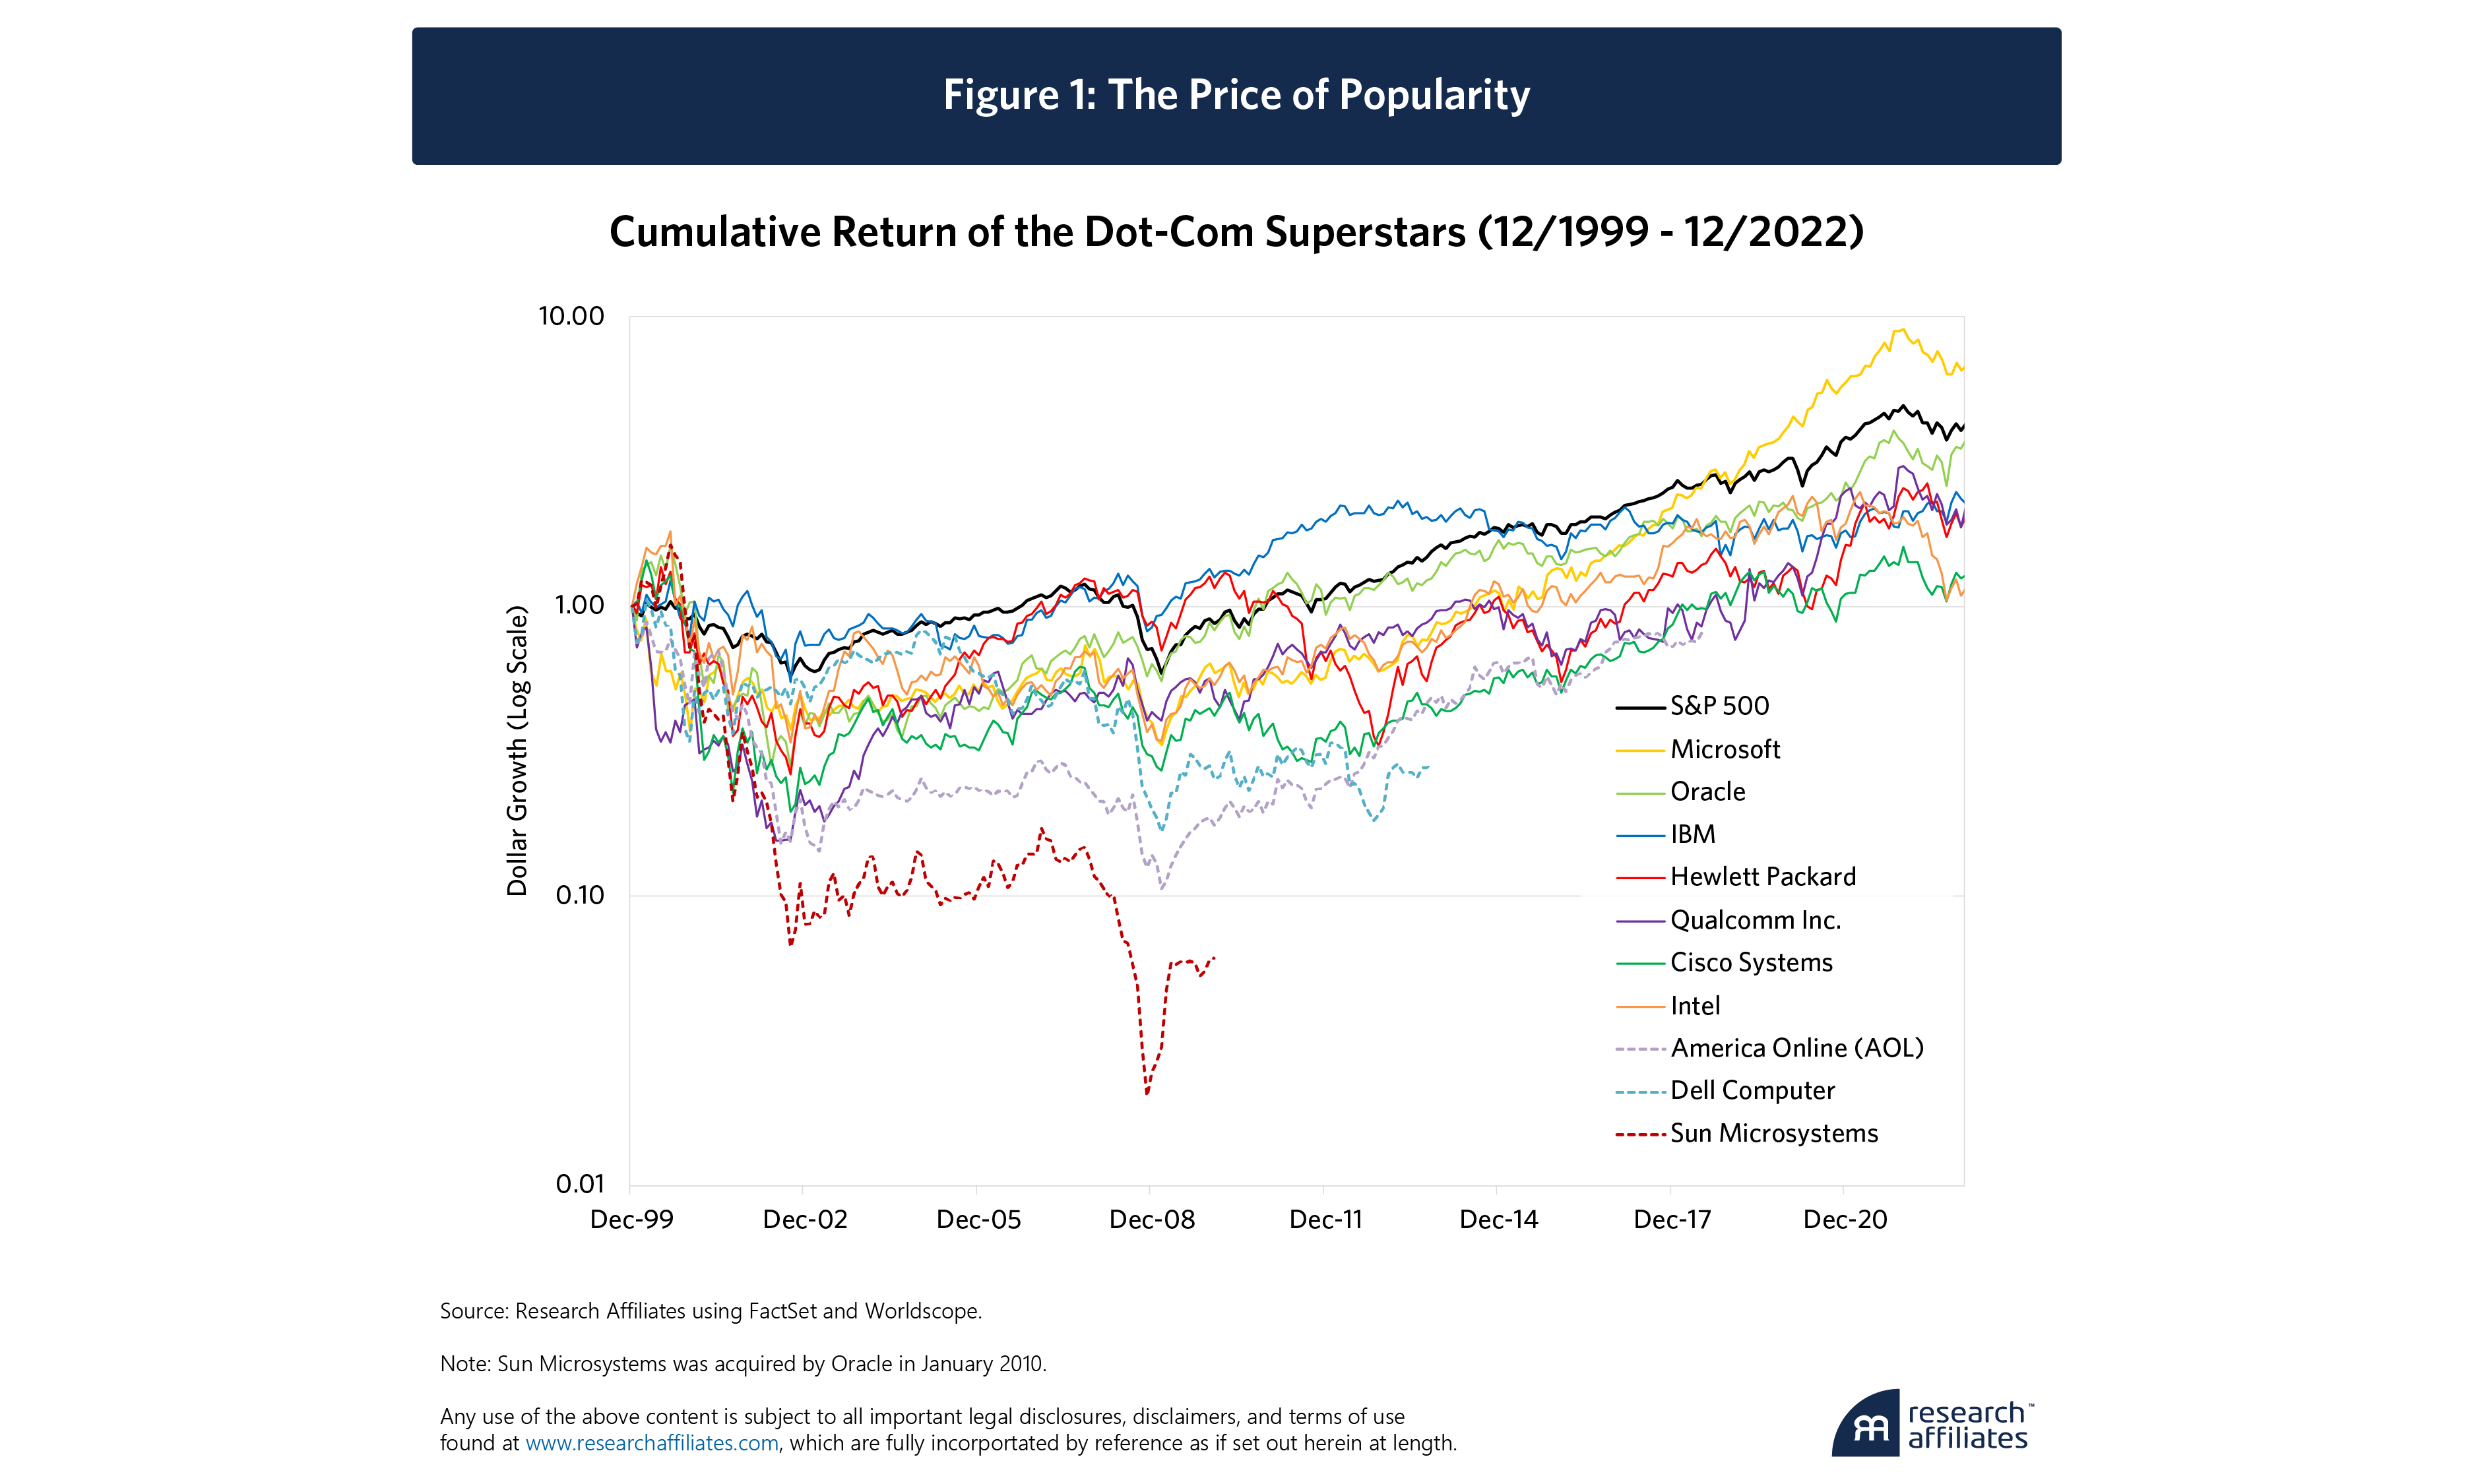
With the company growing impressively, how did Qualcomm’s 1999 investors fare? For the next 14 years, Qualcomm’s investors were under water (a negative cumulative return since year-end 1999). (Figure 1.) By year-end 2022, it had earned its patient investors an 88% cumulative return—far short of the S&P 500’s 305% gain.
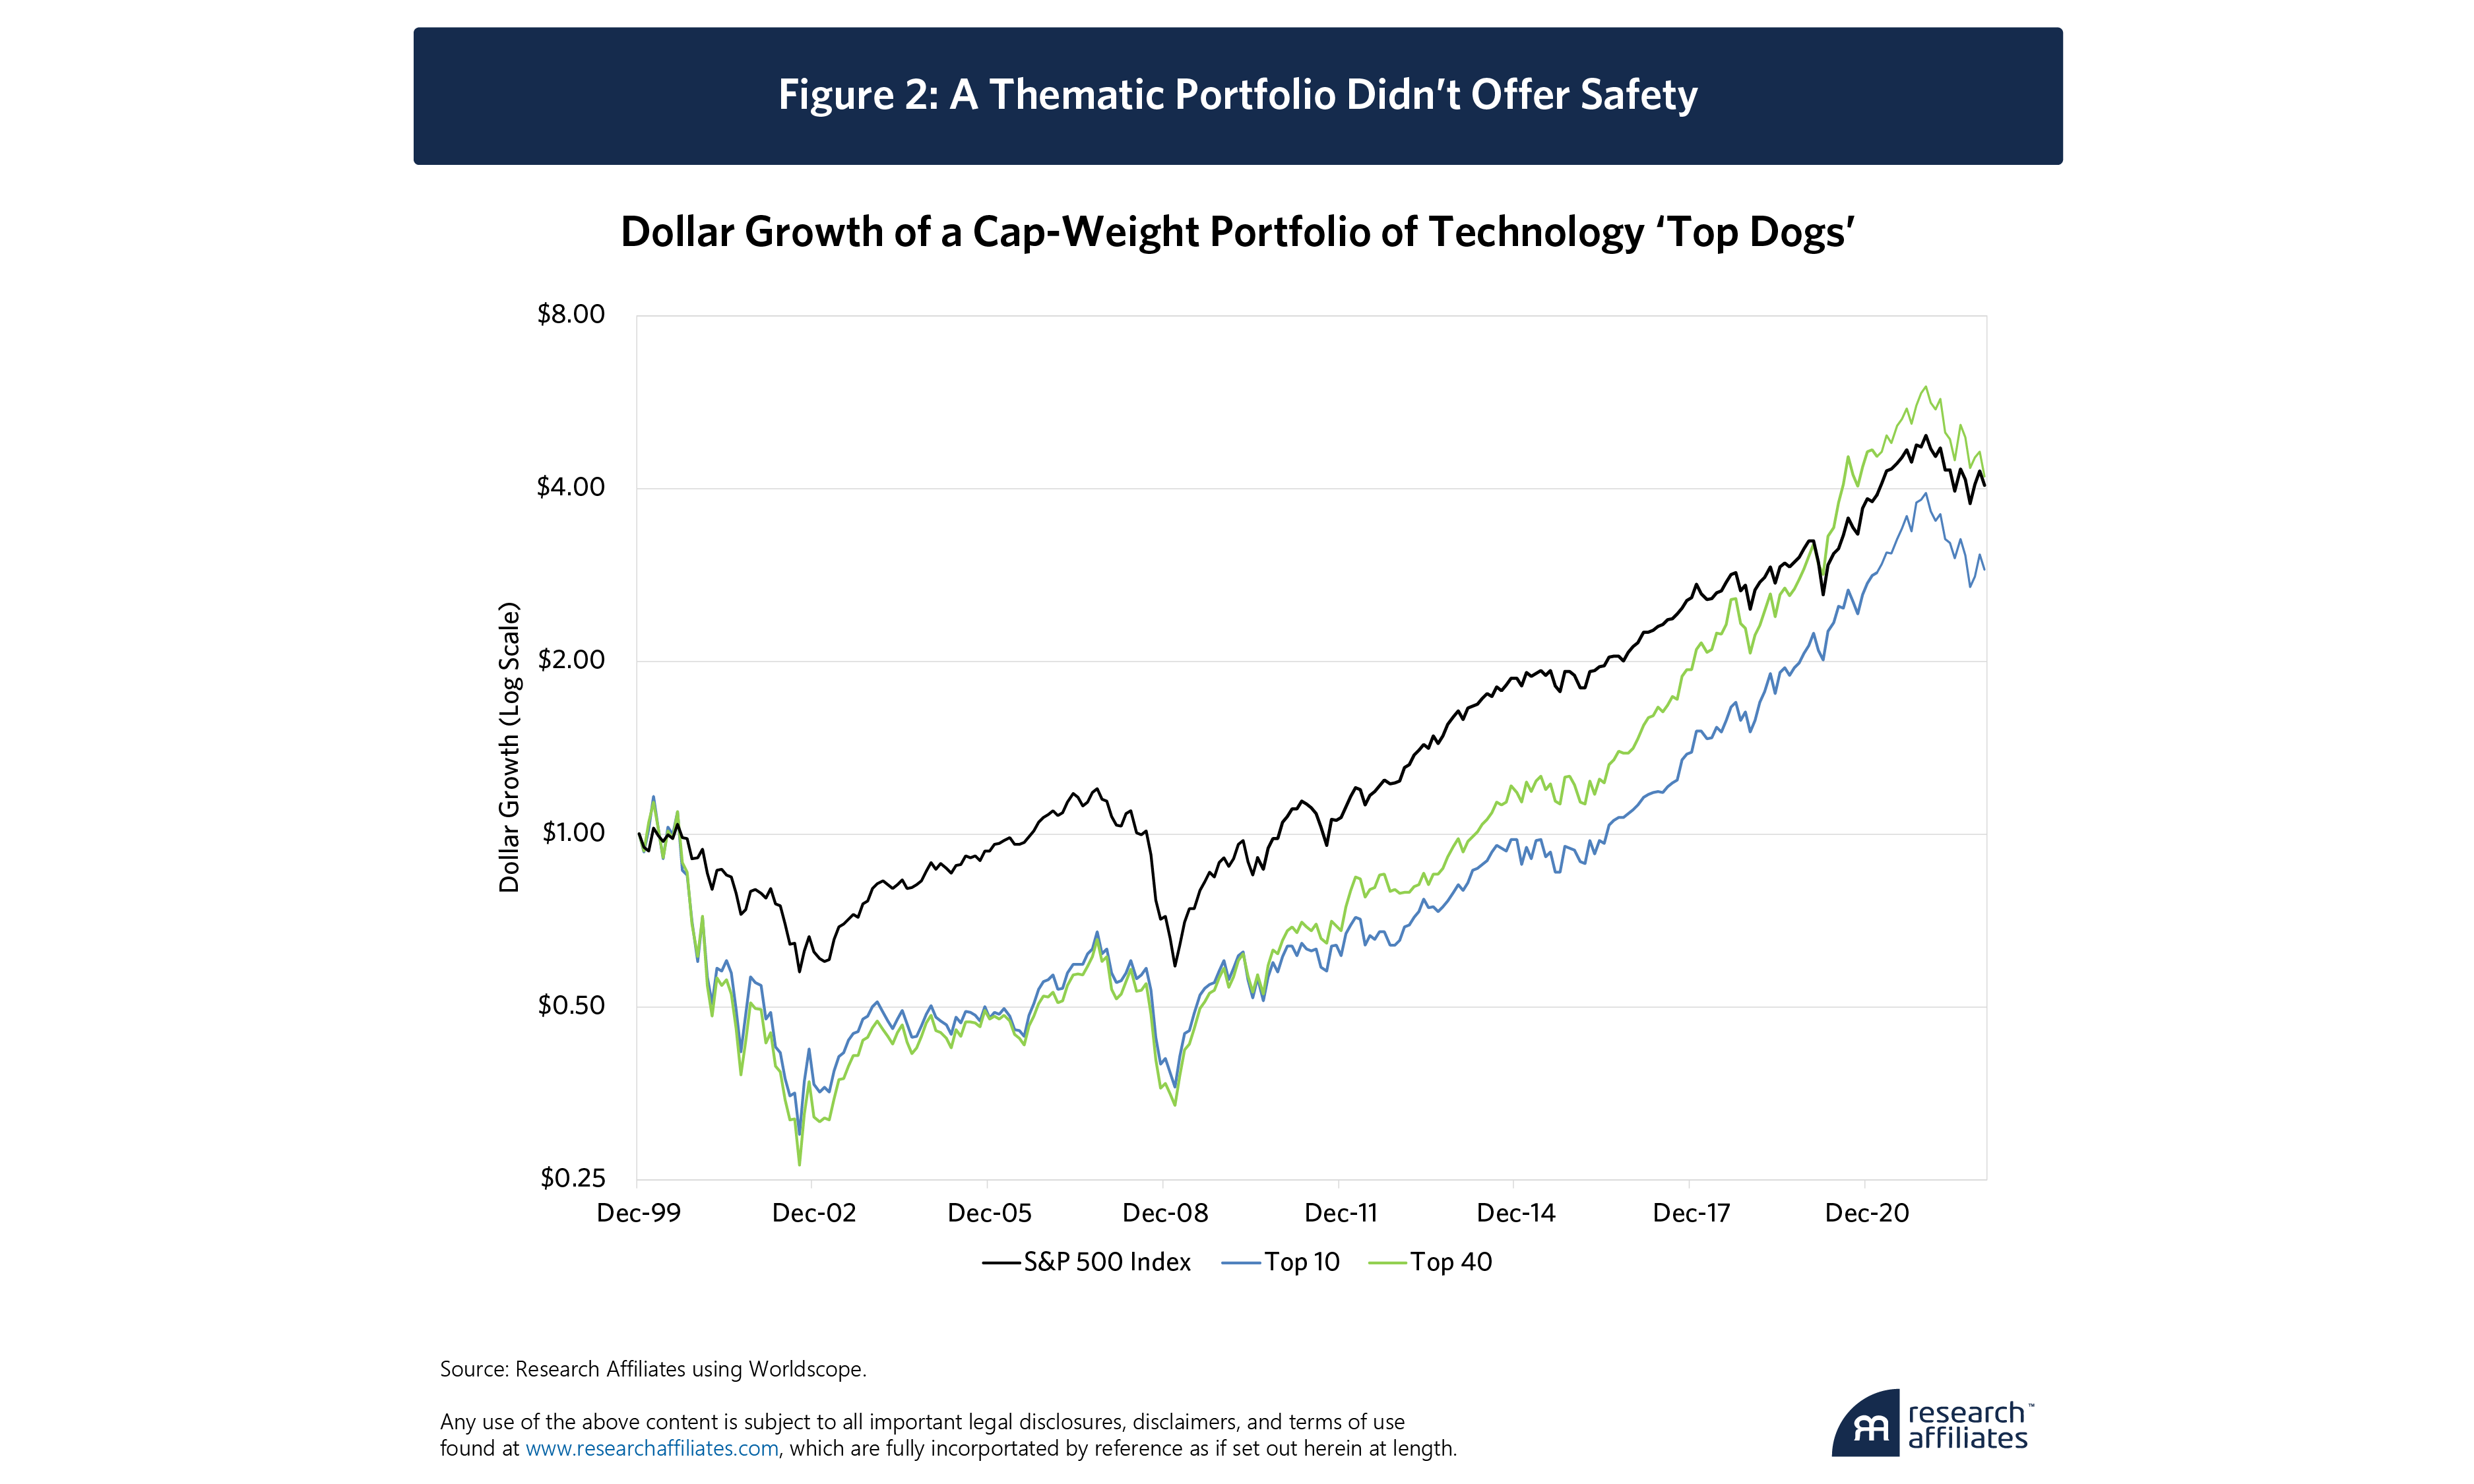
How did our top ten stocks fare as a portfolio? Our top-10 tech bubble portfolio—in blue—quickly lost about half of the investor’s wealth, relative to a S&P 500 index fund investor, and finished the 23 years 29% poorer than the S&P 500 index fund investor.
What if we dig deeper, choosing to own the 40 largest market-cap tech (and telecom and consumer cyclical names, in order to capture Qualcomm and Amazon), at year-end 1999? The carnage after the tech bubble burst for the following decade was just as bad for the top 40 (in green) as for the top 10 (blue). (Figure 2.)
But those next 30 names include some important winners, who began to make their presence known beginning in 2011. After 20 years in the doghouse, the tech-bubble-enthusiast who owned the top 40 names finally pulled ahead of the S&P indexer and remains modestly ahead to this day.
In both portfolios, as is so often the case, it boils down to not missing out on the top performers. For both the top-10 and top-40 list, it’s all about Microsoft and Apple. By year-end 2022, Microsoft is a whopping 69% of our top 10 portfolio; without Microsoft, our top-10 portfolio would have delivered a scant 46% gain.
For the top-40 portfolio, Apple started as a tiny 0.5% position in our portfolio and finished as a 34% holding; that’s what a return of 16,506% will do for us! Leave out that single 0.5% holding and we finish the 23 years 33% poorer.
The AI Revolution
Today’s AI narrative is simple. AI will be at the core of new economic activity, a revolutionary advancement on the scale of the mechanical loom, telegram, steam engine or internet—maybe even the wheel.
Yes, AI seems a breakthrough that promises disruptive innovation. It’s also a bubble. Bubbles are rarely wrong on the narrative, just on the timeline, and the potential for interference by unseen future competitors. While some AI stocks may exceed the extraordinary success priced into their shares, history teaches most will fail to do so. Choosing the future winners in the AI revolution is like selecting Amazon and Apple and ADP at the beginning of 2000; these were the only three stocks out of the top 40 tech names to deliver double-digit returns over the subsequent 23 years.
ChatGPT-3.5 was released to the public by Open AI (backed by Microsoft) in November 2022. It immediately captured the zeitgeist. The resulting AI meme manifested in surging stock prices of firms deemed likely to be AI leaders in the years ahead. (Figure 3.)
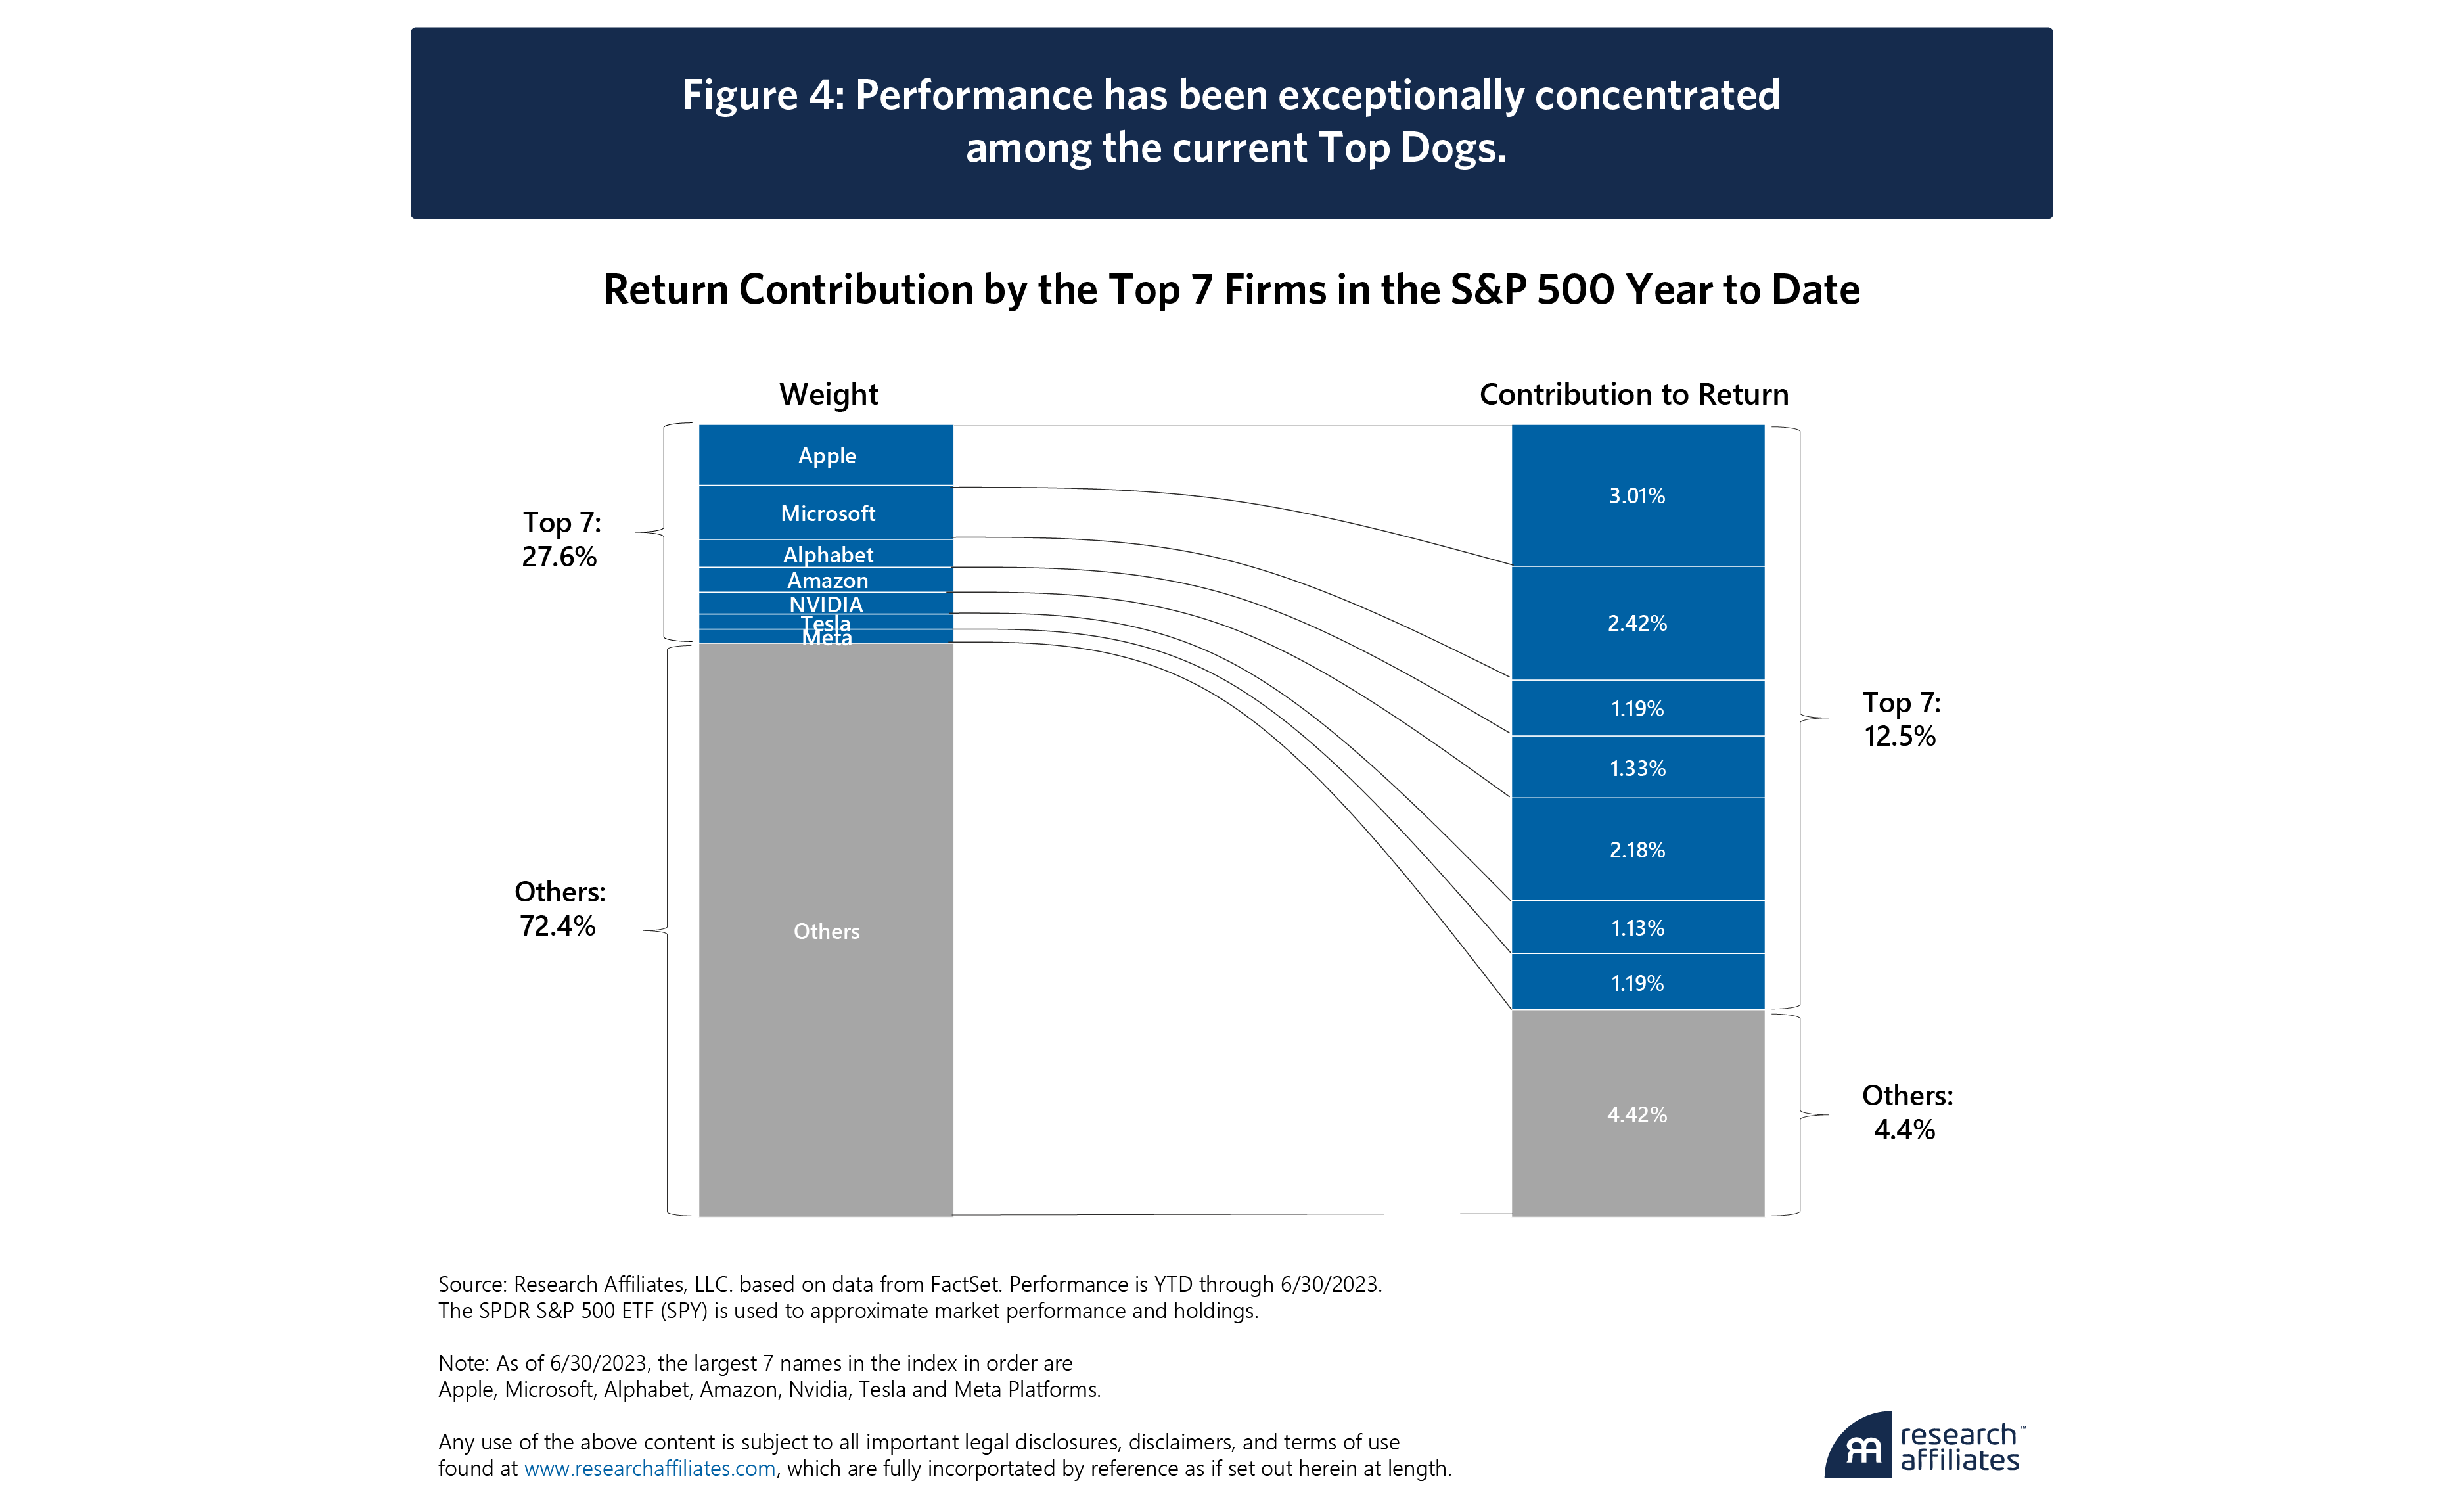
The soaring “Magnificent Seven” 4 stocks—seven top-performing tech stocks, most seen as likely AI winners—have helped the market to recover its 2022 bear market losses. (Figure 4.) At mid-year the other 496 members of the S&P 500 accounted for barely one-fourth of the year-to-date market gain.5
While the dominant AI model seems uncertain at this point, a consensus is building around Nvidia as the cornerstone company in this technological revolution. Mark Twain noted, during another California goldrush almost two centuries ago, “during a gold rush it’s a good time to be in the pick and shovel business.” As Qualcomm and Cisco were the shovel makers for the dot-com revolution, Nvidia is – for now – the shovel maker for AI, creating the chips and software that underly cutting edge AI models.
Nvidia’s graphics cards, which were originally designed for videogames, have turned out to be extremely efficient at the calculations central to AI models. Nvidia has demonstrated tremendous foresight, investing for years into AI-specific hardware as well as a robust software ecosystem supporting AI development, which combine to create an impressive moat. Nvidia is now the silicon dealer to leading-edge AI projects.6 That lead has only grown in recent years as Nvidia has made savvy acquisitions in architecture and networking to service enormous clients including Amazon, Google and Microsoft.
Nvidia’s massive ambitions, competence in securing its position, and validation by the markets breed overconfidence. Nvidia appeals on two separate dimensions to an insidiously intuitive story.
First, the AI boom is a textbook story of a Big Market Delusion.7 NVIDIA’s price reflects a certitude that its GPU architecture will continue to dominate, that it will not be displaced by new entrants or internal projects at other AI firms, and that current market expectations aren’t excessively optimistic.
A second hidden assumption is that Nvidia’s size makes it a safe play.8 As we’ve documented repeatedly, investors should be less enamored of “too big to fail” and more alert to the risk that the largest companies are often “too big to succeed.” Competitors and regulators love to take the largest companies down a notch. Customers stop rooting for an underdog when it becomes a top dog. The very competitive practices that allowed a company to become dominant are suddenly seen as anticompetitive and predatory.9
Unlike many in the dot-com bubble, Nvidia’s existing track record of sales and profits is already impressive. Its profits are up 32-fold since 2000, with per-share earnings and sales showing compounded annual growth of 16.3% and 14.9%, respectively, since 2000. Where Qualcomm and others demonstrated incredible promise with rapidly increasing profitability (Qualcomm’s per share profitability increased 7 times over in the 5 years leading up to its 2000 peak), Nvidia has an established long-term record.
Today, according to Bloomberg, Nvidia’s P/E sits at 110, half of of Cisco and Qualcomm at their 1999-2000 peaks. Even so, we believe that—like Cisco and Qualcomm during the dot-com bubble—Nvidia is a company with terrific long-term business prospects and its stock price may be a bubble.
When a bull market emerges from a powerful narrative propelling the stock prices of a narrow group of popular companies, those stocks may disappoint in the years to come. For example, following the peak of the tech bubble in March 2000, the average stock in the S&P 500 rose by 25% over the following two years while the cap-weighted index, dominated by popular tech stocks, declined by 21%.
The same pattern repeated in the aftermath of the Global Financial Crisis (GFC) and the Covid-induced value rout. After the March 2009 GFC low, the average stock in the S&P 500 beat the S&P index by 23% over the next two years. After value turned higher in September 2020, the average stock in the S&P 500 beat the index by over 15% before Chat GPT launched the latest surge in AI/tech stocks10.
The main beneficiaries of technological innovation are the customers of that innovation, not necessarily the innovators themselves.
”AI is the Real Deal; It’s Still a Bubble
Our point is NOT that AI is overrated. We joyfully agree that a new epoch is upon us. AI will change our world and our lives massively in the years ahead, just as the internet revolution fully met its lofty expectations during the dot-com bubble.
Markets overlook the fact that that the main beneficiaries of technological innovation are the customers of that innovation, not necessarily the innovators themselves. Extravagant opportunities quickly attract competition. In 2000, Palm was briefly worth more than General Motors. But, by 2003, the ubiquitous Palm Pilot was displaced by the Blackberry, which was in turn disrupted by the iPhone in 2008. Often, disruptors get disrupted. 11
Our point is that even correct narratives can take longer to play out than most investors expect. Investors count the upside uncertainty about that future growth as more likely than the downside. As a wit in the 2020 dot-com bubble noted at the time, tech stocks are discounting all future growth…and the hereafter.
Overconfident markets paradoxically transform brilliant future business prospects into even more brilliant current stock price levels. Nvidia is today’s exemplar of that genre: a great company priced beyond perfection.
Please read our disclosures concurrent with this publication:
https://www.researchaffiliates.com/legal/disclosures#investment-adviser-disclosure-and-disclaimers.
Endnotes
- We are indebted to Brad Cornell for his insightful observations, Forrest Henslee for his thorough research for this paper, and Philip Lawton for his thoughtful contribution as editor.
- Cornell and Damodaran observed, in their seminal paper on the topic, “There is nothing more exciting for a nascent business than the perceived presence of a big market for its products and services, and the allure is easy to understand. In the minds of entrepreneurs in these markets, big markets offer the promise of easily scalable revenues, which if coupled with profitability, can translate into large profits and high valuations.”
- Our top ten list involves judgement to define “tech” stocks. Qualcomm was and is in the Telecom sector; Amazon was and is in the Consumer Cyclicals sector, as a retailer. The competitive advantage for both was and is prowess in technology. Had these stocks not shown stellar growth in the successive 23 years, would we have thought to broaden our definition of “tech”? Probably not, which means that this is a list constructed with look-ahead bias, to make sure we didn’t miss subsequent winners. In other words, by making sure we include the biggest winners, we’re arguably understating the damage in the aftermath of the bursting tech bubble.
- We wonder how many of the current tech-stock advocates have seen the film. “The Magnificent Seven” doesn’t end well!
- The S&P 500 had 503 names in early 2023.
- https://www.bloomberg.com/news/features/2023-06-15/nvidia-s-ai-chips-power-chatgpt-and-multibillion-dollar-surge?
- Literally so much so that Cornell and Damodaran (2020) explicitly mention it when discussing the impact of uncertainty on valuations of the future.
- Cornell and Damodaran primarily though not exclusively focus on the investors in small start-ups with a simple model built on the overconfidence of serial entrepreneurs and venture capitalists.
- Taking a simple survey of the 10 largest companies in any given year, few maintain their standing a decade later. In fact, our research, documented in The Winner’s Curse, finds that in the US between 1952-2009, the leader in any given sector tended to underperform the average stock in its own sector by on average 3.2% over the next decade after reaching the peak. (Arnott and Wu, 2012.) The results replicate internationally. In fact, the performance profile of Top Dogs shows that subsequent 5-year underperformance is typically as impressive as the prior 5-year outperformance before reaching the peak. This lines up with well-studied phenomena of long-horizon mean reversion. Far from denoting a safe bet, Nvidia’s sheer size makes replicating past performance improbable. But perhaps this time is different?
- According to our research based on data from FactSet and Worldscope.
- In Clairvoyant Value and the Value Effect, we calculate a measure a ‘Clairvoyant Value’ as the discounted present value of a firm’s subsequent cashflows to arrive at an ex-post valuation for a firm and compare it with a firm’s given price at a time or a measure of a firm’s size using fundamentals as a proxy. In rough terms, we find that there’s a 50% correlation between relative valuation and subsequent relative growth; the market discerns winners and losers very, very well. But the market pays too much for the winners, and discounts the losers too much, so that the correlation between relative valuation and subsequent IRR (internal rate of return) is the opposite, roughly -50%. The consensus of millions, reflected in share prices, captures the collective wisdom of investors. Weighted by the size of their investment capital (small investors are not the price-setters in the capital markets), these investors are savvy and knowledgeable. Their consensus is remarkably accurate in gauging the direction of progress and innovation, and in distinguishing winning companies from losers. That said, as we note in Clairvoyant Value and the Value Effect, this consensus tends to over-extrapolate, expecting winners to keep winning and losers to keep losing. (Arnott, Li, and Sherrerd, “Clairvoyant Value and the Value Effect,” 2009).
References
Arnott, Robert D. and Wu, Lillian J., The Winners Curse: Too Big to Succeed? (June 20, 2012). Journal of Indexes, October 29, 2012, Available at SSRN:
https://ssrn.com/abstract=2088515 or
http://dx.doi.org/10.2139/ssrn.2088515. Accessed August 22, 2023.
Arnott, Robert D., Feifei Li, and Katrina F. Sherrerd. 2009. “Clairvoyant Value and the Value Effect.” The Journal of Portfolio Management, 35 (3) 12-26.
Cornell, Bradford, and Aswath Damodaran. 2020. “The Big Market Delusion: Valuation and Investment Implications.” Financial Analysts Journal, vol. 76, no. 2:15–25.
