Conditions now parallel the late 1990s as inflation expectations plunge, emerging market currencies tumble, relative valuations of emerging markets versus U.S. stocks and bonds hit extremes, and the growth-stock bull market roars ahead while value stocks lag behind.
The extreme parallels observed in both December 1998 and today are the drivers of future outperformance for the most hated asset classes as well as the drivers of disappointing return prospects for the most popular and comfortable markets.
In the 5 and 10 years following December 1998, assets other than U.S. and developed-market equities and U.S. notes and bonds outperformed 60/40 by an annualized 8.8% and 6.2%, respectively. Today, the potential for a 1999 redux is palpable. We believe the real return–diversifying asset classes could improve on a traditional 60/40 allocation by approximately 3.5% a year over the next decade.
In nearly four decades of contrarian investing, I’ve learned that the markets reward neither comfort seekers nor performance chasers for long. Instead, experience shows that the correct long-term strategy is to cautiously pivot into out-of-favor markets, averaging in over time, because it is not possible to know when the turn will come. Executing these uncomfortable trades, such as tilting deeper into value or into diversifiers at the times when they are most shunned, goes against human nature. We all want more of what has given us comfort and profit, and less of what has given us pain and loss. But, the capital markets do not reward comfort. Buying what’s unloved is, simply put, the most profitable way to invest, but it demands patience and staying power through the inevitable bouts of adversity.
1999 Redux?
Anyone with a passing familiarity of market history knows we have experienced this environment before. In fact, the late 1990s are strikingly similar along many dimensions, and they were far and away the most difficult years of my career; Jeremy Grantham—a superb contrarian investor—lost assets and credibility along with me and many other value investors. Julian Robertson, the legendary founder of Tiger Management, and godfather to legions of “tiger cubs” who subsequently launched their own hedge funds, famously closed his hedge fund in March 2000 at the exact end of the tech bubble!1
Such pain and angst is wasted if we don’t learn from it. We are now seeing conditions parallel the extremes of the late 1990s. The following parallels can serve as the drivers of future outperformance for the most hated asset classes, as well as a body blow to the return prospects for the most popular and comfortable markets:
- falling inflation expectations
- tumbling emerging market currencies
- extreme relative valuations for EM versus U.S. stocks and bonds
- protracted growth-stock bull market and underperforming value stocks
The last time all four of these were at, or near, historical extremes was in December 1998. After 1998, an equally weighted mix of inflation-fighting and diversifying assets2 outperformed a traditional U.S.-centric 60/40 portfolio by nearly 9.0% annualized over the subsequent 5 years and outpaced 60/40 in 11 of the next 12 years. That’s a lesson we remember.
The impact of these conditions is that, on the one hand, relative-return prospects for our inflation-hedging asset classes are now quite good. On the other hand, however, given their poor current yields, U.S. cap-weighted equities and nominal bonds are now offering poor real-return prospects.
Four Parallel Extremes
Let’s compare current conditions with those that presaged one of the best-ever performance spans for inflation-hedging and diversifying markets:
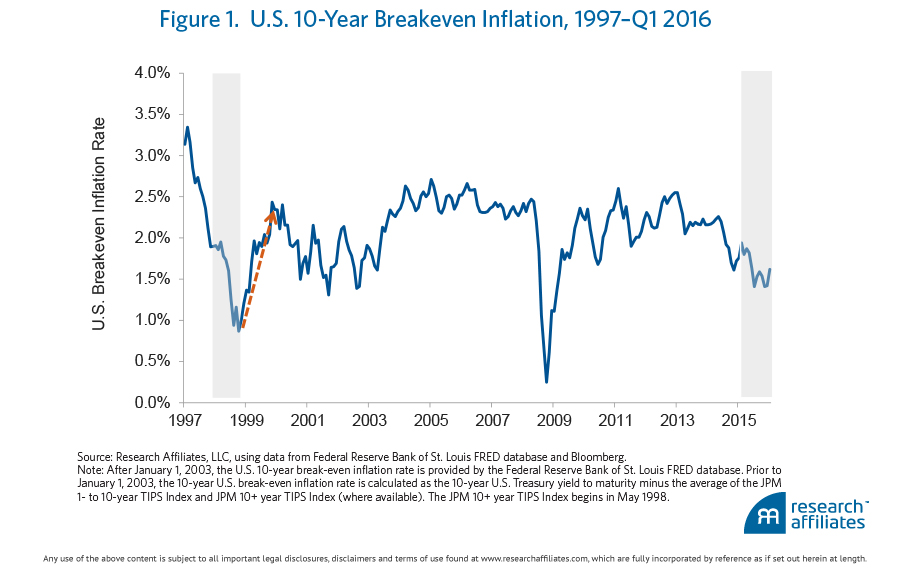
Falling inflation expectations. When inflation expectations fall much below 2%, they tend to snap back in reasonably short order. After inflation expectations hit a basement low of 0.9% in December 1998, within six months they had jumped to 2.0%. Over the past three years, 10-year inflation expectations have plummeted by over 50% from 2.6% in February 2013 to 1.2% in early February 2016. Both lows (December 1998 and February 2016) were well into the bottom decile of historical inflation expectations. But by the end of March 2016, over just a matter of weeks, inflation expectations rebounded to 1.6%, as Figure 1 shows. We expect that as the impact of the crash in oil prices begins to fade from headline inflation over the coming months, a reversion toward much higher inflation expectations is very likely.

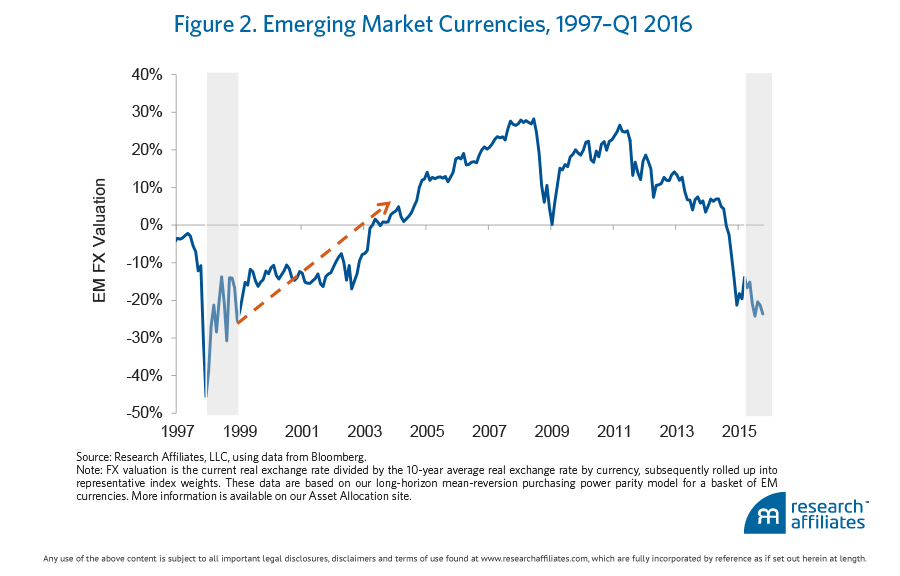
Tumbling emerging market currencies. When we measure emerging market (EM) currencies on a purchasing power parity (PPP) basis, we find they have only been this cheap once before—in 1998—when emerging markets were hit by the Asian currency crisis and the Russian default. Over the last four years, as seen in Figure 2, EM currency valuations have tumbled from a 20% premium to a 21% discount as of March 2016. Today, a basket of EM currencies is trading at bargain-basement levels deep into cheapest-quintile territory. Knock-on effects abound! Cheap EM currencies translate into an improvement in export competitiveness which in turn leads to positive earnings shocks in EM equities. These earnings surprises—still ignored by the punditry!—can be very supportive of local emerging stock and bond market returns, rewarding those who hold meaningful allocations to both asset classes.

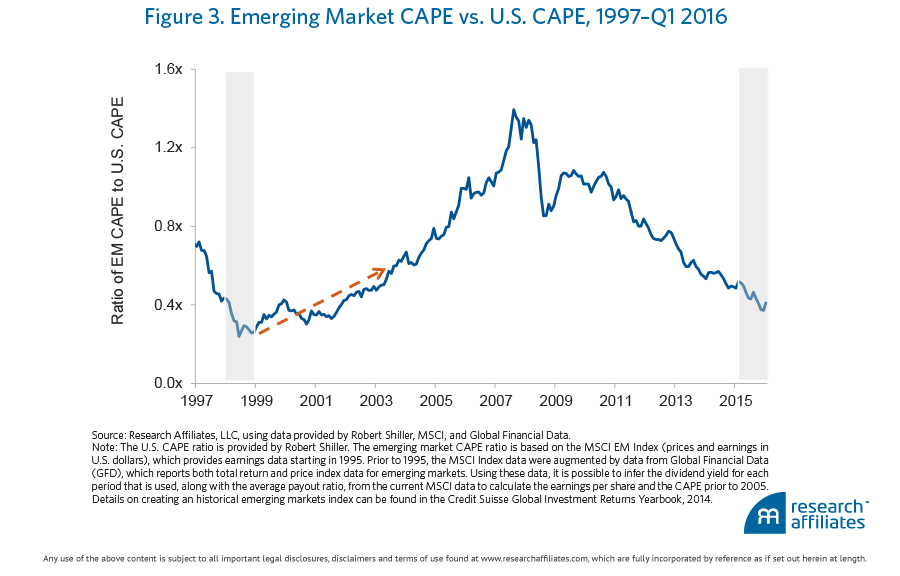
Extreme relative valuations for EM versus U.S. stocks and bonds. By August 1998, the Shiller cyclically adjusted price-to-earnings (P/E) ratio (or CAPE ratio) for emerging market stocks reached an all-time low of 8.5x, trading at a 70% discount to the S&P 500 Index. Today, as illustrated in Figure 3, the discount is 60% and the EM CAPE is 10.6x. For the 10-year period beginning in 1999, the U.S. stock market’s total return was essentially negative in both nominal and real terms. Compare that, however, to the 9% a year EM stocks earned over the same decade.3 The current seven-year U.S. bull-market rally has pushed U.S. valuations into the top decile historically, while a five-year bear market for EM stocks leaves them at valuations well into the bottom decile for the last quarter-century. These valuation levels historically set the stage for double-digit returns over the subsequent decade. Our forecast is for a more modest, but still quite welcome, 8% real return.4

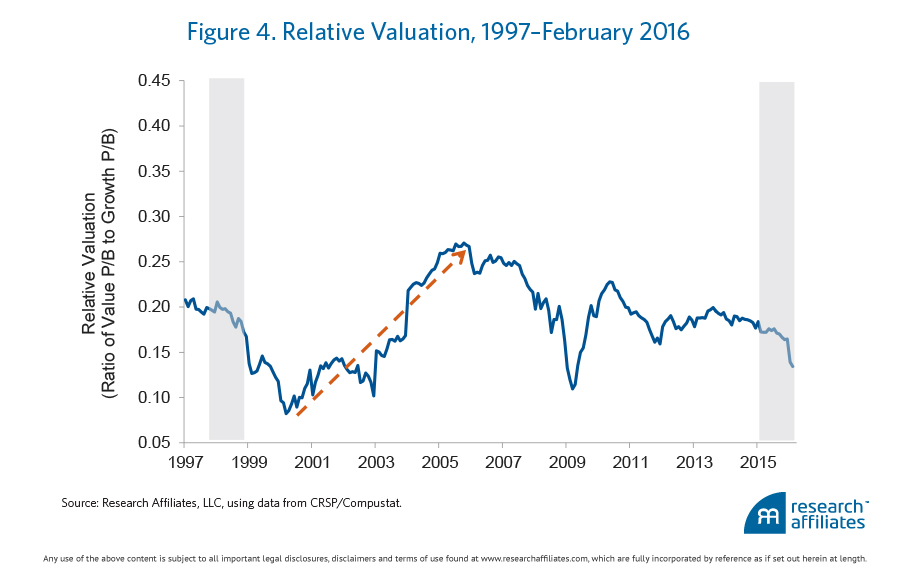
Protracted growth-stock bull market and underperforming value stocks. In the three-year trailing period ending March 31, 2016, value stocks underperformed growth stocks in the MSCI World Index by nearly 3%, hovering near the worst decile of relative performance for the two strategies since 1976. Consequently, as Figure 4 shows, value stocks are the cheapest now relative to growth stocks than at any time other than the tech bubble (1998–2001) and the global financial crisis (2008–2009). Historical experience shows that starting valuations similar to those we see today in value stocks have led to their prolonged, massive outperformance, making a strong argument for rebalancing into a deeper value tilt and avoiding the popular, bull-market growth stocks.

In the first quarter of 2016, each of the four trends reversed. Recent weeks have brought rebounds in inflation hedges, emerging market currencies, diversifying markets, and global value stocks relative to growth. Do these last few weeks represent “the turn”? Perhaps. The question, however, is irrelevant because the answer is simply impossible to know. But what we do know is that if we want peak exposure to these markets when the turn comes, we must begin to “average in” in the face of adversity.
We also know that these out-of-favor markets average a 3.0% yield premium versus a U.S.-centric 60/40 portfolio, which represents a powerful performance advantage to those who can patiently wait for mean reversion’s inevitable grip on the market. Once the market turns, history has shown the upswing will be fast and vigorous.
Real Potential
In the 5 and 10 years following December 1998, assets other than U.S. and developed-market equities and U.S. notes and bonds outperformed 60/40 by an annualized 8.8% and 6.2%, respectively. Developed value stocks also outperformed their growth counterparts by nearly 6% a year in the 5 years following December 1998. Are these markets poised to repeat this strong outperformance? Only time will tell, but we believe the potential is very real. Our view today is that real return–diversifying asset classes5 could improve on a traditional 60/40 allocation by approximately 3.5% a year over the next 10 years. Real return–oriented diversifiers and value strategies may not experience the same magnitude of outperformance as they did starting in 1999, but we’re confident they will outperform in the years to come. Now is the time to rotate into these markets.
Endnotes
- As CNN Money reported at the time: “In a letter to investors, Robertson, Tiger’s 67-year-old chief, wrote ‘As you have heard me say on many occasions, the key to Tiger’s success over the years has been a steady commitment to buying the best stocks and shorting the worst. In a rational environment, this strategy functions well. But in an irrational market, where earnings and price considerations take a back seat to mouse clicks and momentum, such logic, as we have learned, does not count for much.’ And so, a 20-year run of 20+% annual hedge fund returns came to a close.”
- We include six asset classes, each of which is only lightly correlated with mainstream stocks and bonds, and each of which is positively correlated with changes in U.S. inflation rates and inflation expectations: TIPs, commodities, and REITs, and the diversifying asset classes of high yield, emerging market local-currency bonds, and emerging market equities.
- The October 2015 Research Affiliates Fundamentals “Investing versus Flipping” discusses the historical relative valuation of U.S. equities and EM equities in greater detail.
- Our methodology and assumptions are explained on our Asset Allocation site.
- This is represented by an equally weighted basket of both traditional and stealth inflation-fighting asset classes, including high yield, commodities, REITs, EM local debt, and EM equities. More information is available on our Asset Allocation site.

