Active Dreams, RAFI Delivers: Active vs. RAFI Performance in Broadening and Narrowing Markets
During the S&P 500’s historic bull market following the global financial crisis (GFC), a small cohort of tech mega-caps has accounted for an oversized share of returns, creating a highly concentrated, narrow market.
Conventional wisdom holds that active managers should outperform in broad markets and struggle in narrow ones. But our research shows the median active manager lags their benchmarks in both environments.
Rather than rely on expensive active managers in the face of increased concentration, we believe investors should consider smart beta and systematic index approaches like the Research Affiliates Fundamental Index (RAFI).
RAFI seeks to combine the benefits of passive indexing with the alpha-generating qualities that active managers have been unable to provide in today’s concentrated market.
Since the recovery from the global financial crisis (GFC), the S&P 500 has delivered one of the strongest and longest bull markets in U.S. history, with 16.2% annualized returns.1 This exceptional run has been accompanied by rising market concentration, as mega-cap tech companies like Amazon, Microsoft, Alphabet, Tesla, Meta, Netflix, and Nvidia have become an increasingly dominant share of the index. Over the same period, active managers have struggled to keep pace, with the median U.S. large-cap active manager lagging the index by approximately 2.2% per year.2
Create your free account or log in to keep reading.
Register or Log in
That active managers are more likely to underperform when market leadership is consolidated in a handful of stocks is a conventional belief in investment management. Conversely, active managers are thought to add the most value during broadening markets, when returns are more evenly distributed across a wider array of companies. But does the data support this perception? Or is the narrative simply used to justify the persistence of active management despite a history of underperformance?
In this paper, we examine whether active manager performance truly depends on market breadth. We find that active managers tend to fall behind in broad and narrow markets alike, and that systematic alternatives—such as fundamental indexing—may offer a more reliable path to outperformance, especially in broad markets.
A Good Market
A common aphorism in investing is that broad markets are healthy markets. More winners reflect strong, sustainable underlying growth. Conversely, narrow markets with gains concentrated in a few standout stocks are more fragile, reliant on prevailing narratives, and vulnerable to exogenous shocks.
A related belief is that broad markets are stock pickers’ markets. Broader markets expand the opportunity set, shifting the portfolio from a few thematic bets to a collection of diverse, differentiated positions.3 Stock-picking skill between relative winners differentiates active managers. Narrow markets, by contrast, can be more challenging: thematic beta is ascendant and excess returns are achievable by crowding into a small cohort of trending names. Diversification doesn’t feel like a free lunch when outsized gains accrue to those willing to double down on popular, concentrated bets. When the Magnificent Seven accounted for more than half of all S&P 500 returns from December 2022 through June 2025, that case seems plausible.4
Diversification doesn’t feel like a free lunch when outsized gains accrue to those willing to double down on concentrated bets.
”The more technical intuition underlying this is Richard Grinold’s Fundamental Law of Active Management.5 A manager’s information ratio (IR)—their alpha, or excess return per unit of risk—is a function of their information coefficient (IC), or stock-picking skill, multiplied by the square root of breadth, or the number of independent decisions. Did the manager beat the market without extreme luck or undue risk? The formula provides an answer.
\( IR = IC \times \sqrt{\text{Breadth}} \)
As market breadth increases, managers’ ability to identify attractive firms through skill, including fundamental analysis, is rewarded rather than excess returns accruing to those who have embraced a singular theme. In effect, the skilled investor moves from relying on a few fortunate hands to playing many rounds, just like the house, so their edge compounds over time.
A Broad Market
Market breadth is a rough proxy for the distribution of economic growth across companies and can be captured by effective N (number of stocks), concentration percentage, or cross-sectional stock dispersion (the difference in performance among companies)—in short, how many individual stocks drive the whole market.
A particularly simple and clean breadth metric is the excess return of the average stock over that of the total market. We use 12-month rolling excess returns and define a broadening regime as one in which the equal-weighted index outperforms its cap-weighted peer and a narrowing regime as the inverse. This results in an almost even split between broad and narrow markets in our U.S., International, and Emerging Markets (EM) portfolios. (Our reference indices largely align with Morningstar’s category benchmarks: the S&P 500 for the U.S., MSCI World ex US for International, and MSCI EM for EM.)6
Assuming no skill in picking a manager, we use the median active manager’s performance in Morningstar’s U.S., International, and EM universes. Morningstar disaggregates performance by style box among Growth, Value, and Blend in the U.S. and International categories and offers only a Blend designation for EM.
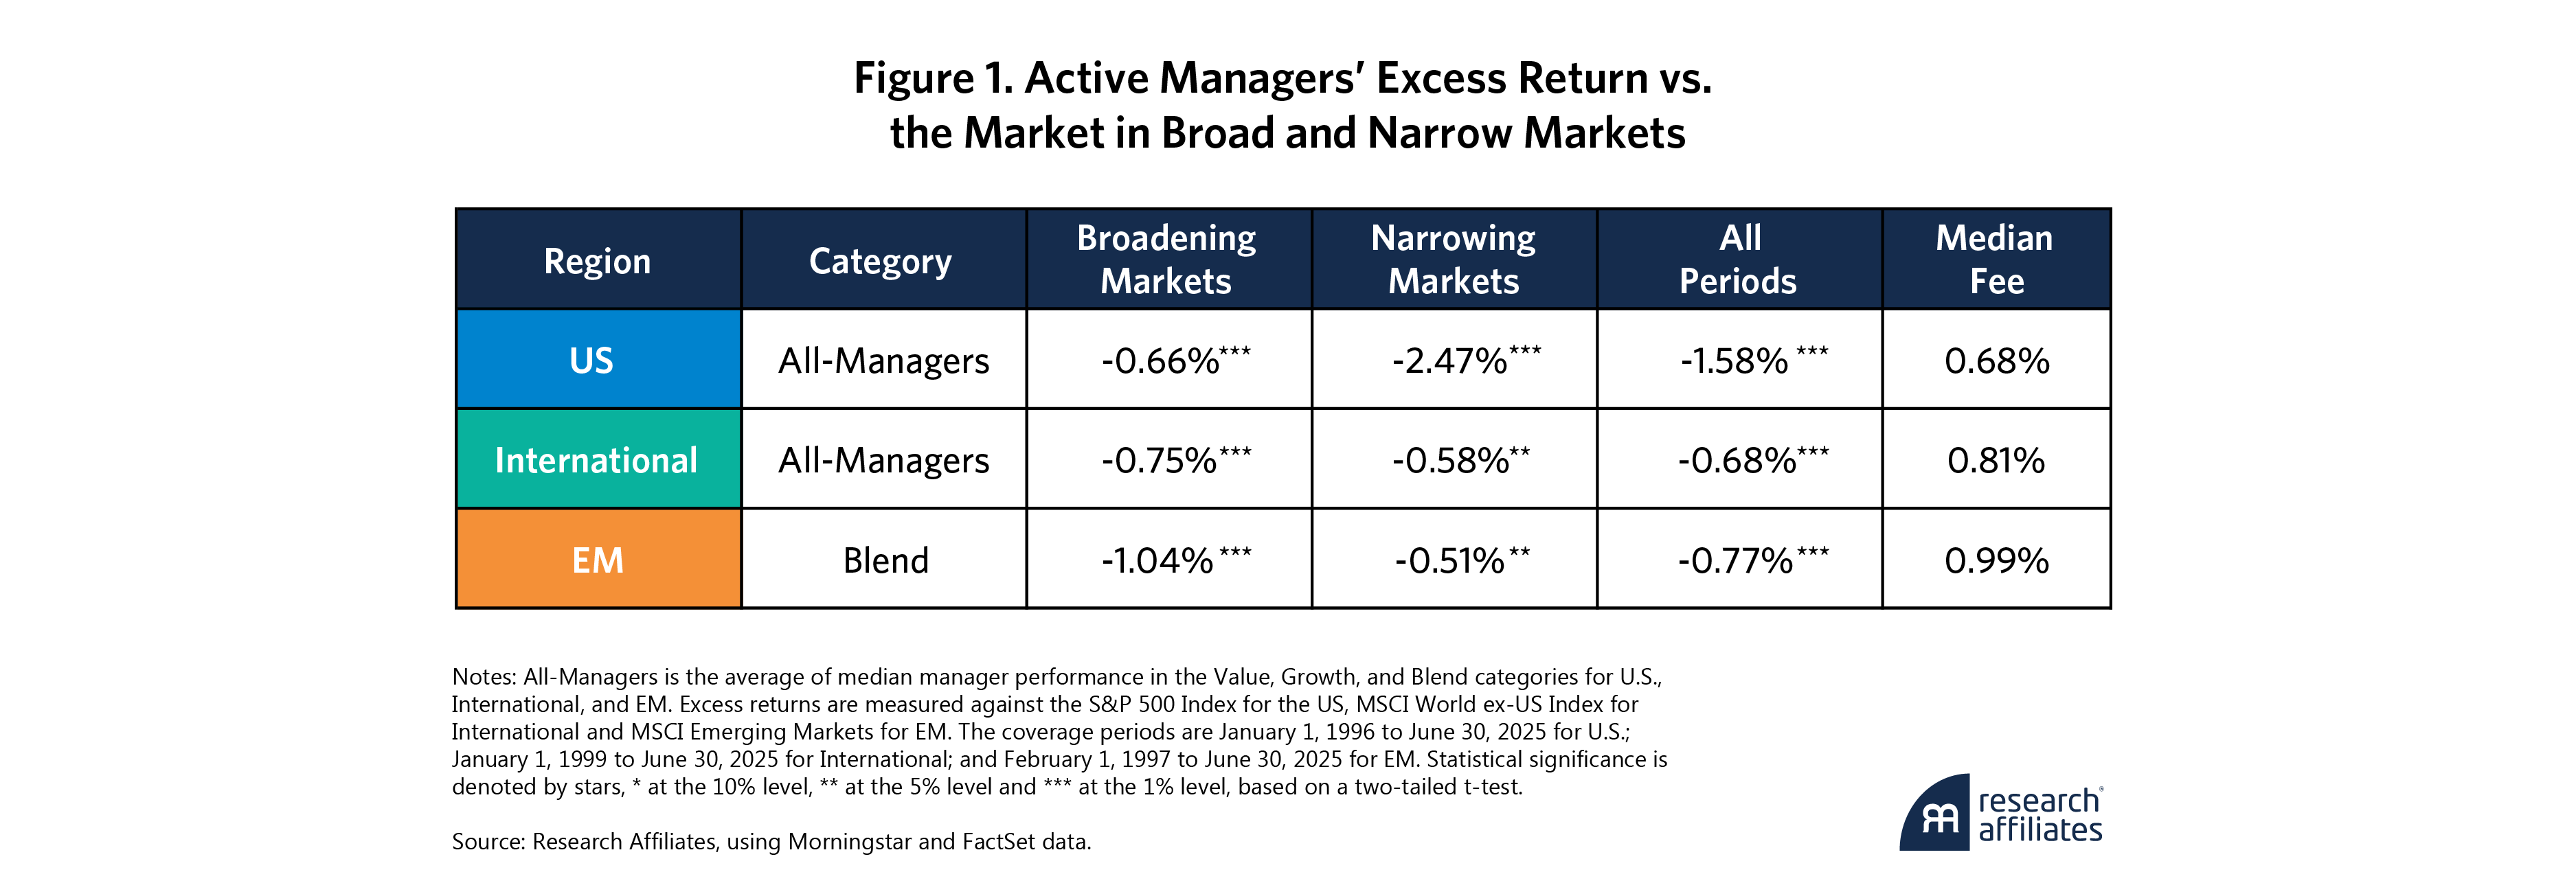
Figure 1 shows active managers are justified in their claim that recent markets have been particularly difficult—to a degree. Breadth and performance demonstrate the clearest relationship in the U.S. Averaged across the Value, Blend, and Growth categories (All-Managers), the median active manager lags the benchmark by 247 basis points (bps) over 12-month periods in narrowing markets. Even in presumably more favorable broadening markets, the median active manager still trails the benchmark by 66 bps on average.
Our international portfolio’s results are more mixed on the breadth-performance connection. The median active manager underperforms by 58 bps and 75 bps in narrowing and broadening markets, respectively. EM reveals a surprising twist: Contrary to our expectations, the median Blend manager does better in narrowing regimes.7 Unfortunately, that still adds up to 51 bps of underperformance over 12-month intervals.
There are indications of a relationship between regime breadth and performance, but that almost misses the point. Why pay active fees for such paltry returns? It’s also not lost on us that the median active manager fee is greater than the amount of underperformance for all periods in the International and EM categories. There’s a simple way for active managers to lessen that underperformance gap!
Maybe We Need a Little Style?
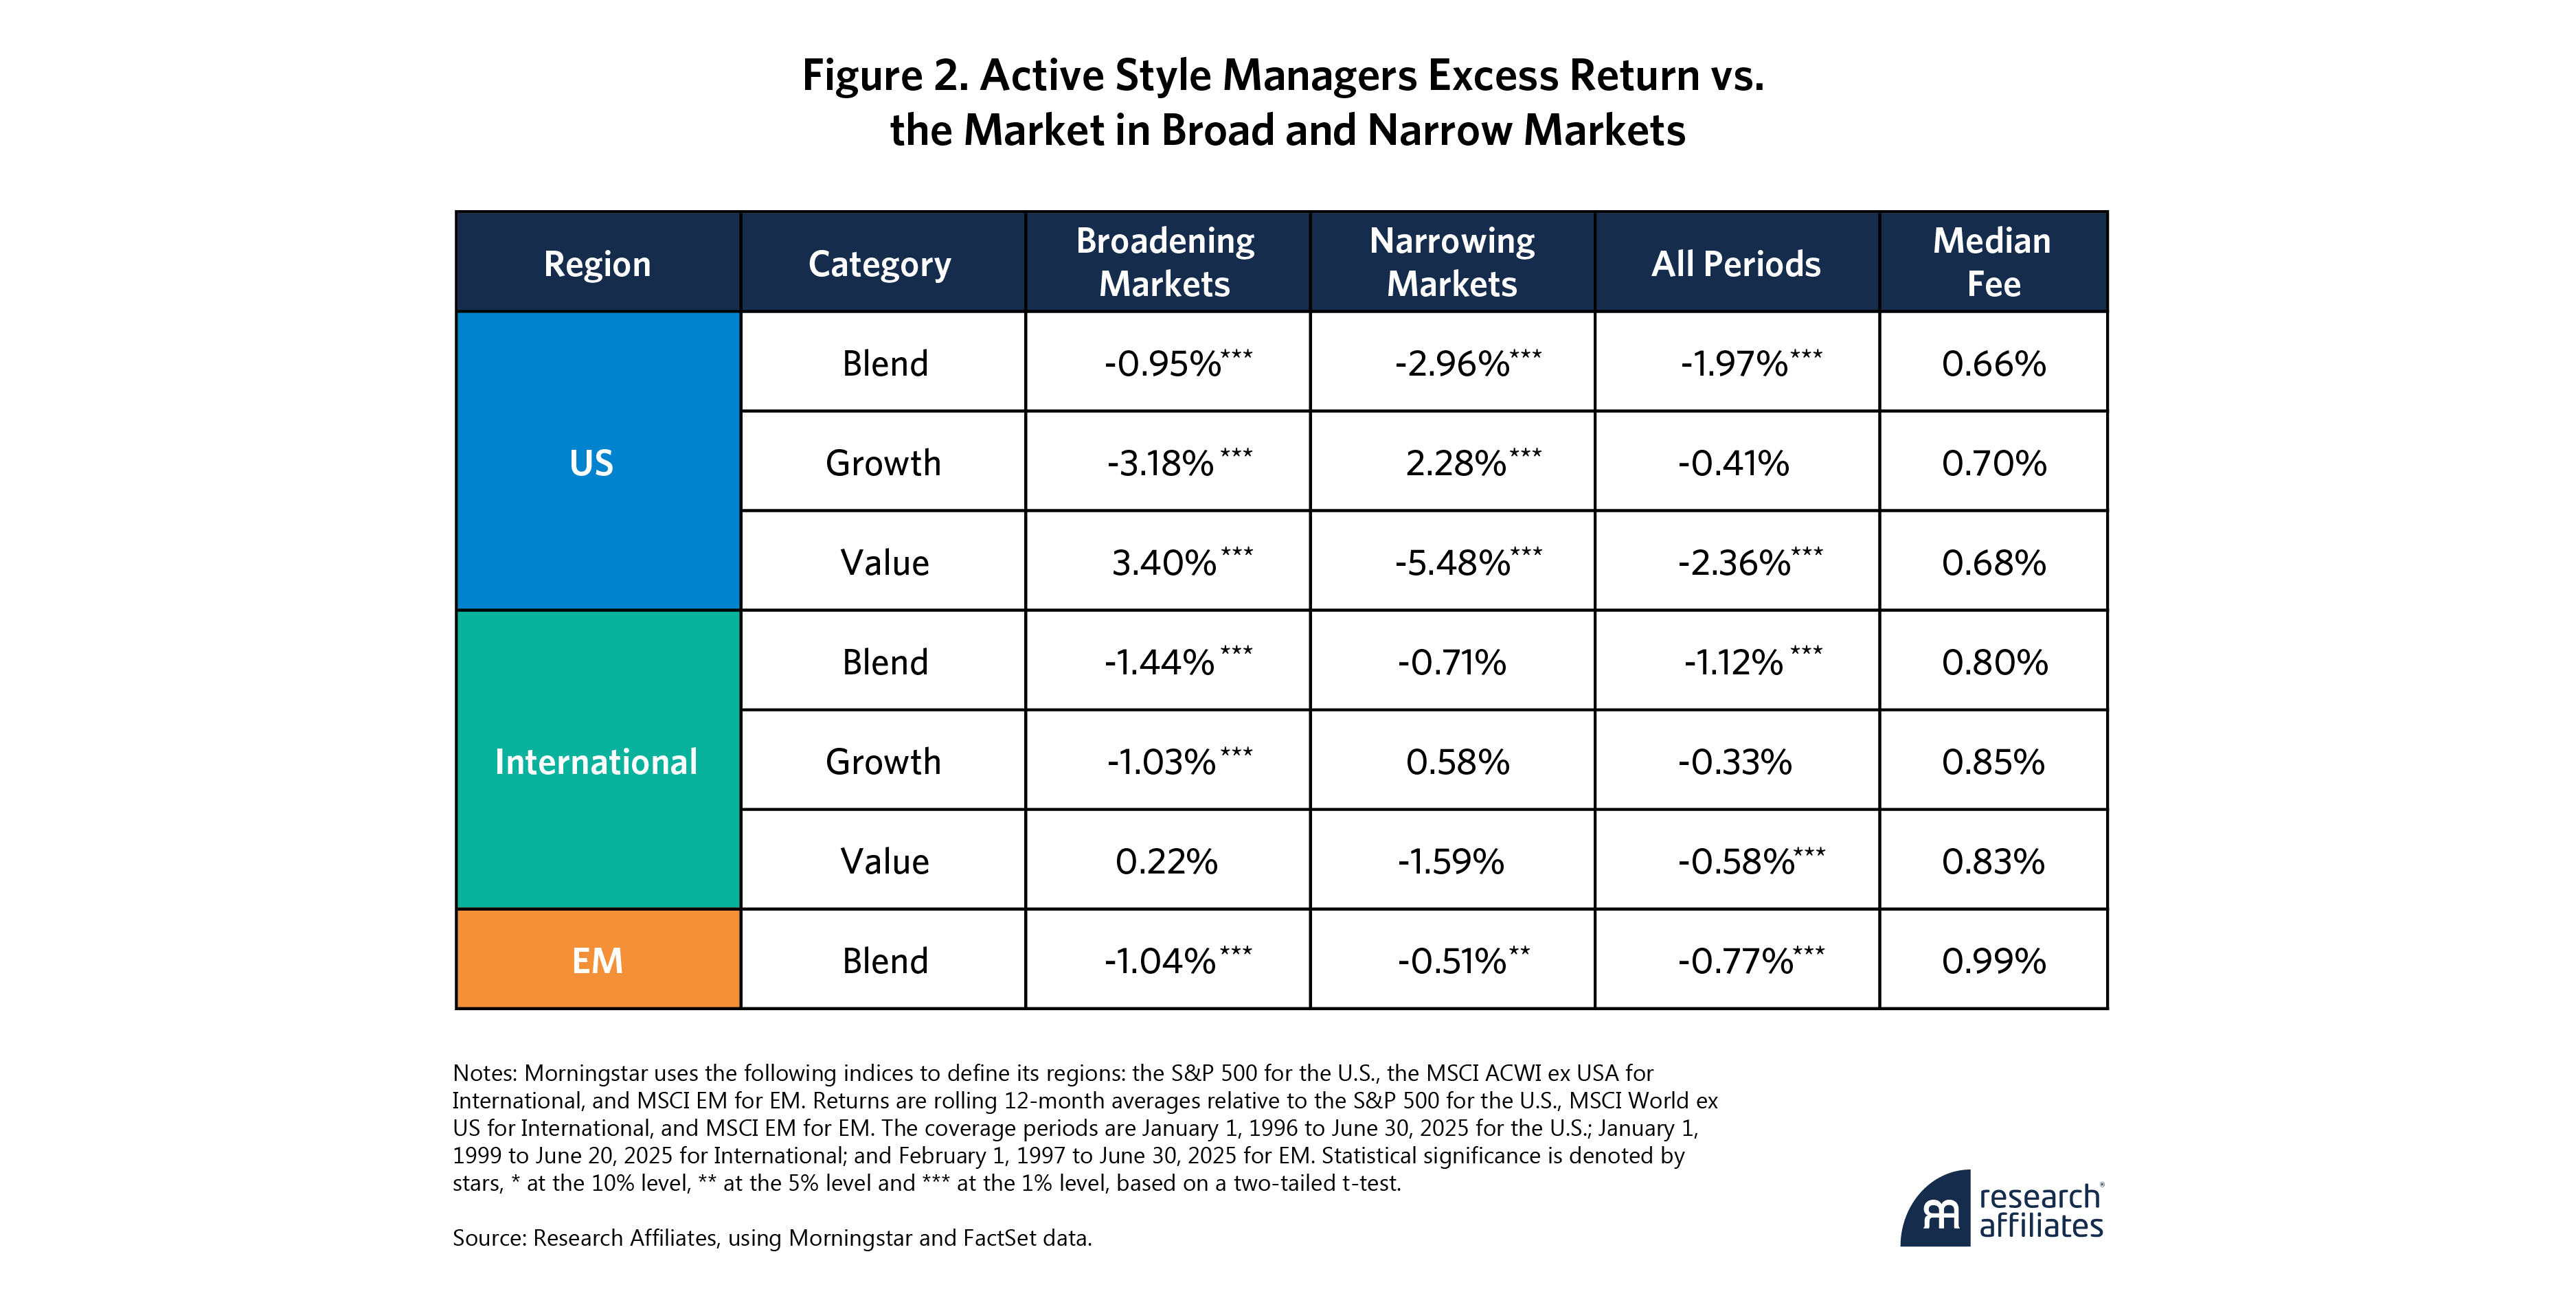
Here’s where things get interesting. When we distinguish between Growth and Value managers, the real winners and losers come into focus. Figure 2 shows Growth managers consistently outperform in narrowing markets, delivering average excess returns of 228 bps in the U.S. and 58 bps in International. Meanwhile, Value managers shine in broadening markets, outperforming by 340 bps on average in the U.S. and 22 bps in International over our 12-month spans. Both types of managers suffer during unfavorable regimes.
This makes intuitive sense. Growth managers thrive when investors follow popular narratives and generate momentum for a small set of leaders.8 Value managers benefit from widening markets as overbought companies and sectors are repriced and competitive dynamics and differentiation reassert themselves. Style should set expectations.
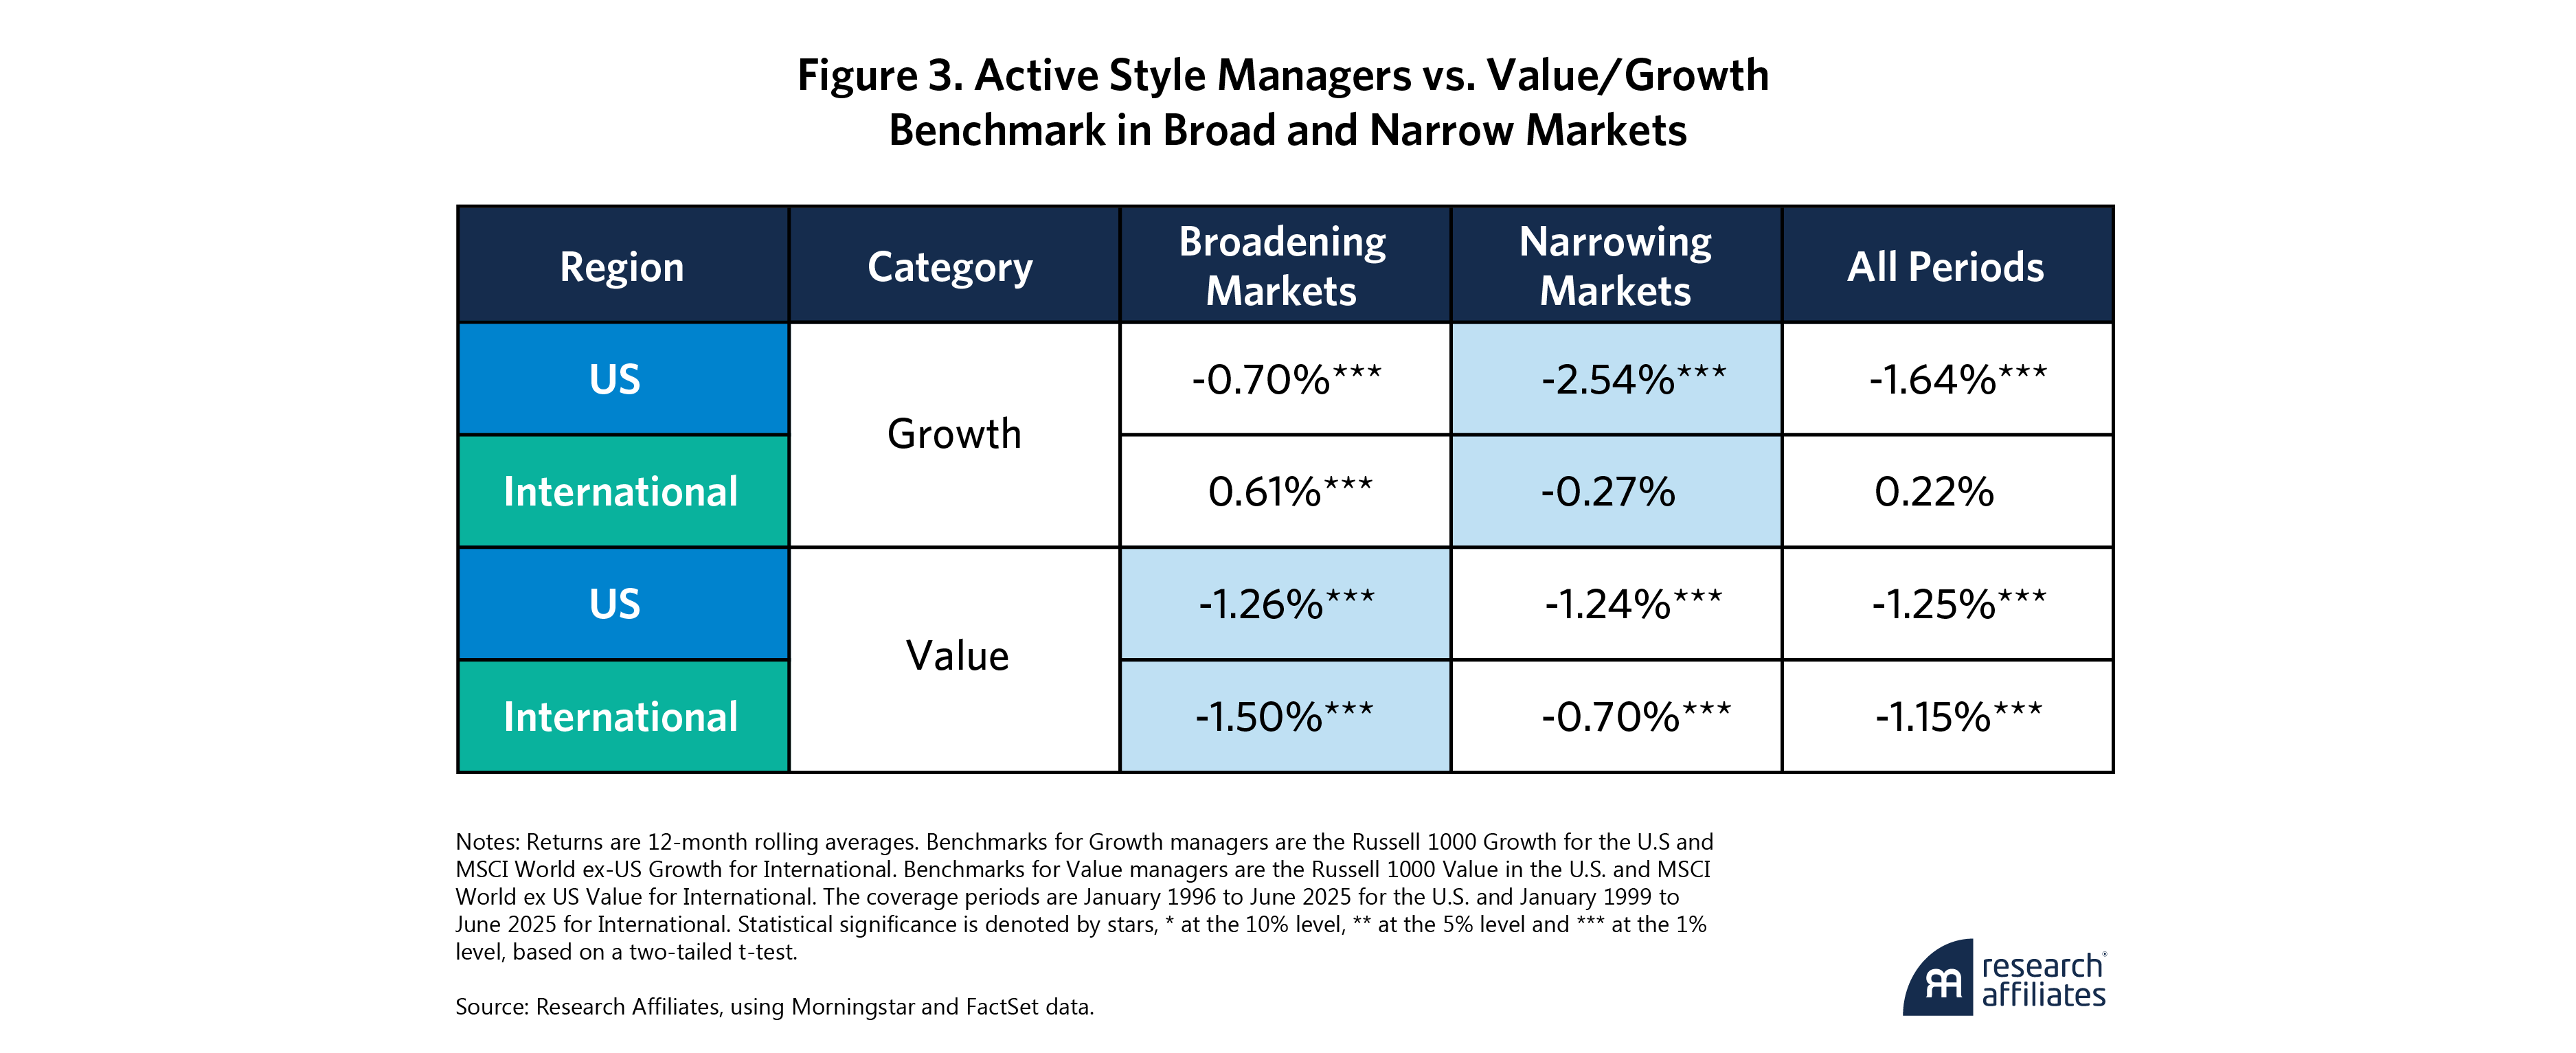
If active Value managers do better in broadening regimes and Growth managers in narrowing ones, a natural question arises: If an investor could accurately time these style shifts, would the potential outperformance justify active management’s costs? In short, no. Figure 3 compares the excess returns of active Value and Growth managers relative to their benchmarks. Despite favorable conditions, active managers often underperform even simple style benchmarks precisely when they should be at an advantage.
Despite favorable conditions, active managers often underperform even simple style benchmarks precisely when they should be at an advantage.
”So What Now?
There is, of course, an increasingly popular alternative to struggling active managers: smart beta index investing. Rules-based, systematic strategies like the RAFI Fundamental Index are both intuitive by design and inexpensive. Consequently, they are easier to evaluate for inclusion in an investor’s portfolio than complicated questions about active manager alpha.
A disciplined counterpoint to simple cap-weighted benchmarks and active management, RAFI weights companies based on sales, cash flow, dividends, book value and other fundamental measures of their economic footprint rather than market price. By decoupling from investor sentiment, RAFI mitigates exposure to overpriced securities, avoids momentum-driven distortions, and leverages a natural “buy low, sell high” philosophy. RAFI retains the defining features of passive investing (diversification, low cost, high capacity, and full transparency) while capturing the value and rebalancing premiums that active managers have historically failed to deliver.
By decoupling from investor sentiment, RAFI mitigates exposure to overpriced securities, avoids momentum-driven distortions, and leverages a natural ‘buy low, sell high’ philosophy.
”RAFI retains the defining features of passive investing—diversification, low cost, high capacity, and full transparency—while capturing the value and rebalancing premiums that active managers have historically failed to deliver.
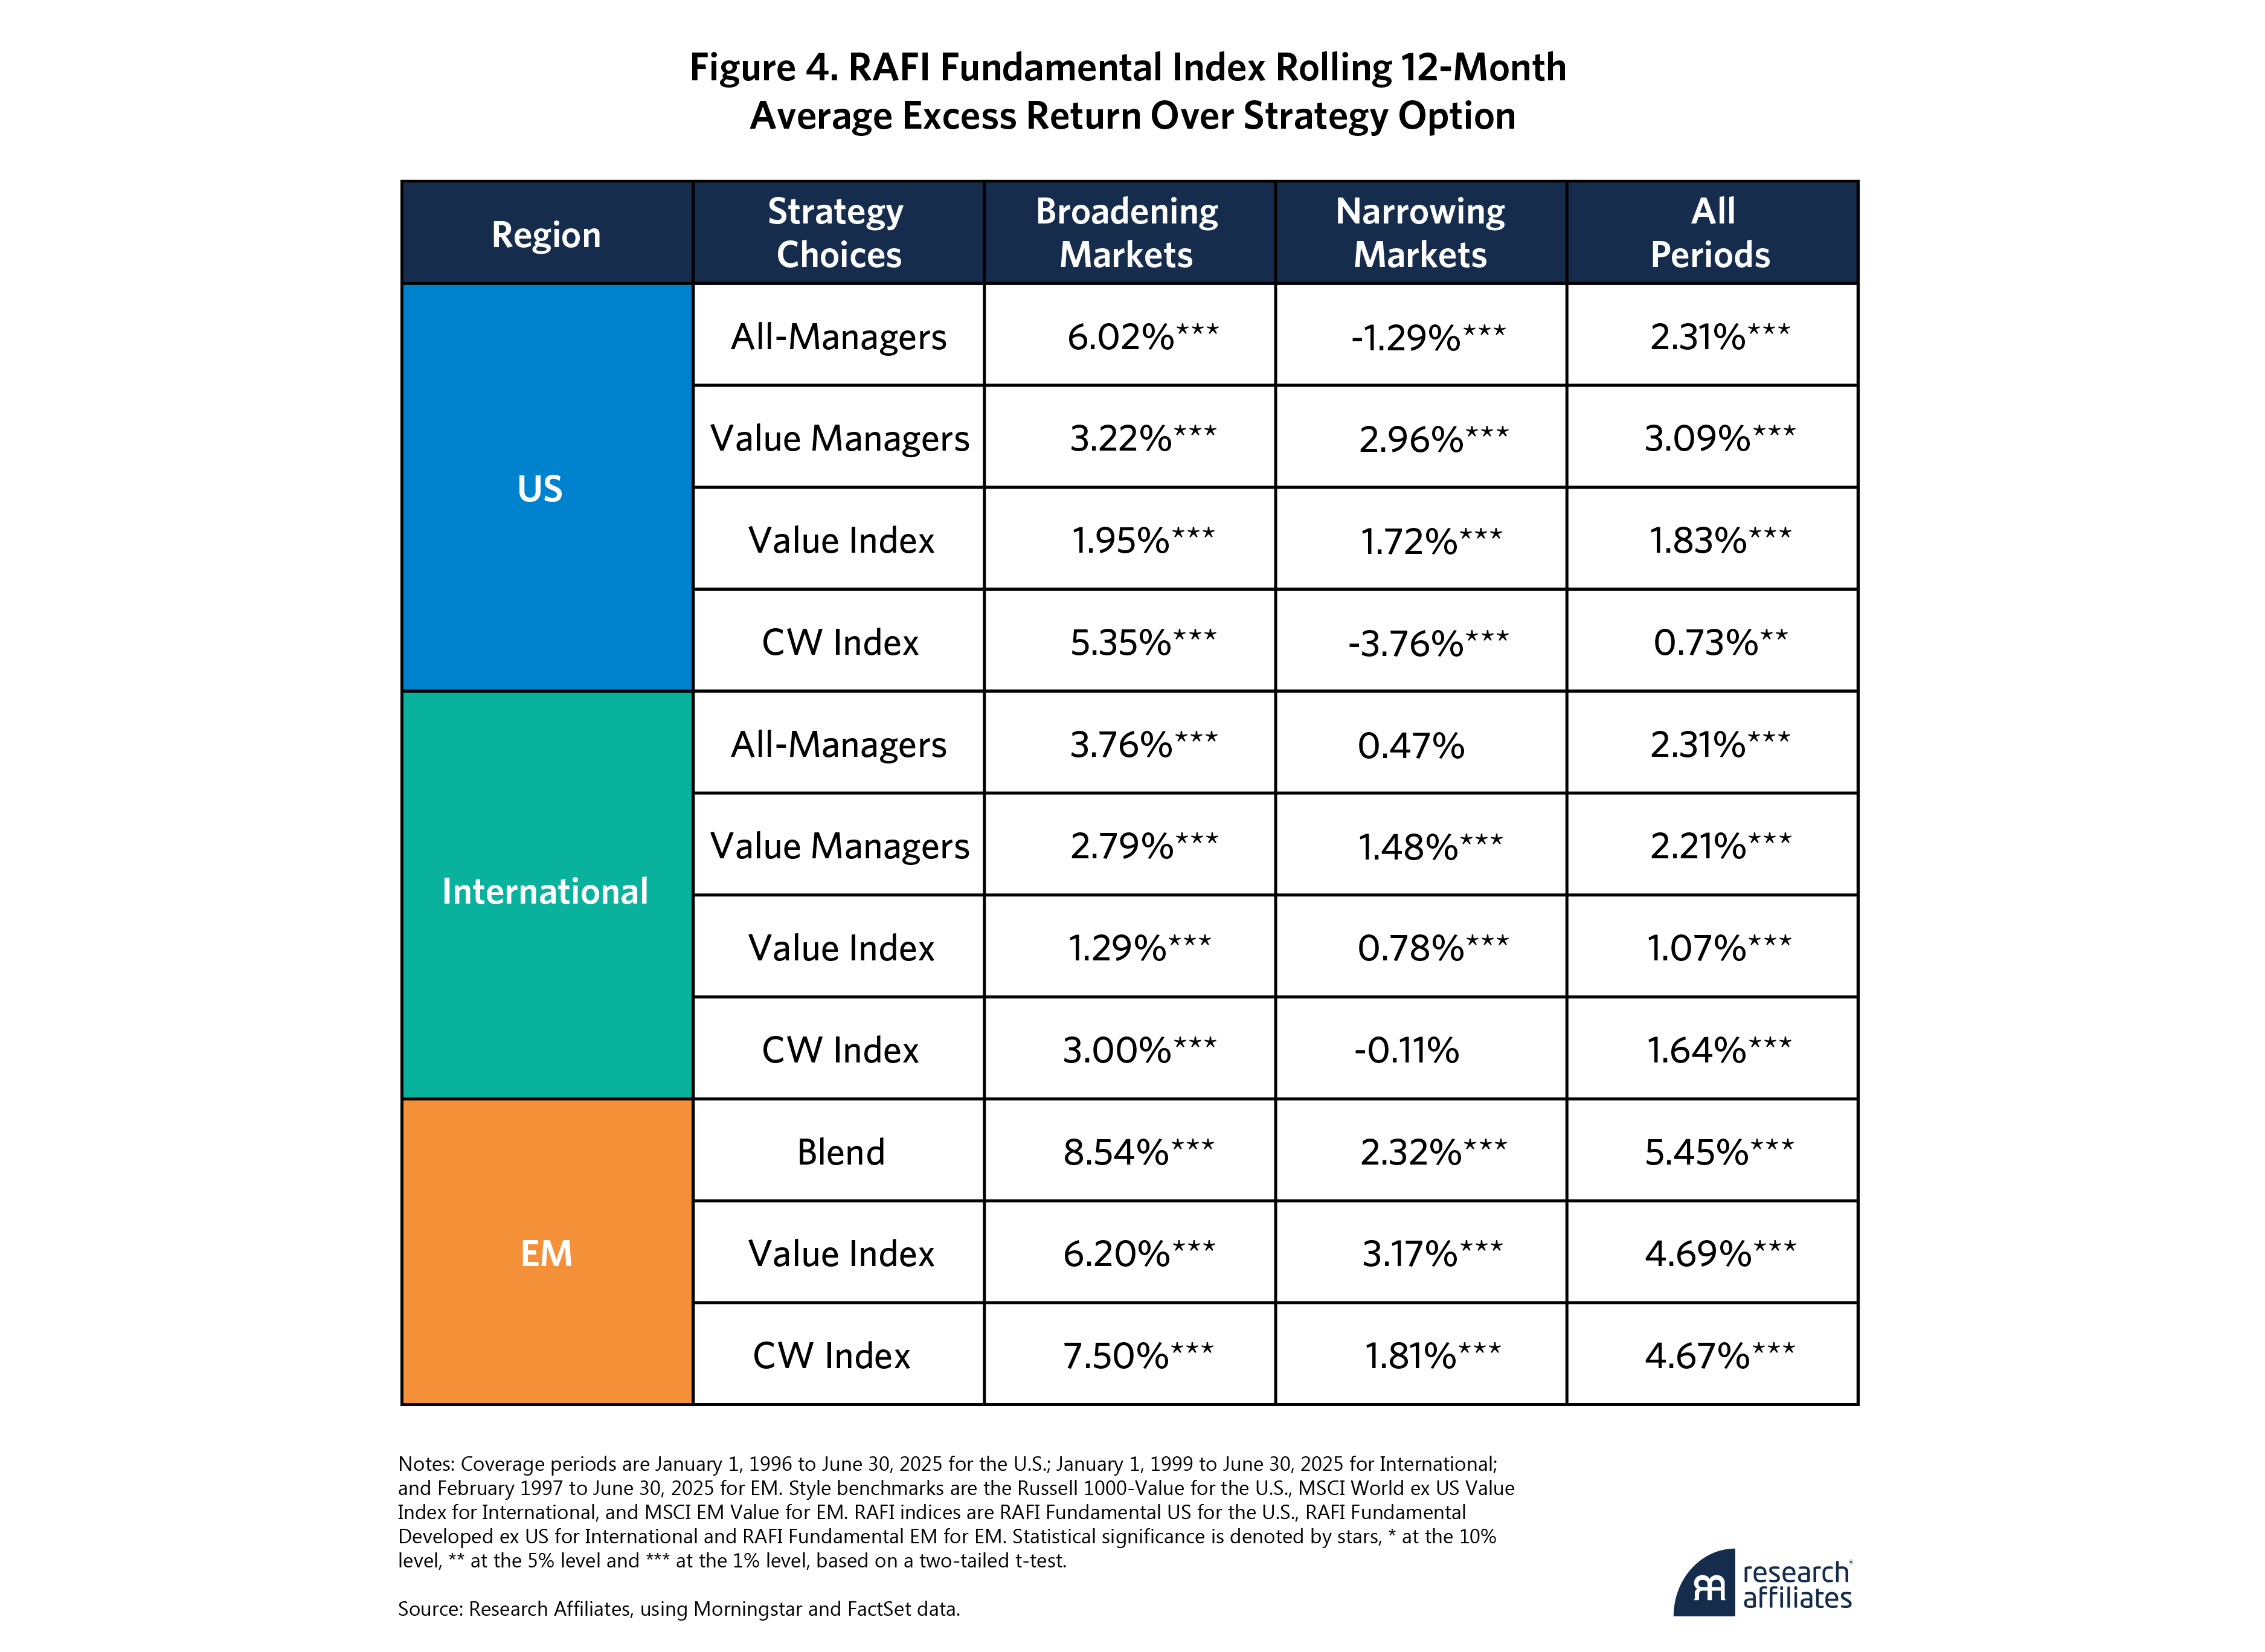
”Figure 4 demonstrates the relative performance of a systematic approach such as RAFI over other investment options. We apply a hypothetical fee to our RAFI indices, to create an apples-to-apples comparison with active managers9, (and it’s again worth noting that the fees for RAFI are approximately 60% lower across all categories, compared with the median active manager!). In broad markets in the U.S., RAFI beats the average manager by 231 bps over all 12-month intervals. RAFI’s construction, linked to underlying company fundamentals, creates a dynamic value exposure that allows RAFI to vastly outpace the average active manager by 602 bps in the U.S. in broadening markets while only lagging by 129 bps in narrowing ones.
While a broad market portfolio, arguably RAFI’s dynamic value exposure makes Value managers or indices a better benchmark for comparison. Well, Value managers underperform RAFI by 309 bps over all 12-month periods. The value index (Russell 1000-Value) is more competitive, only trailing RAFI by 183 bps on average. RAFI’s dynamic tilt to value generates outperformance in both broadening and narrowing markets to these alternative value strategies.
The S&P 500 (CW Index for US) comparison demonstrates the importance of market breadth. RAFI outperforms by 5.35 bps on average during broadening markets but falls behind by 376 bps in narrowing markets. Still, on average, from January 1996 to June 2025, RAFI outpaces the S&P 500 by 73 bps over 12-month spans.
International evidence only solidifies the case for RAFI’s simple, systematic approach over active management teams in all market regimes. Whether compared to all managers or value managers, RAFI handily beats both, running ahead by 231 bps and 221 bps, in International markets. In difficult, narrow markets, RAFI adds 148 bps over Value managers on average and 78 bps over the MSCI World ex US Value Index. Against the market-cap index, RAFI averages 300 bps in excess returns during broadening regimes while subtracting a scant 11 bps during narrowing markets. Combined, RAFI’s “all-weather” versatility yields 164 bps in gains on average over all 12-month spans between 1999 to 2025.
EM offers more of the same—a lot more. RAFI beats Blend and Value managers and even the cap-weighted index in broadening markets. In narrowing markets, it generates 232 bps, 317 bps, and 181 bps of outperformance in Blend, Value, and cap-weighted indices, respectively. As expected, it handily delivers in broad markets, dominating its easy alternatives in an inexpensive and elegant package. In all types of markets and all types of styles, RAFI, among other systematic index approaches, may be a better default option than active management.
Right Point, Wrong Answer
Active managers may be on to something. Narrow markets are difficult for those betting on long-term mean reversion. Obviously. The pain pays for the premium. But that’s not enough to justify active bets in investors’ portfolios when active managers can’t keep up with simple style benchmarks.
That’s especially true when cheaper alternatives have generated more than competitive returns across favorable and unfavorable regimes. Given the difficulty of repeatedly picking the right manager for the right moment, inexpensive, systematic approaches should be the default homebase for investors. With a long track record, simple rules, and a strong economic foundation, our research shows that RAFI should be that smart beta index homebase.
Yes, active managers have a point. They may not have a solution.
Please read our disclosures concurrent with this publication: https://www.researchaffiliates.com/legal/disclosures#investment-adviser-disclosure-and-disclaimers.


