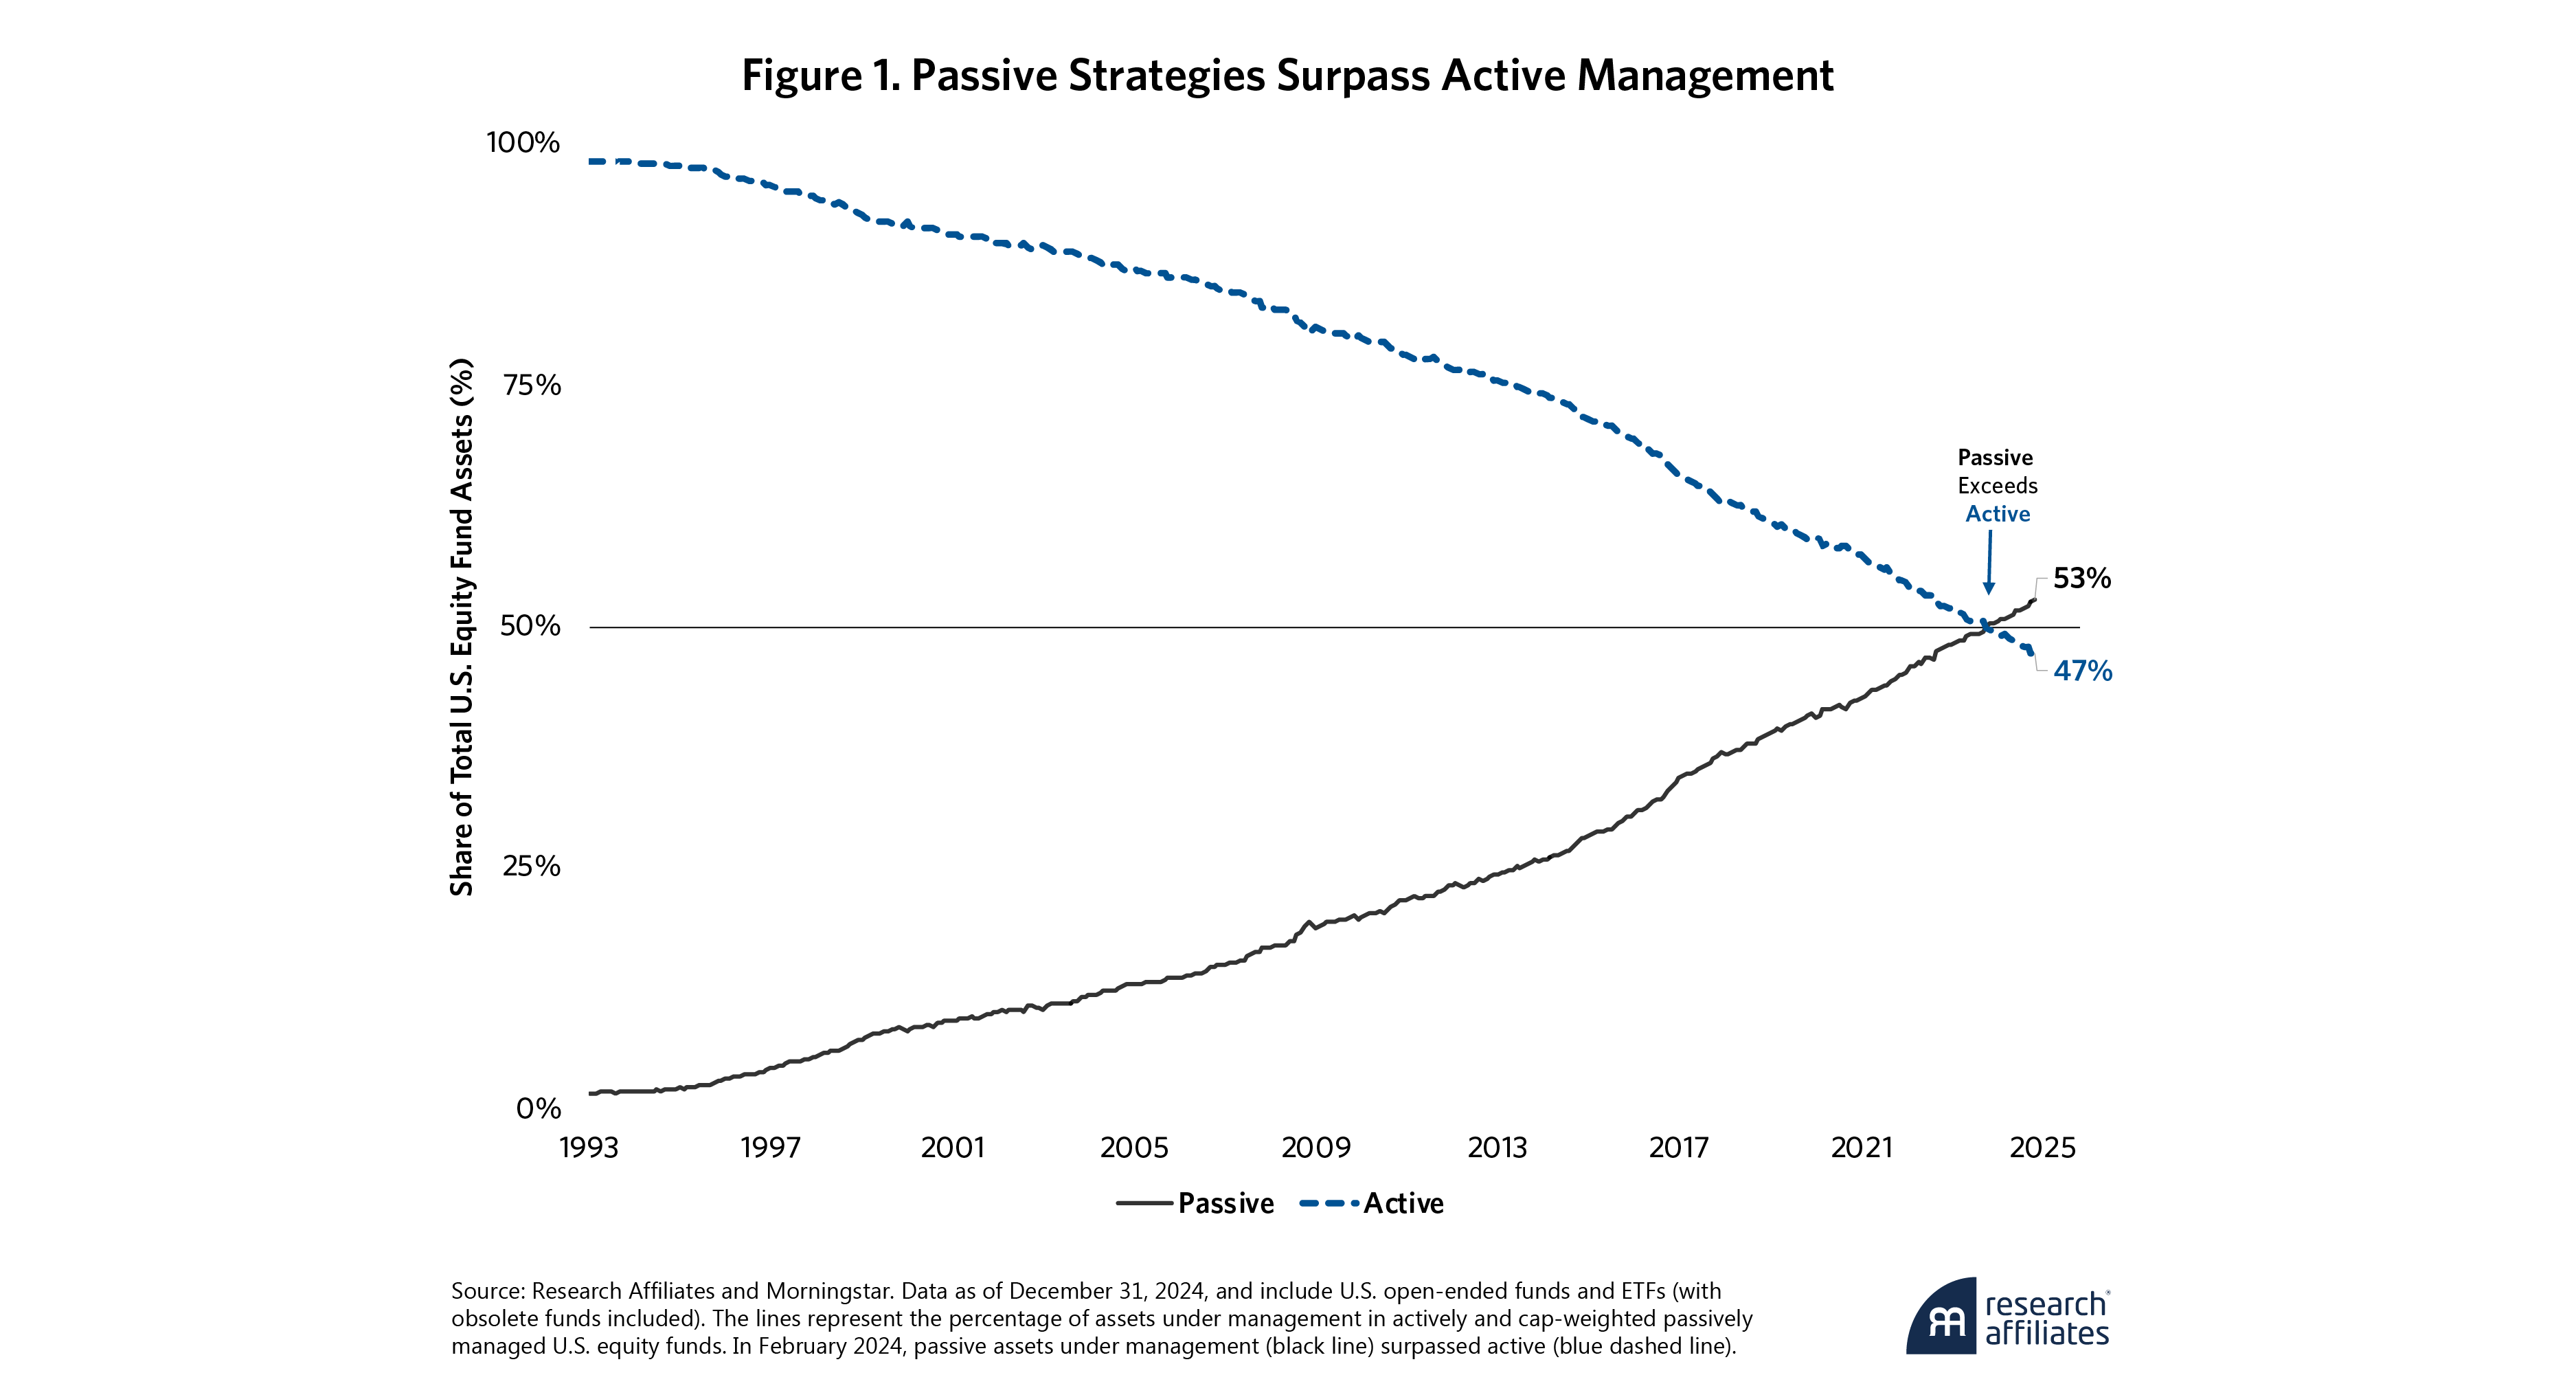
Passive capitalization-weighted index funds now surpass active management in aggregate investor allocations.
Passive dominance causes unrelated stocks to move synchronously, undermining diversification and potentially increasing systemic risk.
Flows into passive strategies exacerbate momentum-driven price distortions.
Rebalancing at the stock level to non-price-based anchor weights may mitigate these distortions and enhance long-term returns.
This article is adapted from the longer article Passive Aggressive posted to SSRN.
The genesis of passive investing can be traced to the seminal insight of Sharpe (1964): when stock prices fully reflect all information, investors should hold the market portfolio. Niche passive products were launched in the early 1970s. Niche became mainstream with the launch of the Vanguard 500 in 1976 by Jack Bogle, making a passive market capitalization–weighted product accessible to retail investors.
Create your free account or log in to keep reading.
Register or Log in
By “passive investing” we mean cap-weighted index strategies. Despite the existence of many other forms of rules-based systematic investing, our analysis concentrates on the dominant market-cap indices tracked by the largest mutual funds, ETFs, and related derivatives.
Passive products now dominate investors’ portfolios. But with dominance comes unintended consequences. The rise of passive index products—driven by low fees, simplicity, broad access to diversification, and strong performance—has reshaped the stock market. The trillions flowing into market cap–weighted products has increased comovement of stocks in the same index, diminished diversification, and eroded price discovery.
With dominance comes unintended consequences.
”Passive products are indifferent to fundamental information, including sales growth, expected earnings, innovation activities, or competitive position within an industry. They allocate based solely upon market price and recent momentum. We explore the growing risks behind the passive boom—and what investors can do about them.1
Gravitational Pull of Passive
Two considerations have understandably driven investors to increasingly allocate to passive products: (1) the failure of active management to consistently outperform cap-weighted indices and (2) substantially lower fees for index funds.
According to an S&P report, only one-third of active U.S. equity managers outperformed their benchmarks and in no category did more than half outperform their benchmarks over the past 15 years. In regard to fees, a Schwab report has documented 0.09% asset-weighted average fees for passive funds, significantly below 0.64% for active funds.
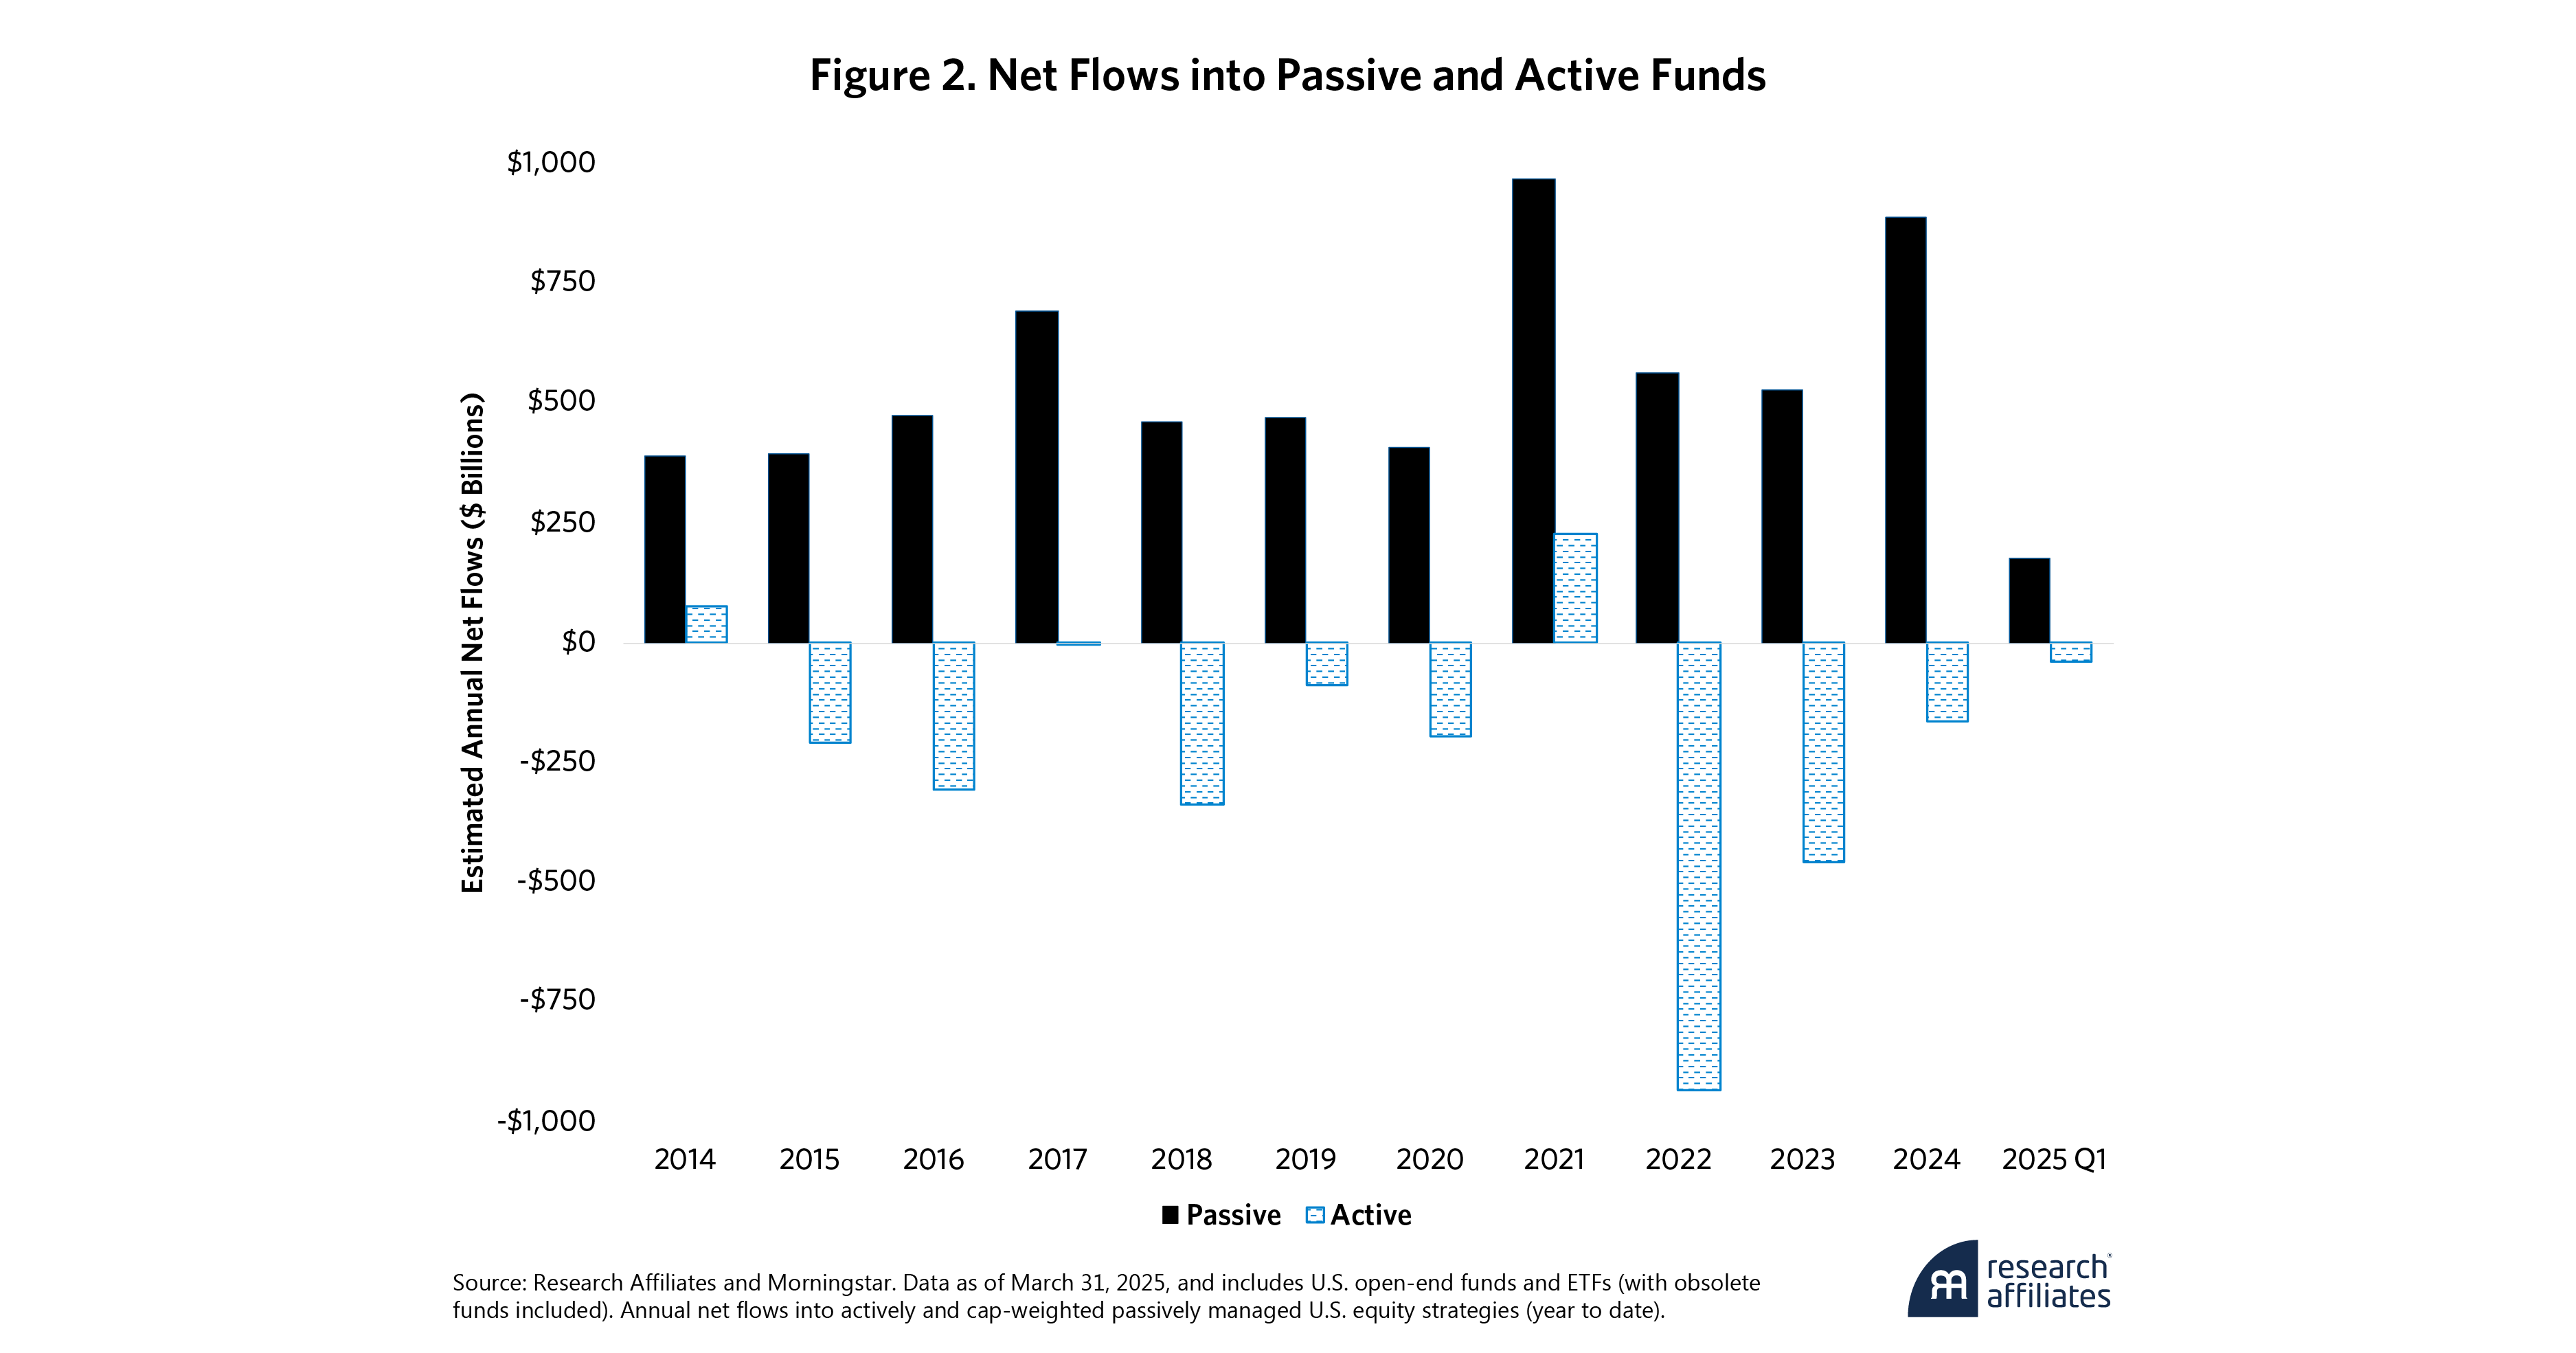
Passive investing now dominates capital allocation, as is evident in Figure 1. Further, there is good reason to believe that the passive share is far higher because many institutional investors are “closet indexers.”2 Passive funds have absorbed consistent, large-scale inflows across market cycles while active funds have experienced persistent net redemptions, as shown in Figure 2. According to an ETF Global Insights report, global ETF net inflows reached nearly $2 trillion in 2024, and the Financial Times has reported that, globally, investors withdrew a record $450 billion from actively managed funds in 2024, surpassing the previous year's outflow of $413 billion. The scale and persistence of this divergence demonstrates the structural reallocation of investor capital toward passive index products.
While passive products allow investors to get transparent diversified portfolios at low cost, the trend of increasing passive inflows has come with unintended consequences. Unless markets are perfectly efficient, passive flows perpetuate momentum driven mis-valuation because they are systemically coordinated and indifferent to fundamental information. Investors' regular contributions to IRAs and defined-contribution retirement plans are mechanically allocated into passive products. These valuation-indifferent flows amplify any such mis-valuation. Passive flows effectively crowd out sophisticated active investors trading on fundamental information.3
Diminished Diversification
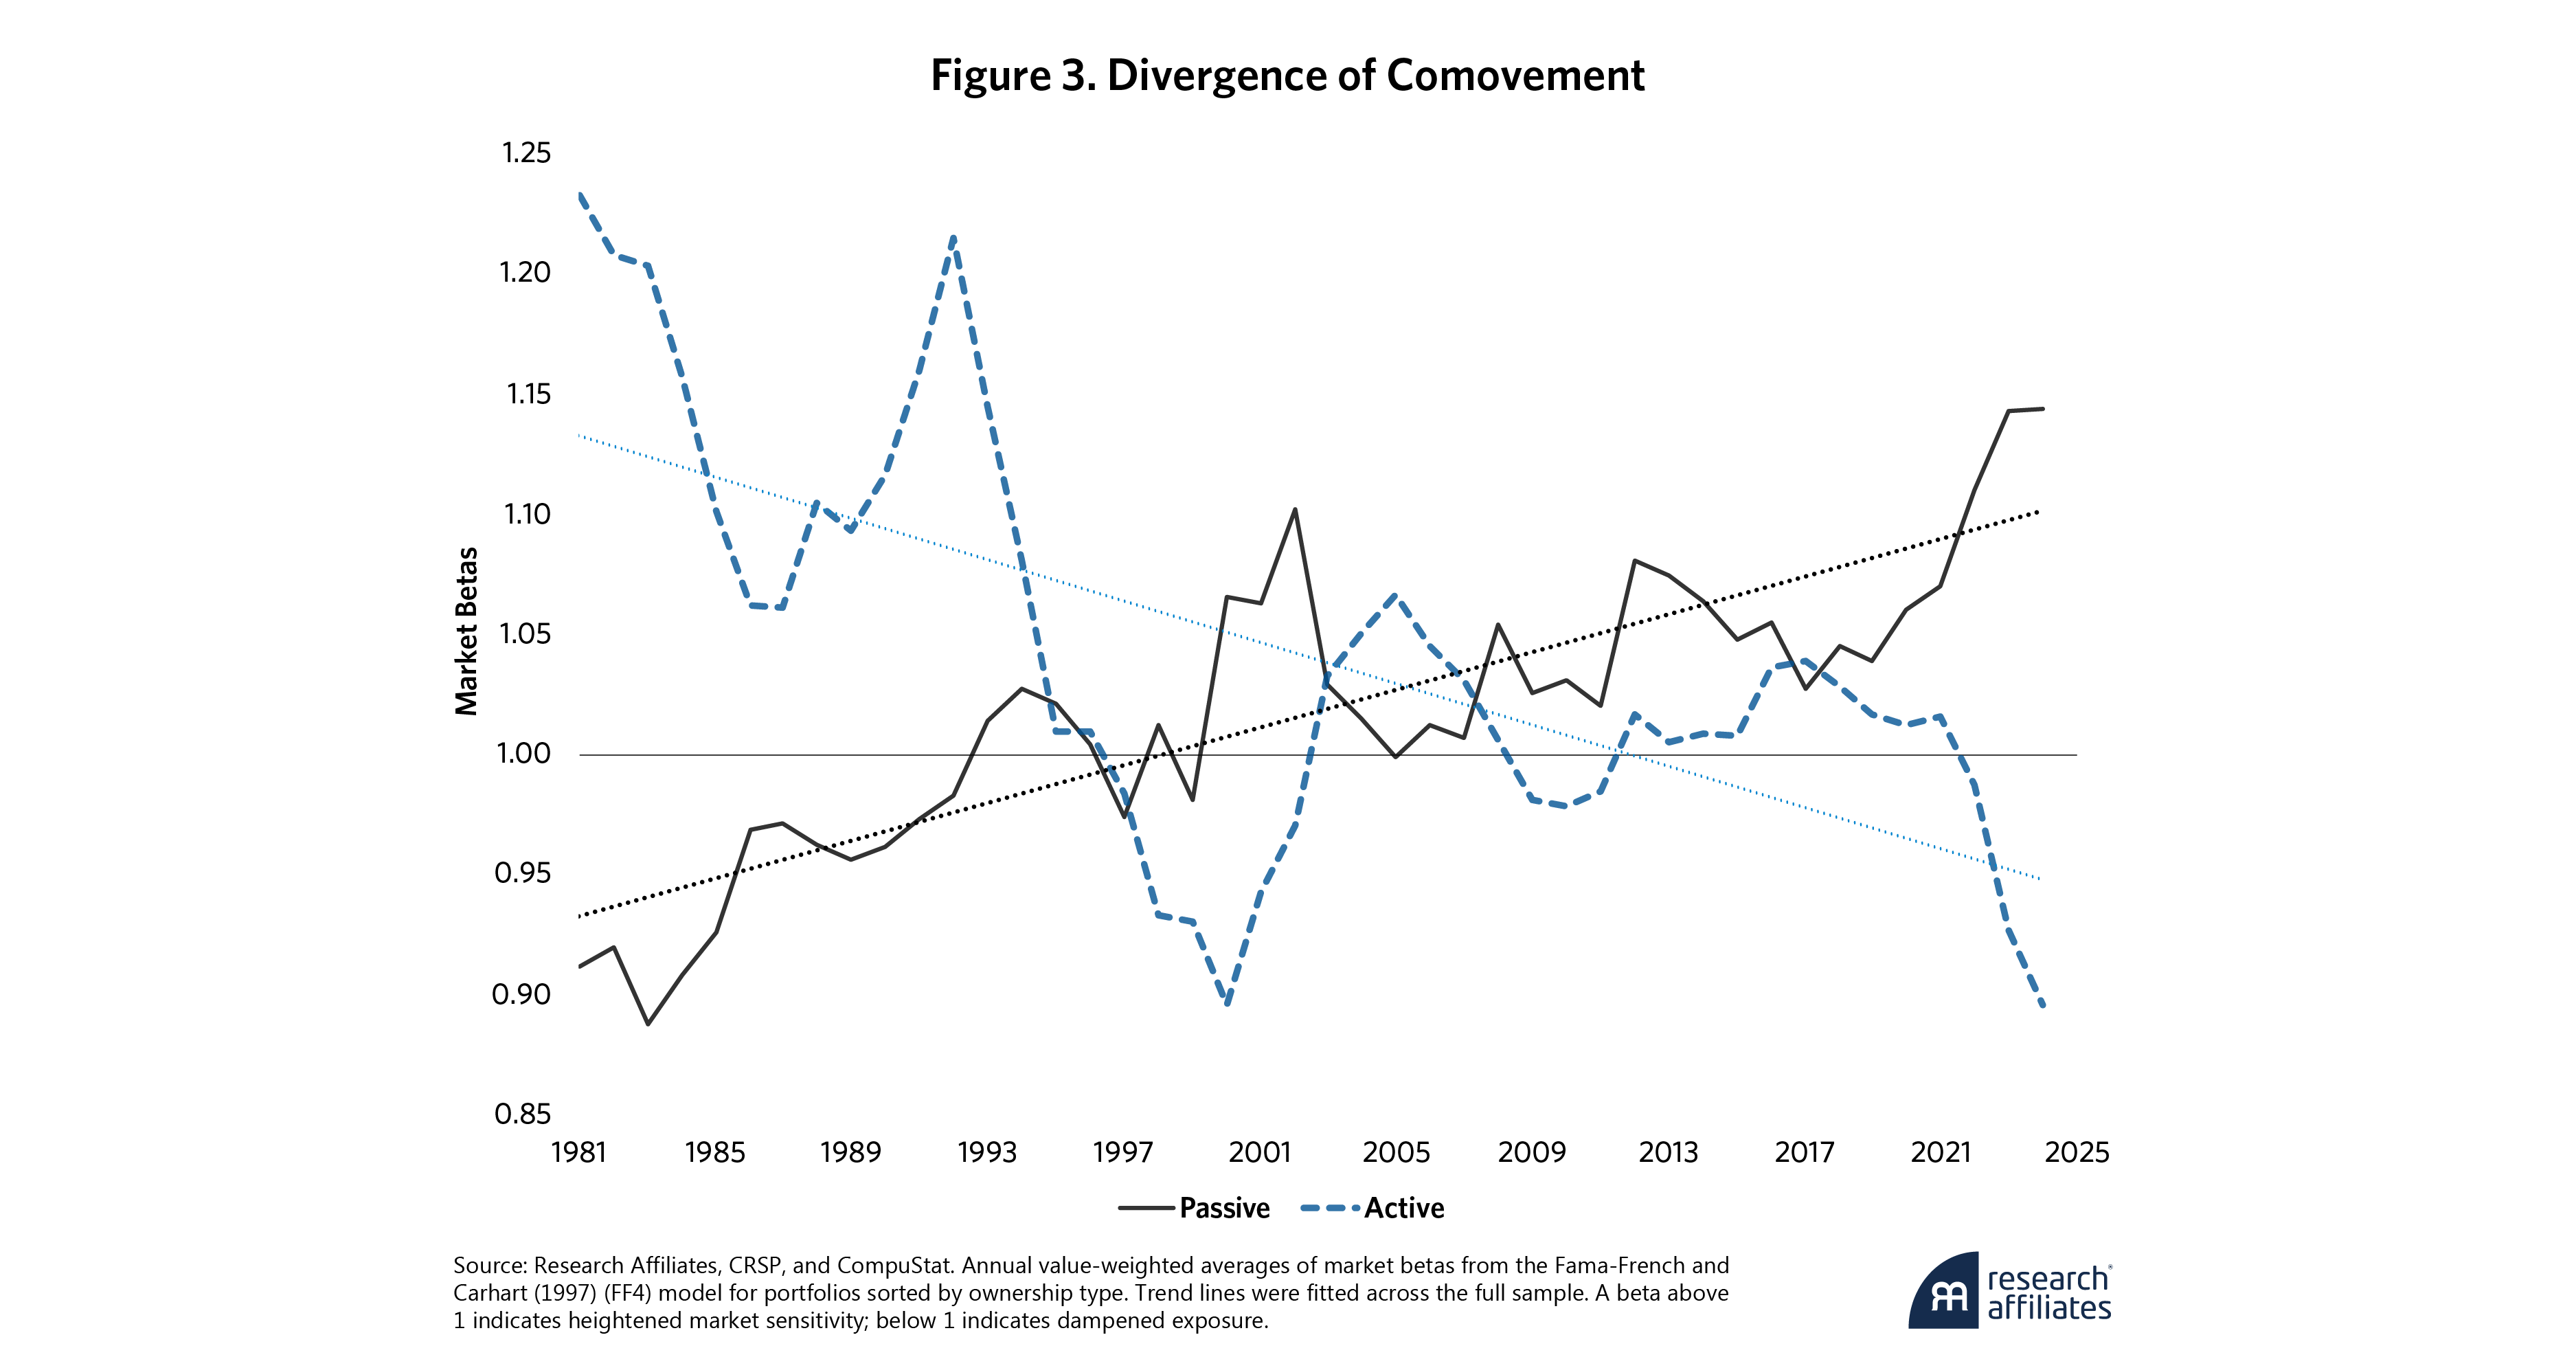
Stocks with different underlying business models and sectors are increasingly moving together, as shown in Figure 3. Stocks with high passive ownership display rising betas, whereas actively held stocks have shown a declining trend, a pattern that underscores a structural divergence in market responsiveness.
Prices of stocks added to the S&P 500 increasingly move together,4 thus diminishing diversification within the indices.5 Further, categorizing by style causes the stocks in those categories to move in lockstep, regardless of the stocks’ fundamental differences.6 Such persistent structural effects stem from mechanical index-driven buying and selling. This dynamic reflects coordinated price action rather than informed price discovery, thereby weakening diversification benefits within passive strategies.
We observe that ETF trade execution amplifies these effects. ETFs simultaneously deploy capital across hundreds of stocks during creations and redemptions, exerting indiscriminate price pressure.7 As a result, higher ETF ownership leads to higher co-movement among underlying stocks.8
Index rebalancing causes measurable price pressure at the market level.9 This dynamic reflects coordinated price action rather than informed price discovery, which weakens diversification benefits within passive strategies.
Fragility from Synchrony
As already noted, common ownership (rather than common risks) is increasingly driving stocks with different business models and sectors to move together. This effect is significantly elevating stocks' exposure to market-wide shocks.10 While research on the full impact of this shift continues to evolve, with some studies showing limited effects so far, we believe understanding the potential structural consequences of passive dominance has become increasingly important.
As passive products dominate, they become a single, coordinated trade, raising vulnerability to synchronized liquidations.11 Concentrated ownership means redemptions in one fund trigger cascading pressures across portfolios holding similar securities.12 While this effect is not exclusive to passive strategies, the scale of passive flows, combined with their synchronized nature, likely magnifies systemic risks.
As passive products dominate, they become a single, coordinated trade.
”Who exactly is buying shares when seemingly everybody wants to sell? Large institutions and firms themselves systematically avoid buying when index funds are selling, undermining diversification, exacerbating liquidity risk, and thereby causing more frequent and extreme volatility spikes.13
Erosion of Price Discovery
Cap-weighted index products abstain from price discovery, neither buying nor selling based on changes in information about the underlying companies. These passive strategies invest their persistent inflows more into stocks whose prices have gone up and less into stocks whose prices have gone down, reinforcing price momentum and diluting security-specific price discovery. The essential function of price discovery—necessary for market efficiency—relies on active investors, who trade based on fundamentals.
When a large fund (or many funds together) attracts inflows, the inflows put upward pressure on prices of the stocks the fund holds. With such powerful trends reinforced by a tide of passive flows, active managers, including short sellers, bide their time—waiting for high tide—before initiating their trades.14 For a good example, consider what happened with the frothy bubbles on the rising tide of the more general TMT (technology, media, and telecommunications) price distortion, including Pets.com, AOL, Cisco, Nortel, Ericsson, etc.
In theory, active managers may correct price inefficiencies. In practice, escalating passive dominance reinforces a feedback loop in which passive inflows perpetuate price trends, active managers underperform, and capital shifts further into passive strategies.
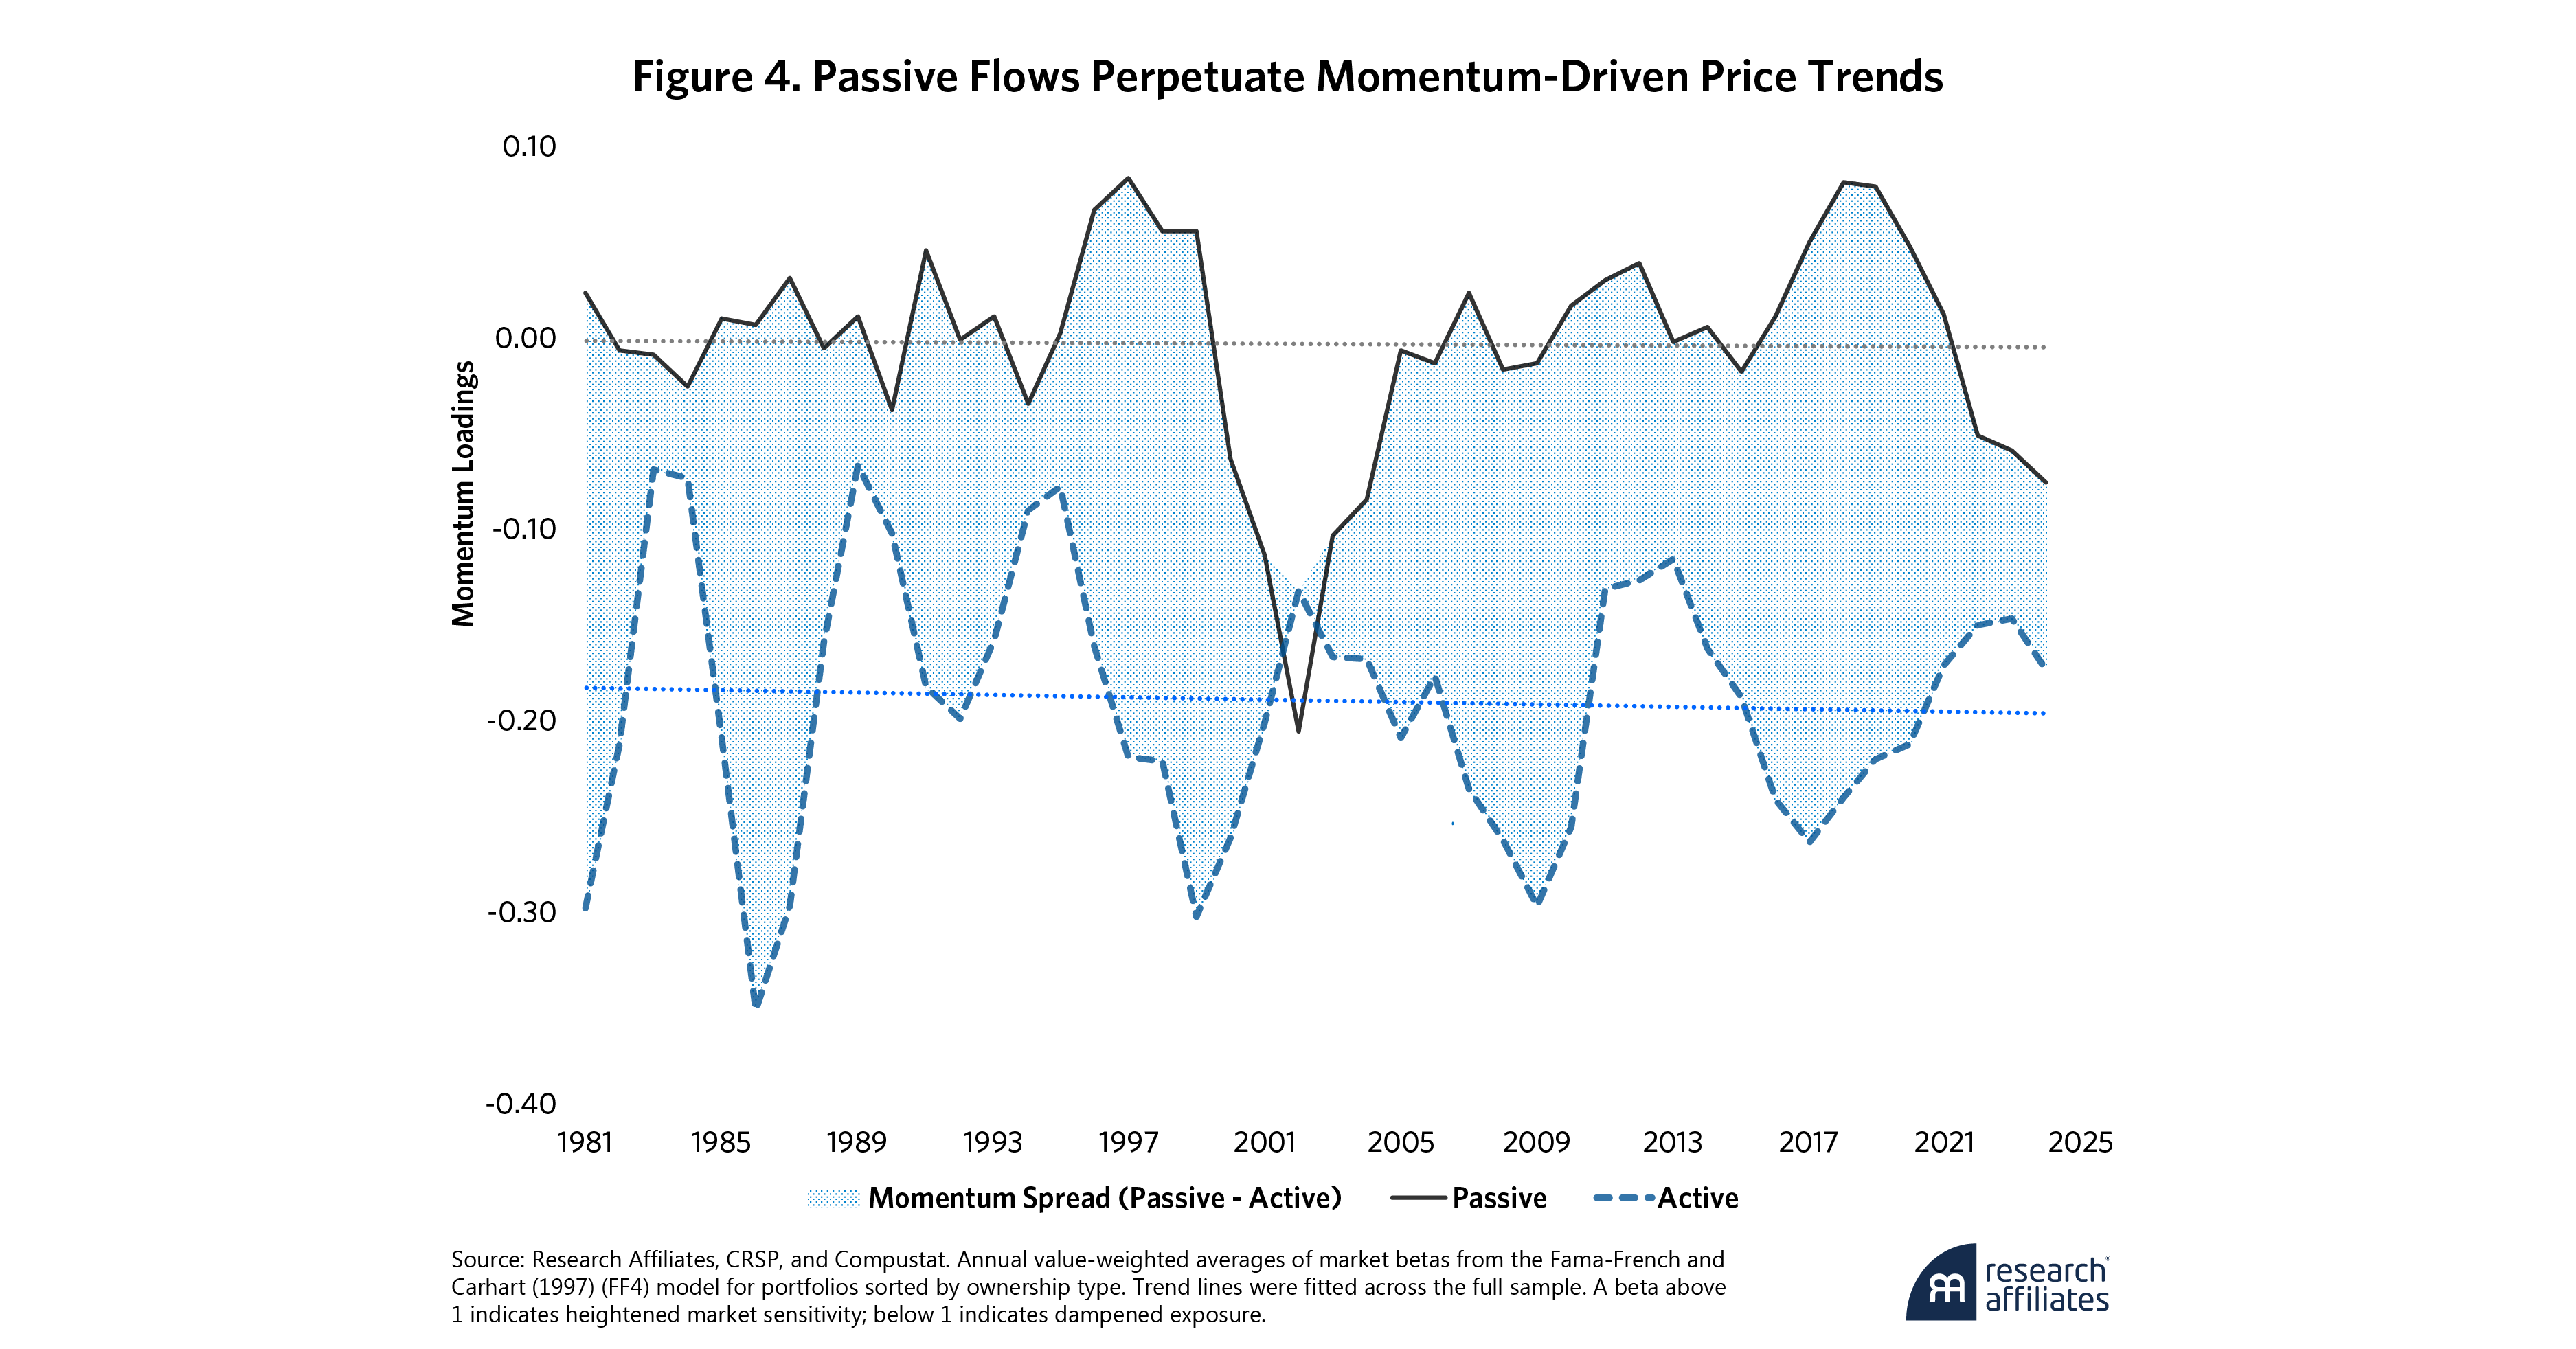
As shown in Figure 4, passively owned stocks exhibit near-zero or mildly positive momentum exposure but actively held stocks display consistently negative loadings, reflecting contrarian positioning. The spread highlights a self-reinforcing feedback loop: momentum-driven flows into passive vehicles elevate recent winners while active managers lean against price trends, sustaining the structural divergence of fund flows and investor allocations.
These market dynamics raise important questions about market efficiency. While we might not be at the tipping point today, the market is flying blind.15 How much passive ownership will tip the balance: 60%, 70%, more? We simply won't know until we get there.
Harvesting Mispricing
We believe these structural distortions present an opportunity to capitalize on inefficiency. While the return of the aggregate sum of active portfolios must be the market portfolio, inefficient pricing creates opportunities for some individual investors.
Structural distortions present an opportunity to capitalize on inefficiency.
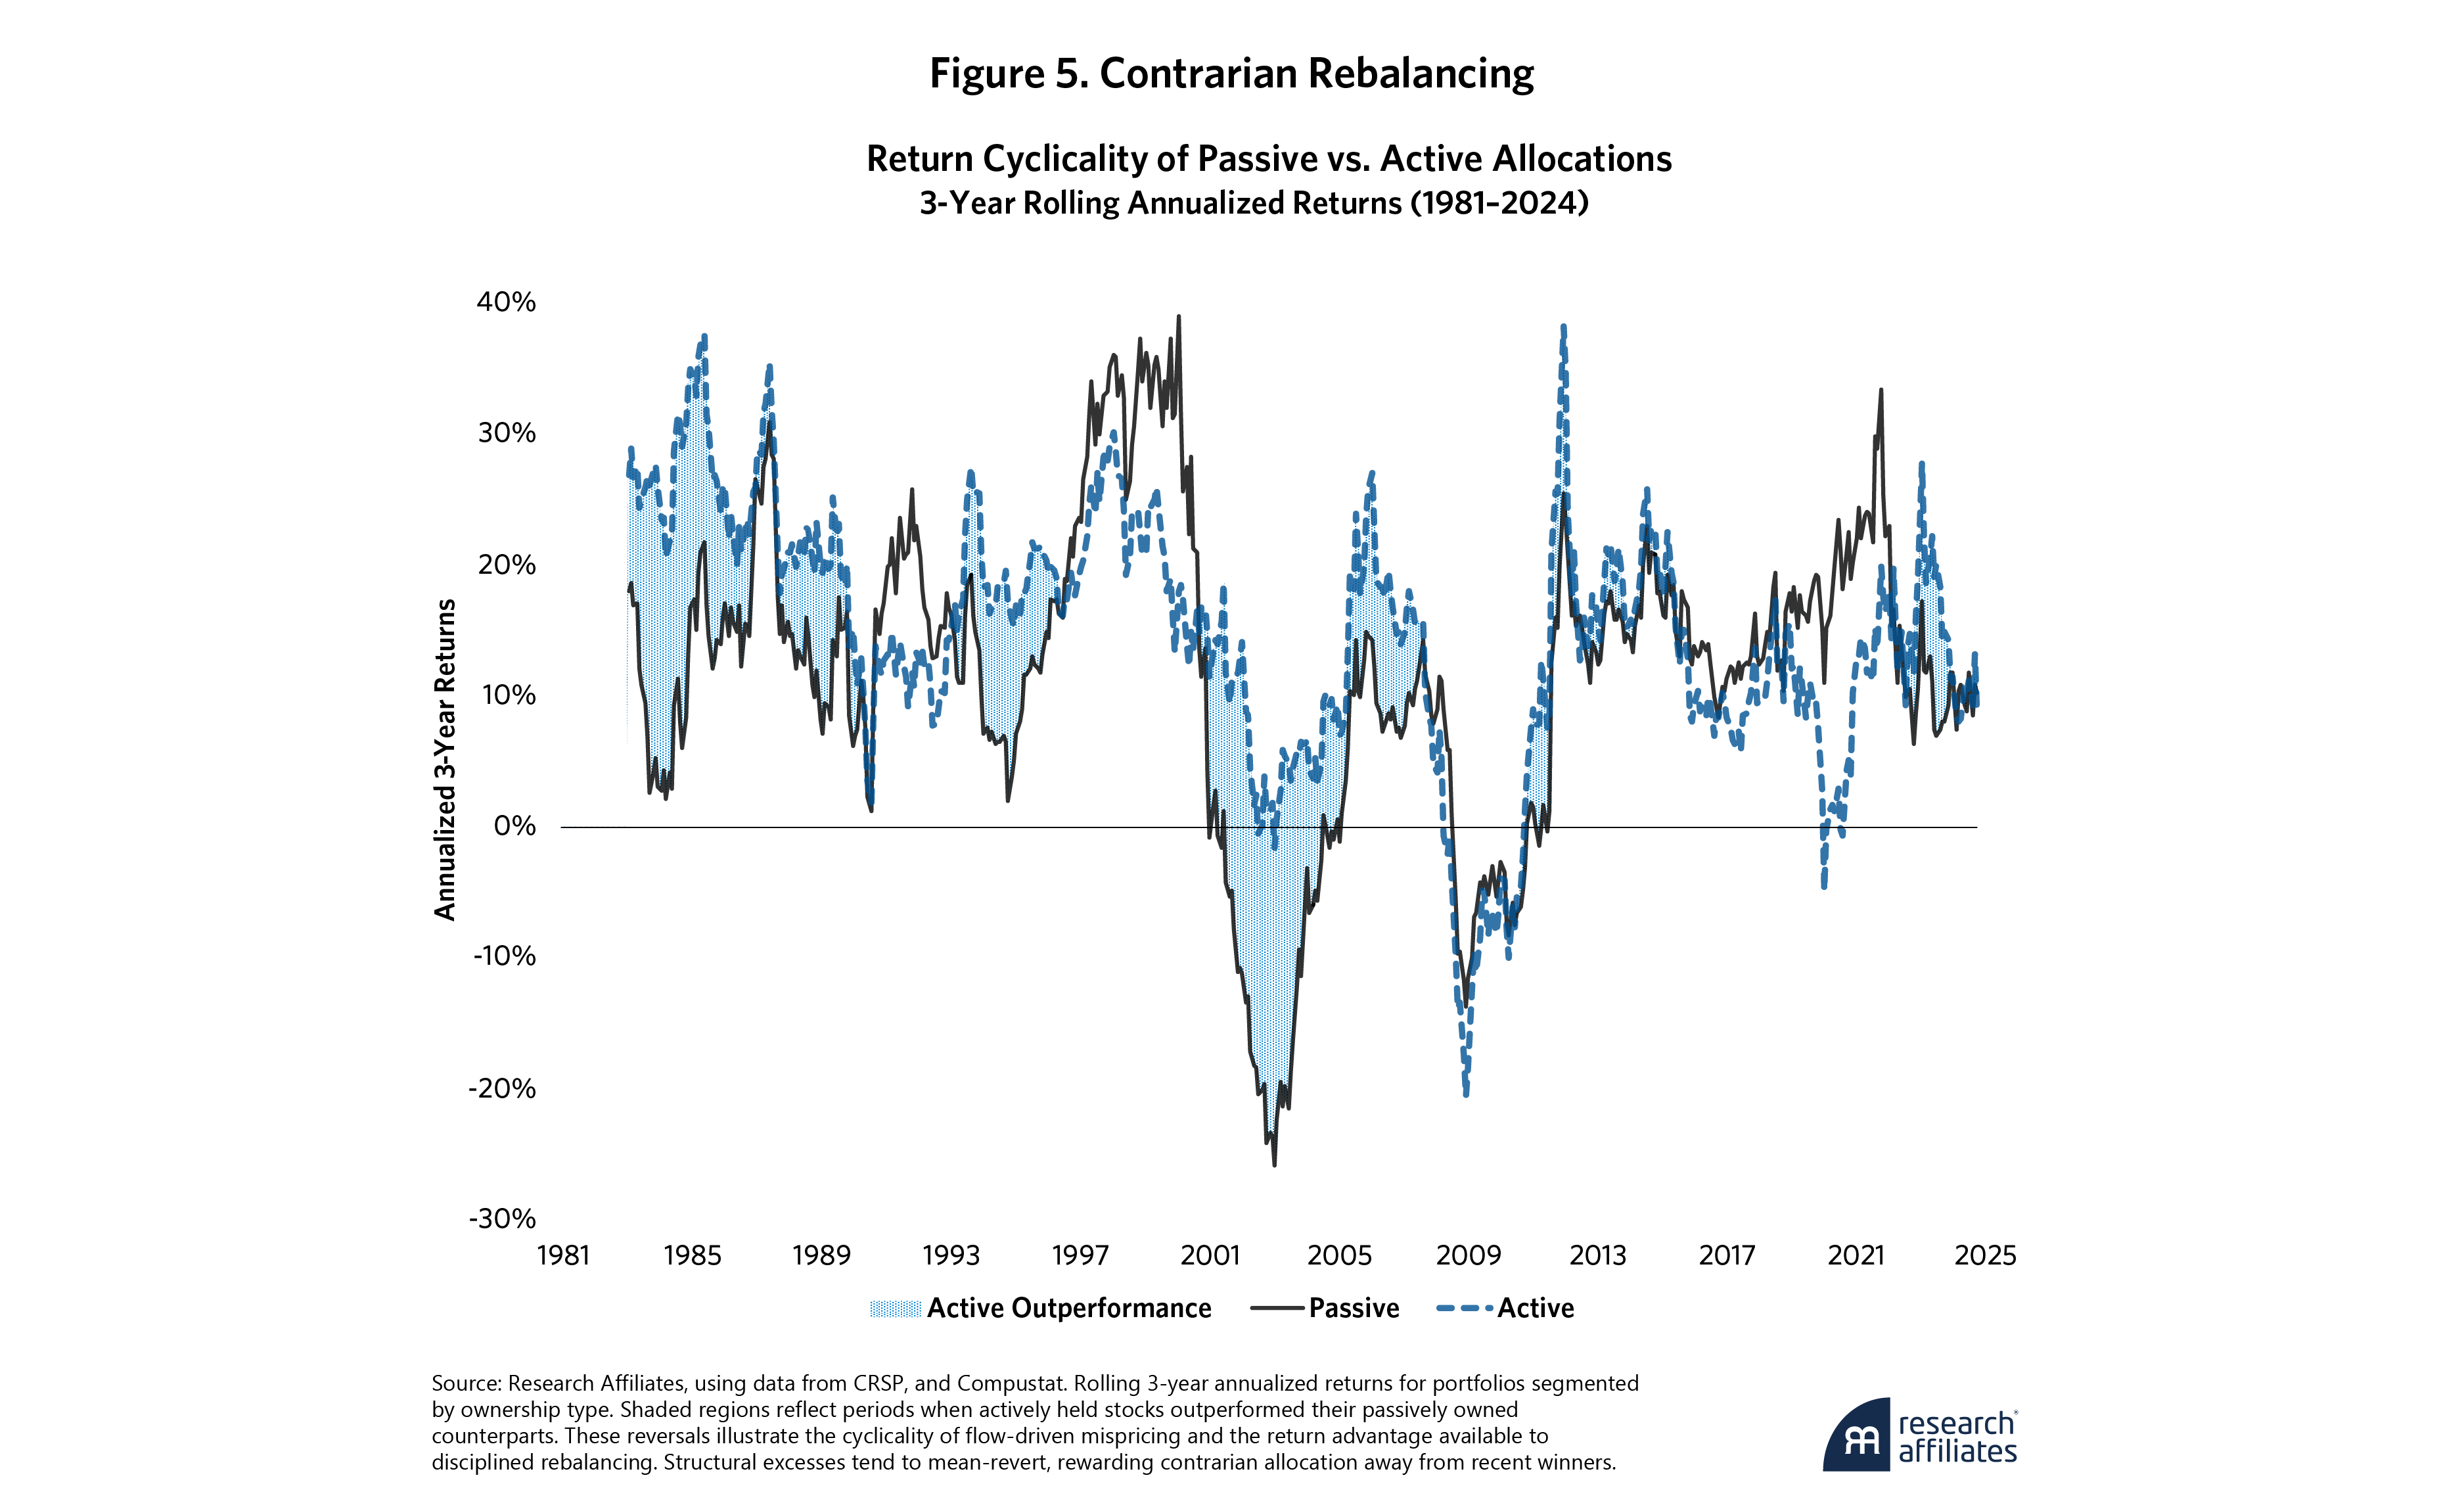
”Mechanical flows distort prices, which may eventually revert toward fundamental values. Figure 5 shows how this dynamic has worked through time, with shaded regions indicating periods when actively held stocks outperformed their passively owned counterparts. These reversals illustrate the cyclicality of flow-driven mispricing and the return advantage available to disciplined rebalancing.
Non-cap-weighted indices sever the direct linkage of market prices to portfolio weights. Equal-weighted indices and indices weighted by company fundamentals—by rebalancing systematically—curtail exposure to overpriced securities and boost stakes in undervalued ones. This approach is not tactical market timing; it is contrarian rebalancing.
Consider the dot-com bubble. Cap-weighted indices overweighted inflated tech stocks, devastating returns when the bubble burst. In contrast, equal-weighted and fundamentally weighted indices (by trimming exposure to exuberant sectors and names and adding to less-followed sectors and names) fared far better over the full cycle.
According to Bloomberg data, from 1995 through 2005—a period that captures the buildup and aftermath of the dot-com bubble—the S&P 500 generated annualized returns of 11.4%. Over the same period, the Russell 1000 Value Index returned 13.2% and the rebalanced equal-weighted S&P 500 returned 13.6%—with annualized excess returns of 1.8% and 2.2%, respectively.
When Flows Drive Markets
Passive investing revolutionized market access, offering low-cost exposure and simplicity. Yet it simultaneously reshaped the structure of the stock market. In 2024, the gravitational force of passive pulled in $2 trillion of flows. As a result, stock price movements have become more synchronized, and diversification thereby weakened; securities less liquid with systemic risk potentially intensified; and momentum-driven price trends reinforced. All of these developments are likely distorting stock prices.
Though fragility raises risks, it also rewards discipline. When prices are pushed away from fundamentals by non-economic flows, they tend to mean-revert, often abruptly. Strategies that systematically rebalance toward fundamental anchors are built to harvest this return potential.
In today's environment, where flow-driven comovement is pervasive and valuations increasingly detached from fundamentals, we believe the case for systematic rebalancing toward fundamentals has never been stronger. The more distorted the market, the greater the potential rewards from rebalancing.
The case for systematic rebalancing toward fundamentals has never been stronger.
”Please read our disclosures concurrent with this publication: https://www.researchaffiliates.com/legal/disclosures#investment-adviser-disclosure-and-disclaimers.
End Notes
1. Some market participants have expressed concerns about the rise of passive investing, for example, see Green.
2. Chinco and Sammon (2024) argues that the share of passive is much larger because many institutional investors have internally managed index portfolios that closely track passive benchmarks. Also, Chinco and Sammon’s share passive share seems smaller than ours. This is because they use a different denominator – total market capitalization. We use total funds.
3. See Gârleanu and Pedersen (2022). Bond and Garcia (2022) presents a model in which uninformed investors are more likely to be passive investors. This phenomenon decreases the price efficiency of the passive index and negatively impacts the liquidity of individual stocks in the index. The empirical evidence in Höfler, Schlag, and Schmeling (2025) is consistent with these implications and shows that passive ownership is associated with higher illiquidity, higher bid–ask spreads, more idiosyncratic volatility, and heightened tail risk. Haddad, Hueber, and Loualiche (2025) shows that the increase in passive demand over the past 20 years has made the demand for individual stocks 11% more elastic.
4. Wurgler and Zhuravskaya (2002).
5. Barberis, Shleifer, and Wurgler (2005).
6. Barberis and Shleifer (2003).
8. Ben-David, Franzoni, and Moussawi (2018).
9. Harvey, Mazzoleni, and Melone (2025).
10. Höfler, Schlag, and Schmeling (2025).
12. Greenwood and Thesmar (2011).
14. Sammon and Shim (2025) documents a significant adverse selection problem induced by mechanical rebalancing.
15. Wurgler (2010).
References
Anton, M., and C. Polk. 2014. “Connected Stocks.” The Journal of Finance 69(3): 1099–1127.
Barberis, N., and A. Shleifer. 2003. “Style Investing.” Journal of Financial Economics 68(2): 161–199.
Barberis, N., A. Shleifer, and J. Wurgler. 2005. “Comovement.” Journal of Financial Economics 75(2): 283–317.
Ben-David, I., F. Franzoni, and R. Moussawi. 2018. "Do ETFs Increase Volatility?" The Journal of Finance 73(6): 2471–2535.
Bond, P., and D. Garcia. 2022. “The Equilibrium Consequences of Indexing.” Review of Financial Studies 35 (7): 3175–3230.
Boyer, B.H. 2011. “Style-Related Comovement: Fundamentals or Labels?” The Journal of Finance 66(1): 307–332.
Boyer, B., and L. Zheng. 2009. “Investor Flows and Stock Market Returns.” Journal of Empirical Finance 16(1): 87–100.
Chinco, A., and M. Sammon. 2024. “The Passive-Ownership Share Is Double What You Think It Is.”
Gârleanu, N. and L. H. Pedersen. 2022. “Active and Passive Investing: Understanding Samuelson’s Dictum.” The Review of Asset Pricing Studies 12(2): 389–446.
Greenwood, R., and D. Thesmar. 2011. “Stock price fragility.” Journal of Financial Economics 102(3): 471–490.
Haddad, V., P. Huebner, and E. Loualiche. 2025. "How Competitive is the Stock Market? Theory, Evidence from Portfolios, and Implications for the Rise of Passive Investing." American Economic Review 115(3): 975–1018.
Harvey, C. R., M. Mazzoleni, and A. Melone. 2025. “The Unintended Consequences of Rebalancing.”
Höfler, Philipp, C. Schlag, and M. Schmeling. 2025. “Passive Investing and Market Quality.”
Israeli, D., C.M.C. Lee, and S.A. Sridharan. 2017. “Is There a Dark Side to Exchange Traded Funds (ETFs)? An Information Perspective.” Review of Accounting Studies 22(3): 1048–1083.
Sammon, M. and J. Shim. 2024. “Who Clears the Market When Passive Investors Trade?” Working Paper 4777585.
Sammon, M. and J. Shim. 2025. “Index Rebalancing and Stock Market Composition: Do Index Funds Incur Adverse Selection Costs?”
Schmalz, M. 2018. “Common Ownership, Concentration, and Corporate Conduct.” Annual Review of Financial Economics 10: 413–448.
Sharpe, William.1964. “Capital Asset Prices: A Theory of Market Equilibrium under Conditions of Risk.” Journal of Finance 19(3): 425–442.
Shi, G. 2025. “Style Investing and Return Comovement.” The Journal of Portfolio Management 51(4): 196–209.
Wurgler, J., and E. Zhuravskaya. 2002. “Does Arbitrage Flatten Demand Curves for Stocks?” The Journal of Business 75(4) 583–608.
Wurgler, J. 2010. “On the Economic Consequences of Index-Linked Investing.” NBER Working Paper No. 16376. National Bureau of Economic Research.
Appendix
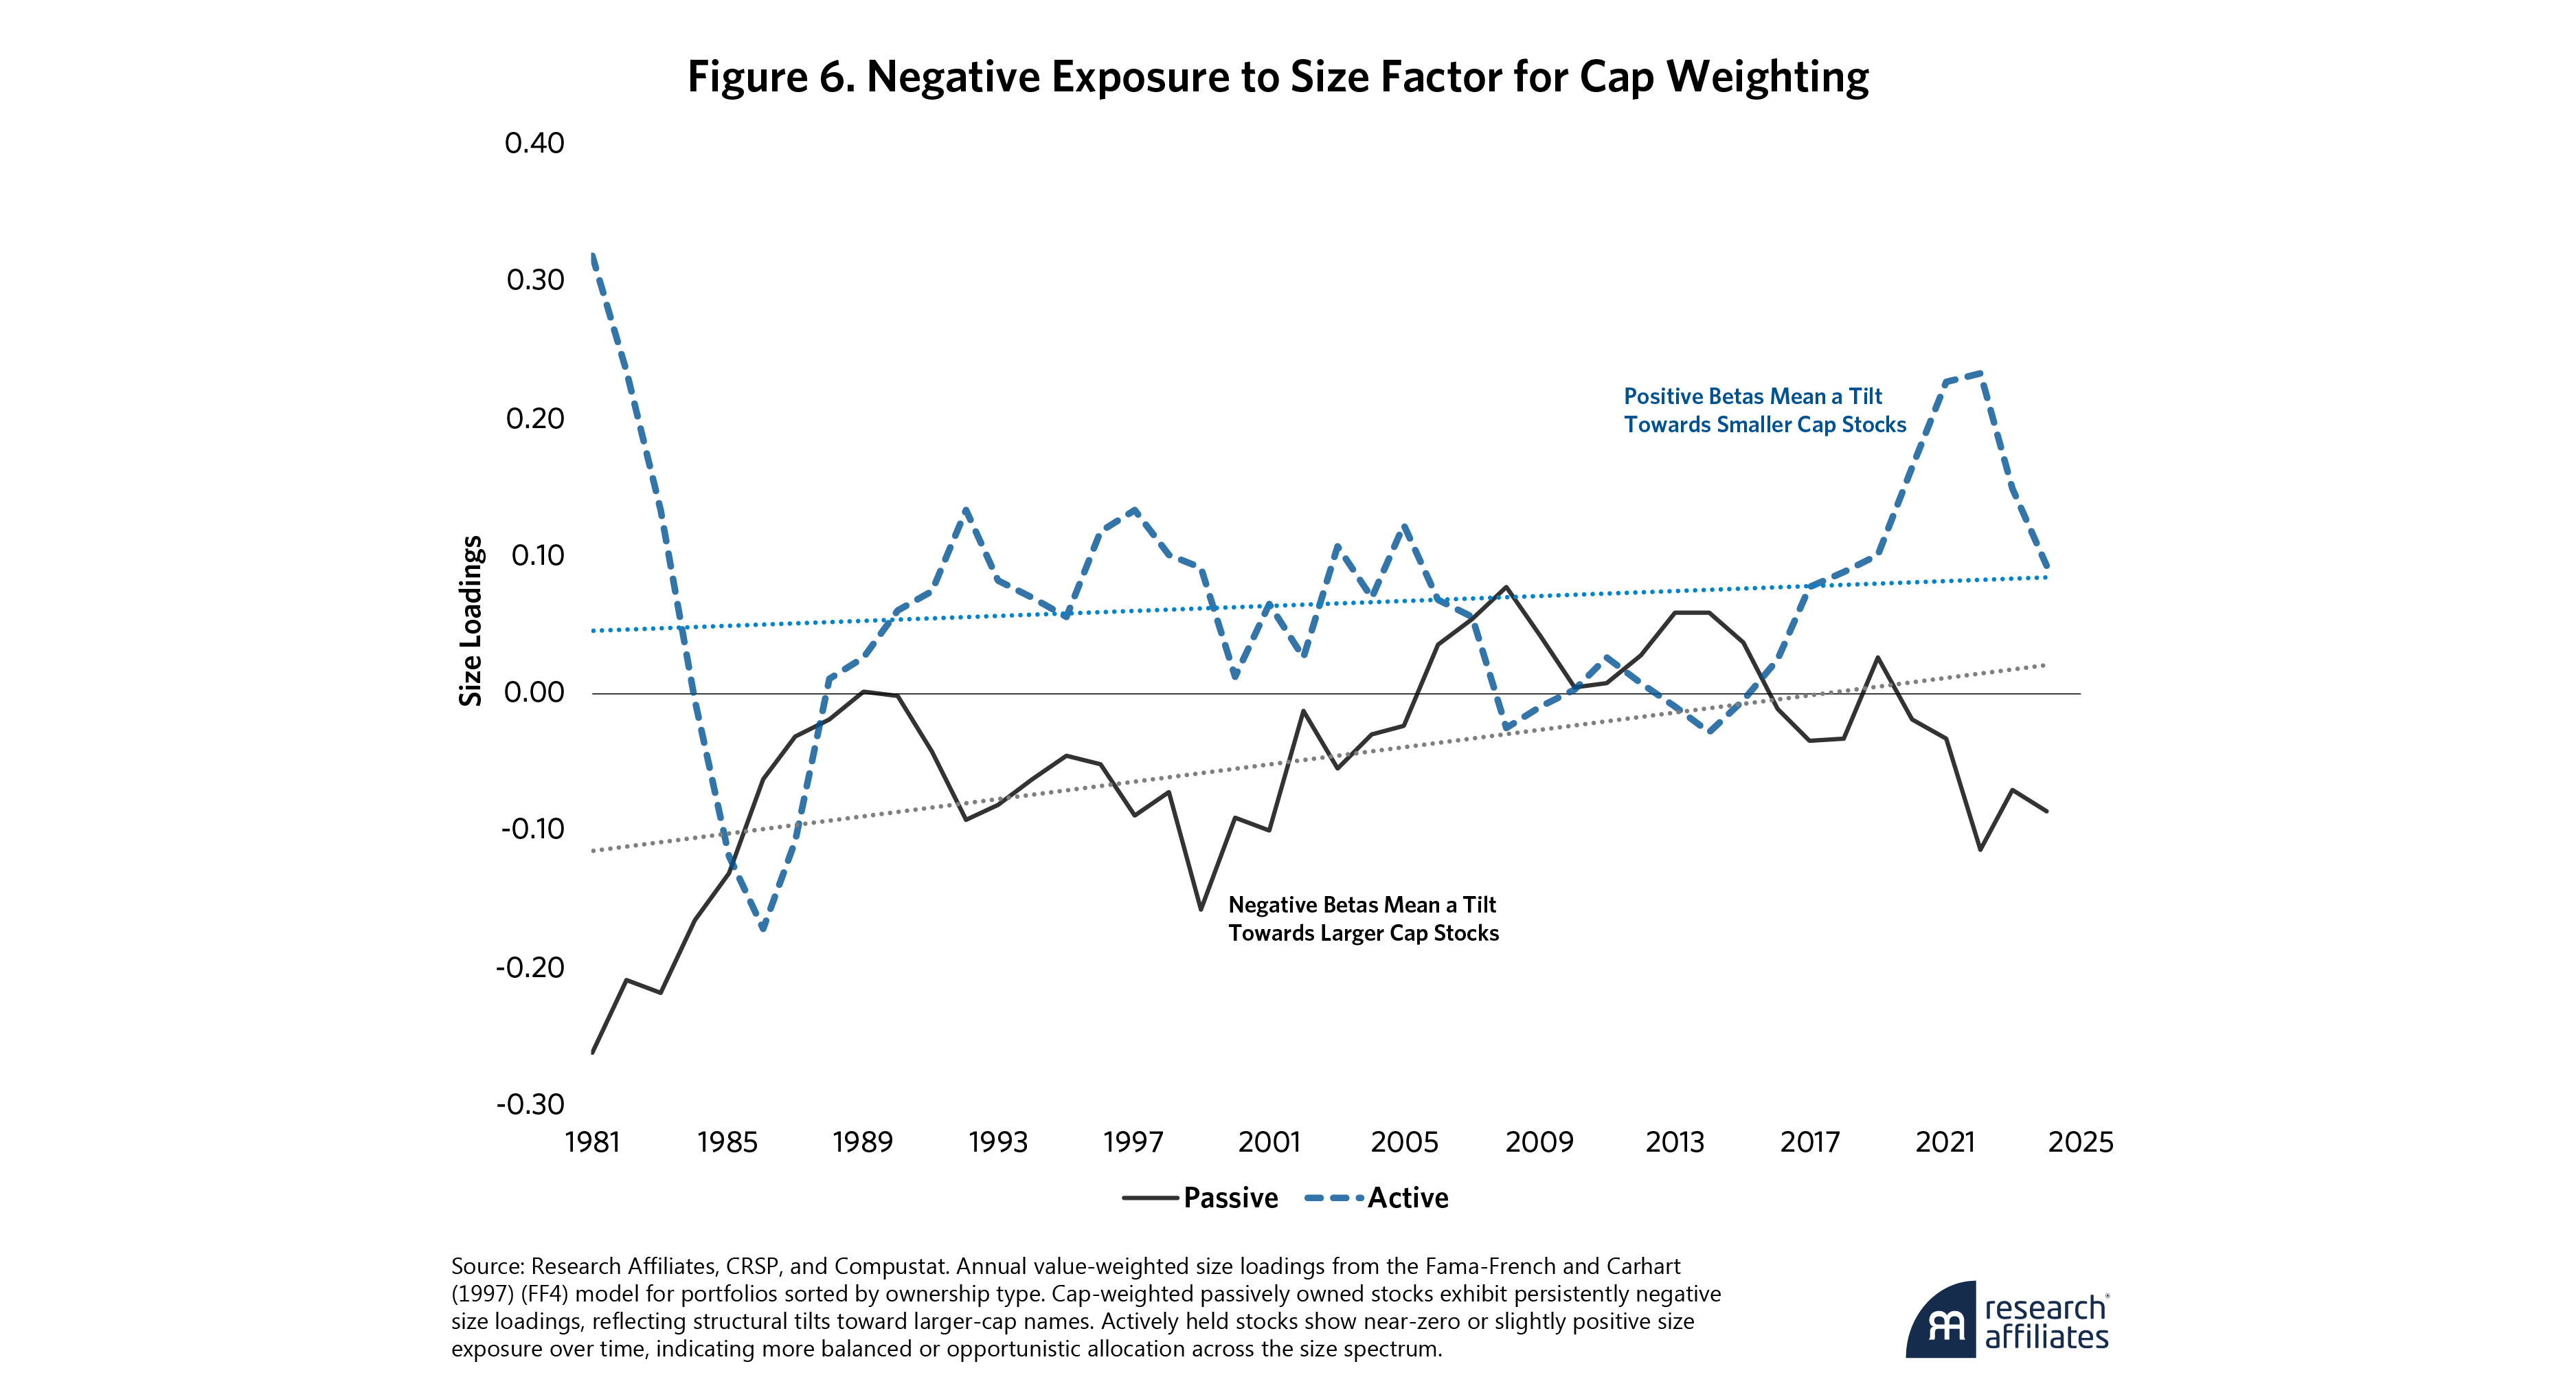
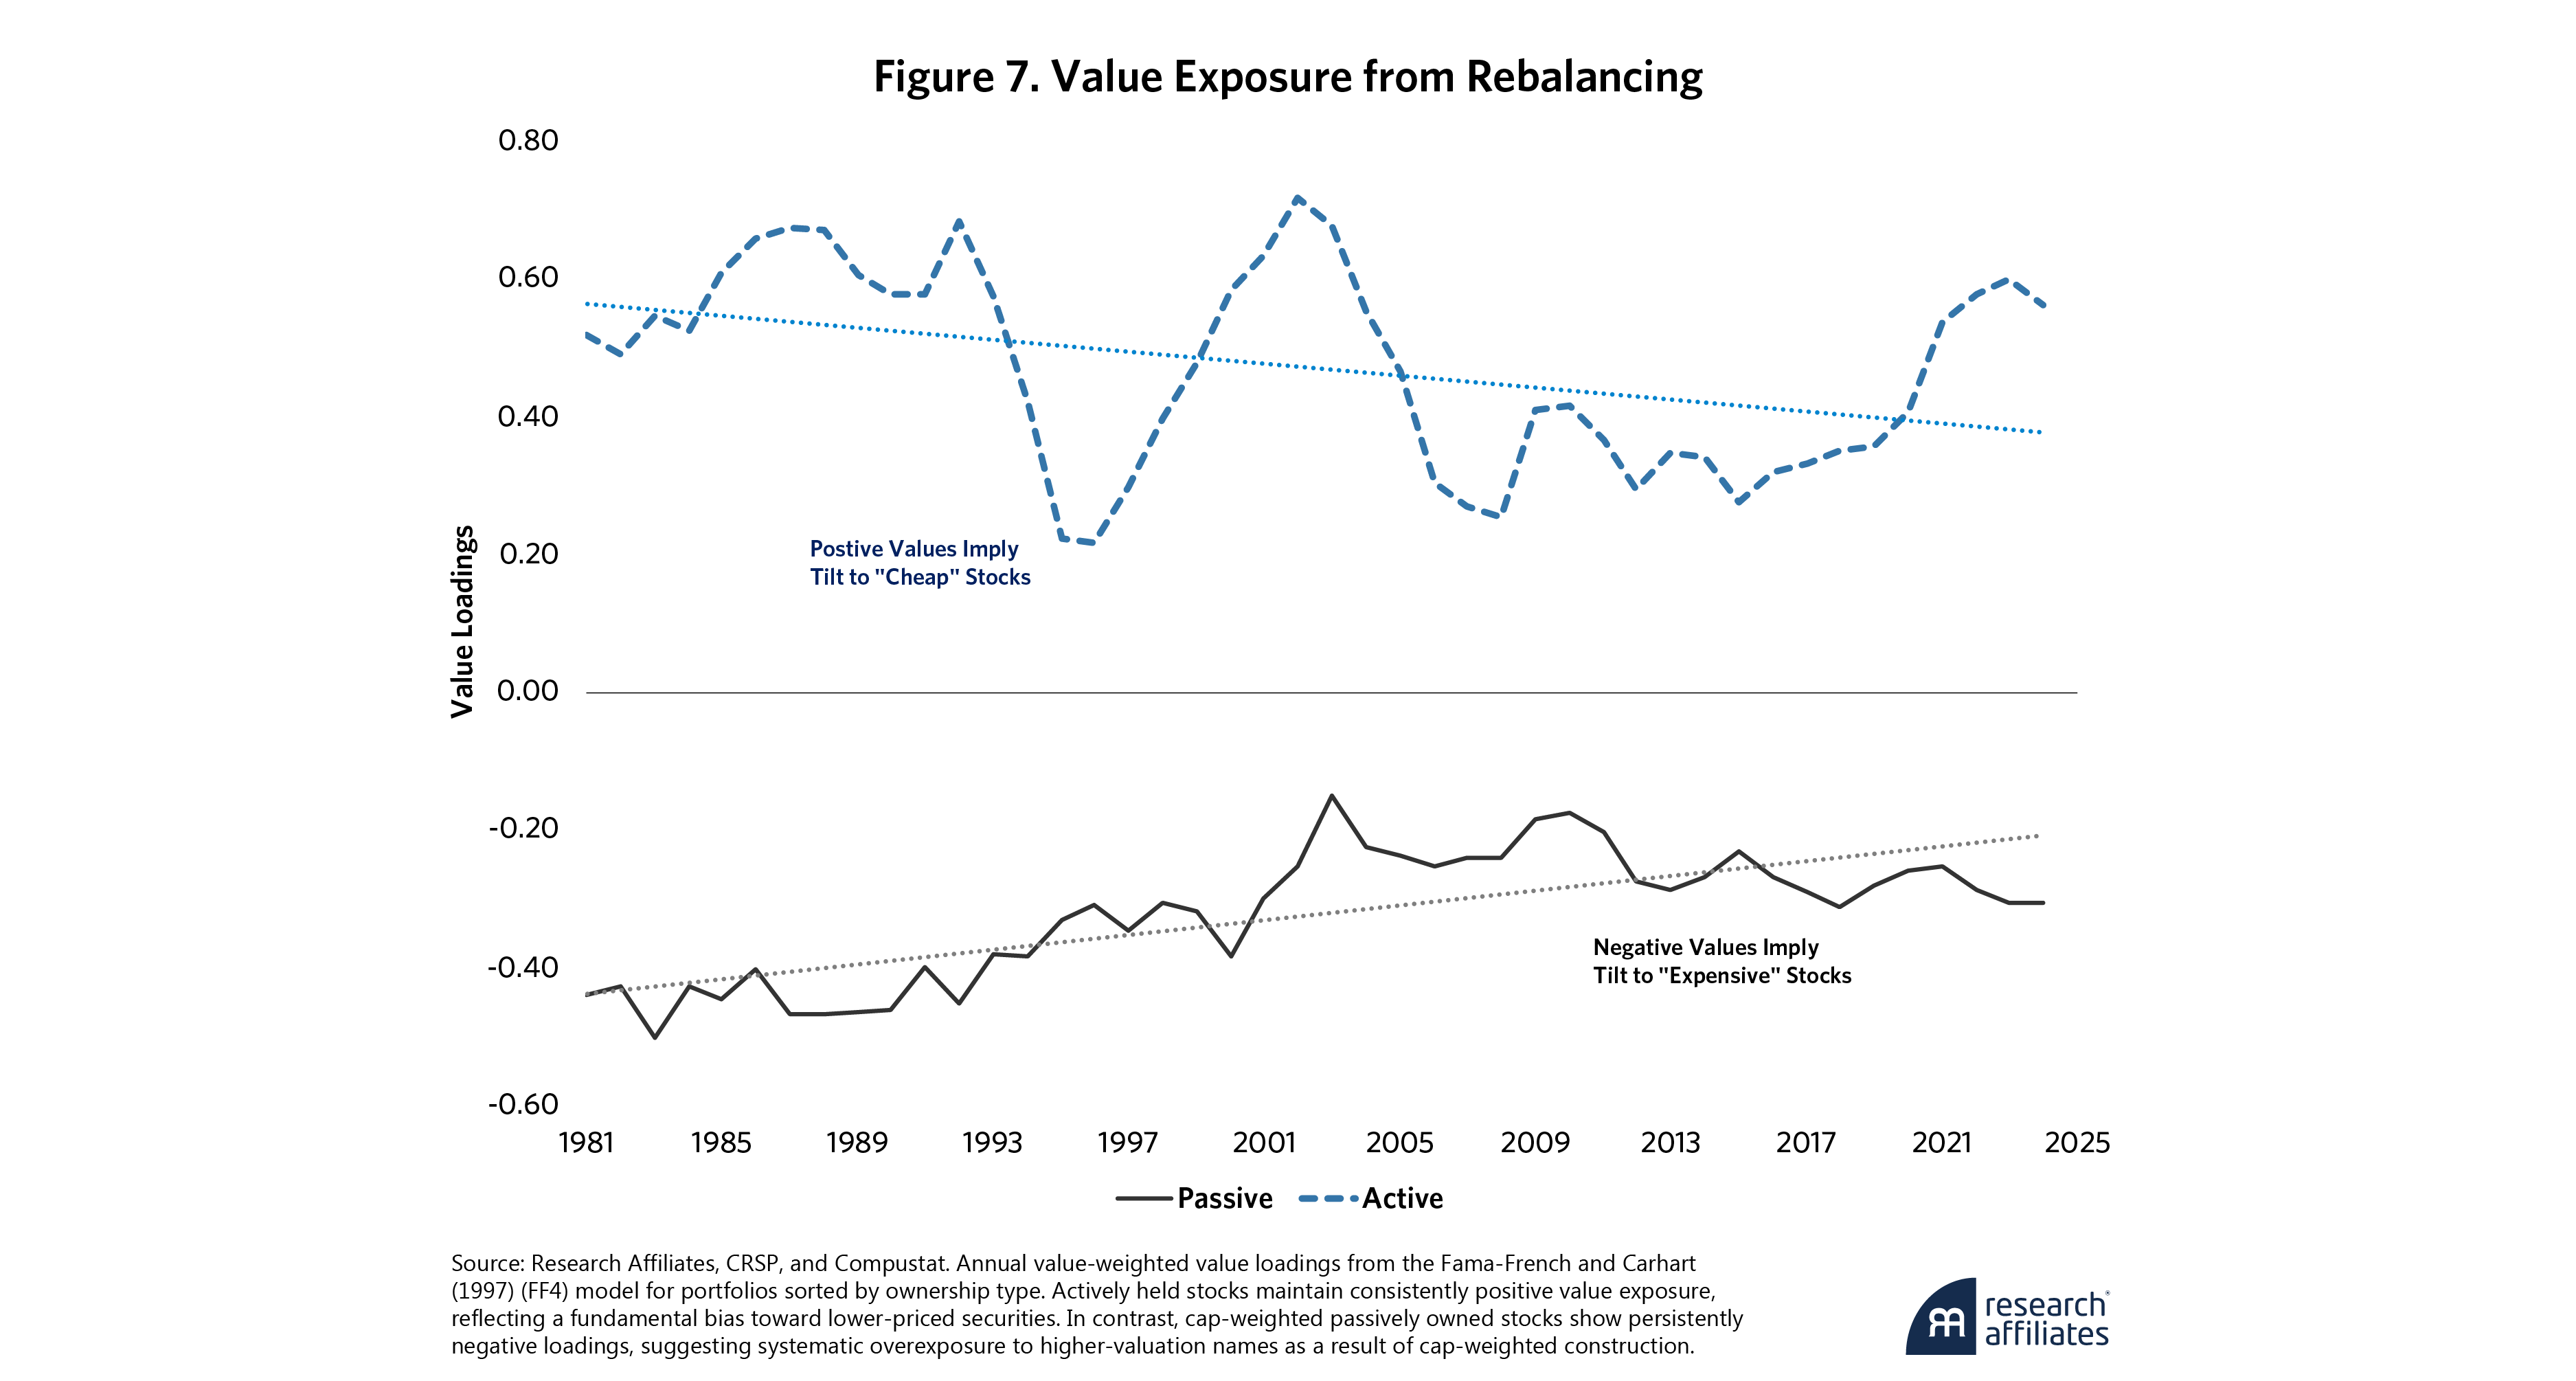
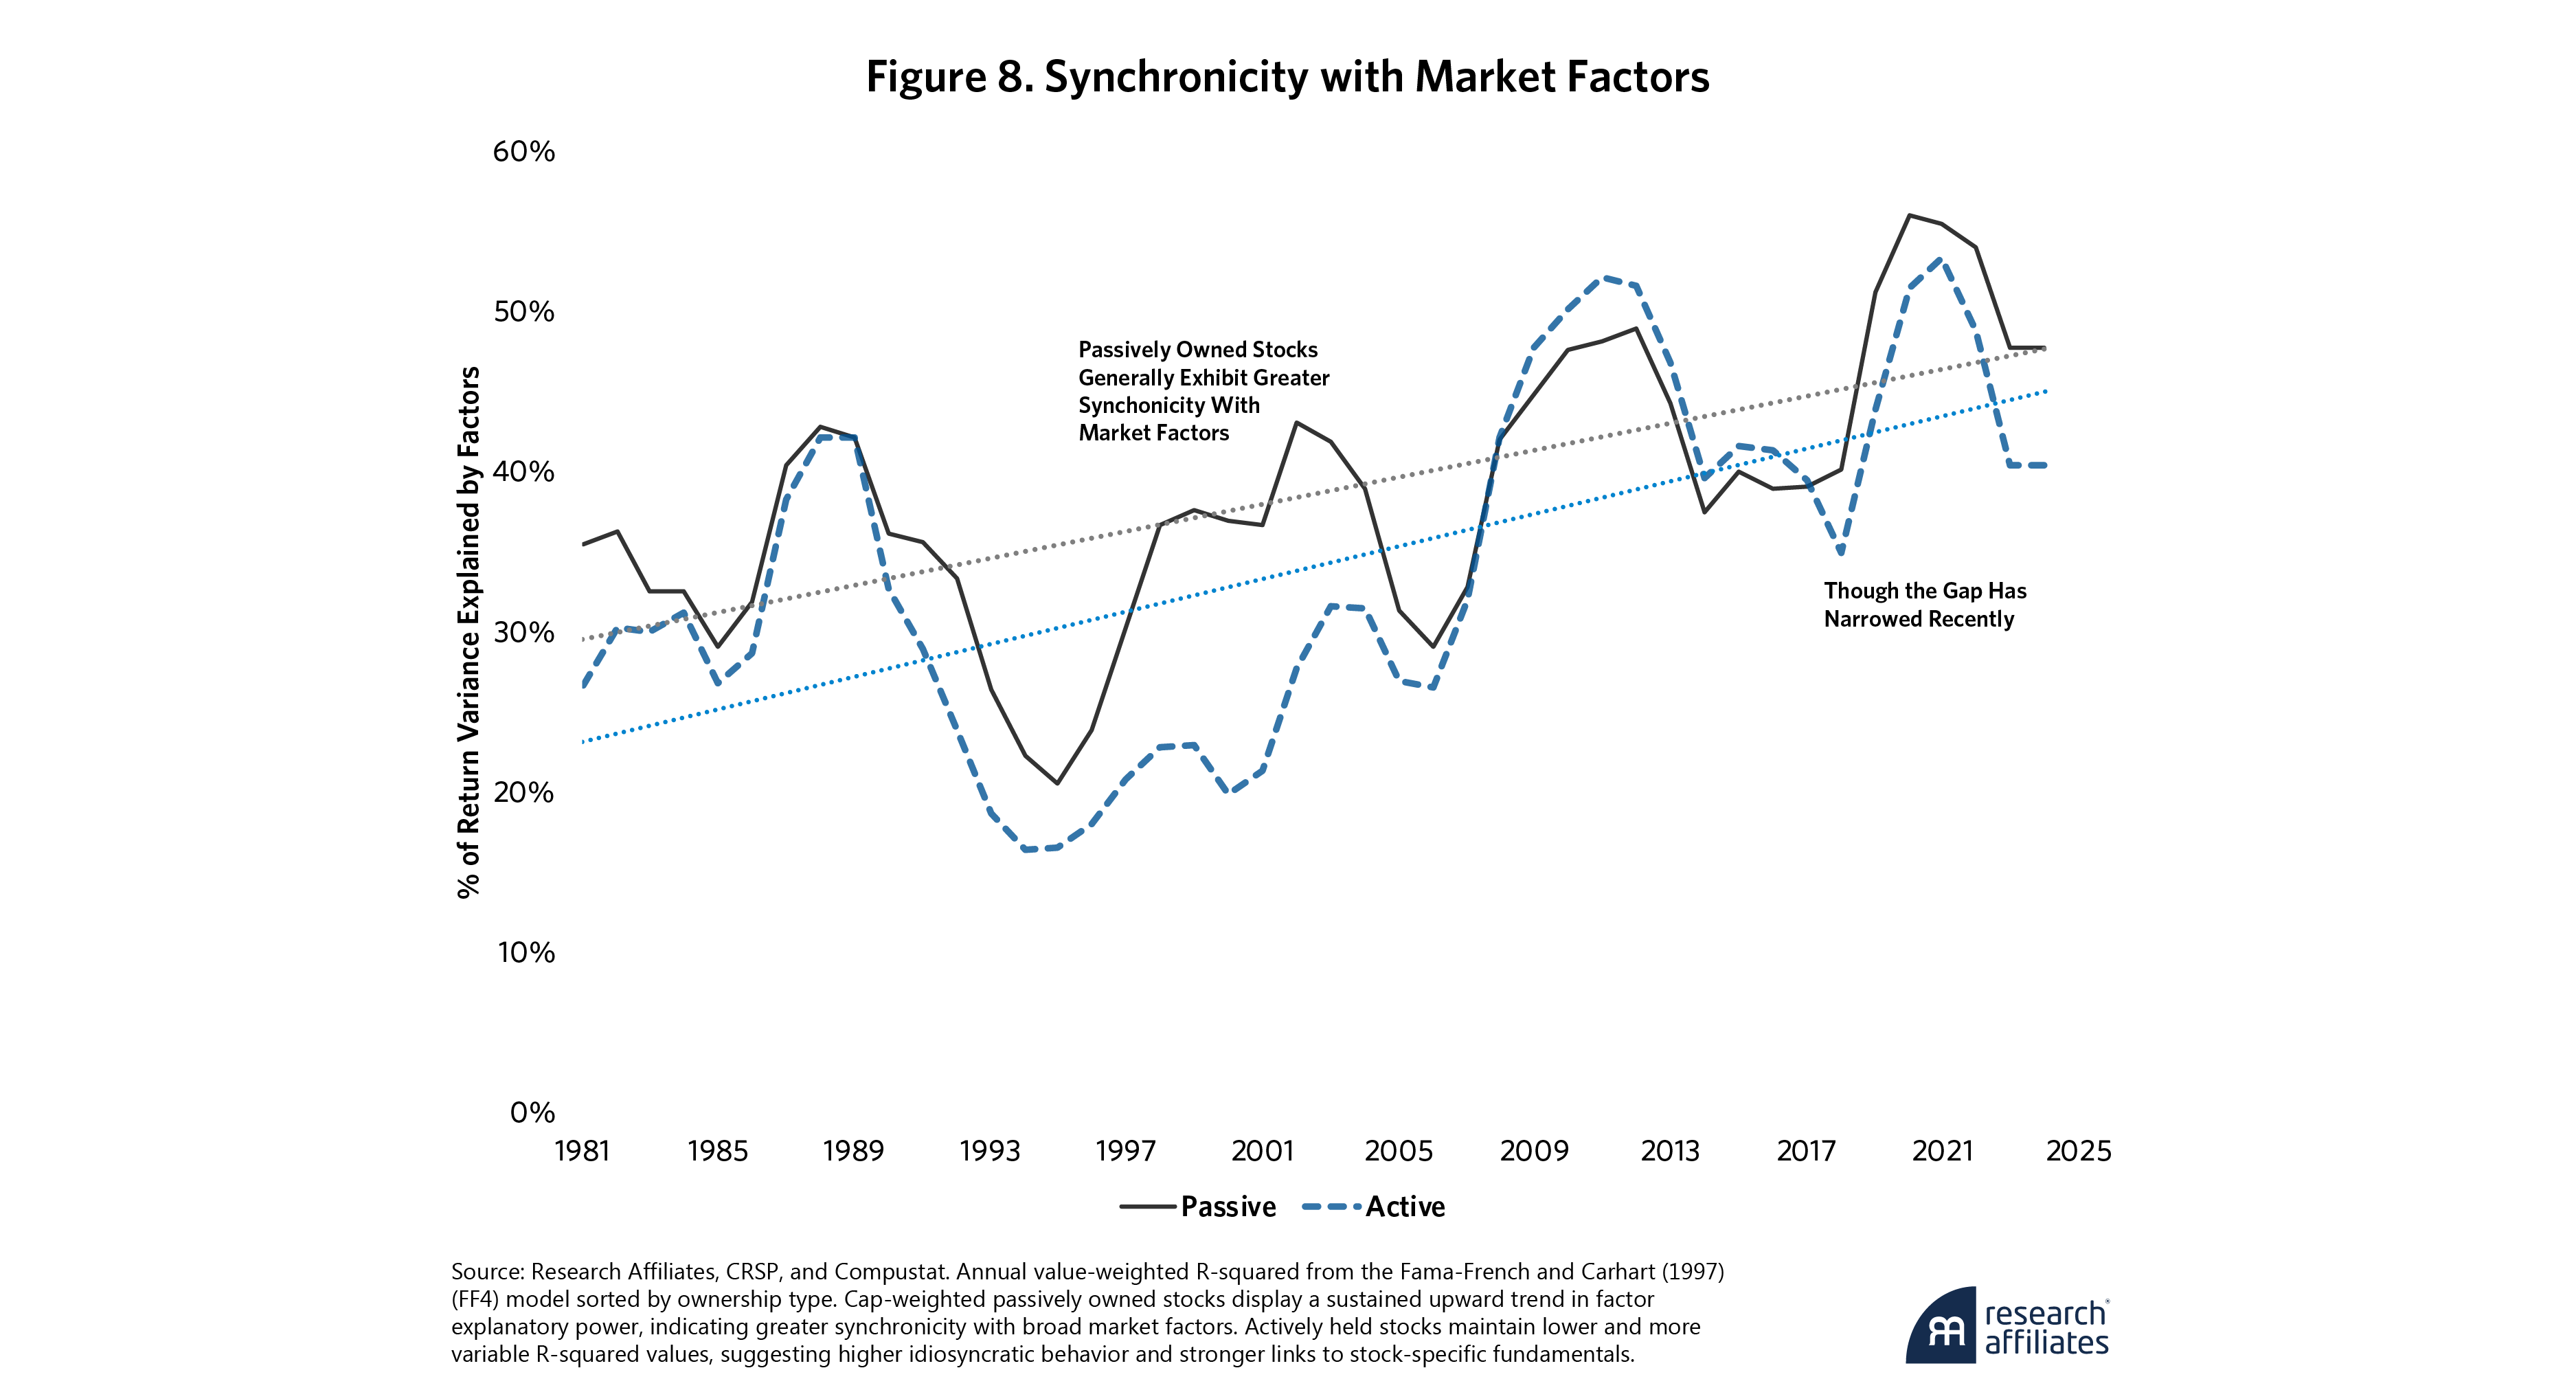
This appendix provides additional methodological details and supplementary analysis that support the main findings presented in the article. Here you will find information on how the passive and active portfolios were constructed for our analysis, detailed methodology for the factor exposure calculations, and additional factor exposures (size, value, R-squared) that complement the market beta and momentum analyses presented in Figures 3 and 4 of the main text. These technical details offer further evidence of the structural divergence between passive and active investing approaches.
Constructing Passive and Active Portfolios
Passive and Active portfolios are formed from a shared universe of the largest publicly traded U.S. equities, sorted by both market cap and fundamental economic scale. Each March, the portfolios are reconstituted based on the relative dominance of price versus fundamentals.
Stocks for which market capitalization materially exceeds fundamental size are assigned to the Passive portfolio, reflecting the active positioning of valuation-indifferent flows. Conversely, stocks for which fundamental size surpasses market cap are assigned to the Active portfolio, reflecting the active positioning of systematically rebalanced portfolios.
Fundamental size reflects a blend of economic indicators (including sales, cash flows, and book equity) designed to approximate a company's economic footprint. Portfolios are mutually exclusive by construction. Weights are proportional to the magnitude of each stock's relative misalignment: the Passive portfolio emphasizes stocks trading well above their fundamental size; the Active portfolio tilts toward those trading at a discount relative to the fundamental size of the underlying company.
This construction framework isolates the effects of price-driven flows from fundamental-based rebalancing, sharpening the contrast between structural momentum and disciplined rebalancing.
Methodology for Value-Weighted Factor Estimates
Annual factor loadings are estimated by regressing each stock’s daily excess returns on daily factor returns over non-overlapping 12-month windows. Each window spans April of year t through March of year t+1, with estimates indexed to the end of the period (March t+1).
Factor data are sourced from Kenneth French’s data library. The Fama-French-Carhart (FF4) model (comprising the Fama-French three-factor model plus the momentum factor) serves as the basis for capturing systematic exposures.
For each portfolio, stock-level regression coefficients are aggregated using value-weighted averages. Weights reflect each stock’s portfolio assignment and are proportional to the magnitude of its relative misalignment. Weights are taken as of the beginning of each window (April t), consistent with the portfolios' construction and rebalancing schedule.
This approach enables a clean attribution of factor exposure by ownership type, capturing how structural mispricing shapes risk characteristics over time.
