
ESG ratings vary markedly by ESG ratings provider because each provider has a unique methodology for assigning company-specific ratings. Investors, therefore, must ensure the approach taken by the ratings provider they rely on is consistent with their ESG preferences or they risk constructing portfolios that do not align with their ESG views.
ESG portfolios constructed using the ratings of two well-known ESG ratings providers yield large performance dispersion and low correlation of returns. The differences are even greater at the individual ratings level for environmental, social, and governance scores.
The differences in how ratings providers calculate ESG scores can result in the same company being ranked quite highly by one provider and quite poorly by another. Understanding which metrics are evaluated and how they are assessed is essential to investors selecting stocks that meet the ESG criteria they care about.
Abstract
ESG is a highly heterogeneous space and ESG ratings providers play an increasingly important role in the investment process through their assessments of companies across various ESG metrics. Unfortunately, the lack of robust data by which ESG ratings are determined is a significant barrier to greater adoption of ESG strategies. In addition, the methodologies used by ESG data providers are not consistent and can lead to drastically different outcomes when used to construct a portfolio. To illustrate, we compare two US portfolios and two European portfolios constructed based on the ratings of two well-known ESG ratings providers. We also compare the two providers’ respective company-specific ratings for Wells Fargo and Facebook and find two very different assessments of these companies.
The recent corporate scandals involving well-known companies such as Wells Fargo, Volkswagen, and Facebook have kept ESG strategies in the headlines. At the same time, investors have been migrating away from actively managed strategies and toward passive management. The rise of ESG investing coupled with the growing popularity of passive investing has made the quality and availability of systematic ESG ratings data ever more important. Unfortunately, the quality of ESG ratings data can be deficient due to a lack of coverage and a dependence on self-reporting. This inadequacy is often cited as one of the largest impediments to investors who would like to enter the ESG space. In a 2017 BNP Paribas survey of institutional investors, 55% of respondents stated that lack of robust data is the most significant barrier to greater adoption of ESG strategies.1 In addition, the methodologies used by ESG data providers are not consistent and can lead to drastically different outcomes when constructing a portfolio.
In this paper, we will first review ESG data providers in order to help investors gain a better understanding of the ESG ratings landscape. Then we will construct generic ESG portfolios using different providers’ data to illustrate how ESG data providers are incorporating their subjective judgments into the ratings, which leads to very different portfolio outcomes.
Create your free account or log in to keep reading.
Register or Log in
The ESG Data Landscape
The ESG arena is characterized by a large number of ratings providers offering a very wide array of data, from specialized providers that calculate metrics on specific ESG traits, such as carbon score and gender diversity, to providers that rate companies based on several hundred ESG-related metrics. Knowing where to start when evaluating data providers is a significant task and no single public source or directory offers a comprehensive overview of data providers. A few articles (e.g., Douglas, Van Holt, and Whelan, 2017) have tried to organize the available information, but given the fast growth of the ESG data space, they have become outdated quickly. At the time of this writing, we have identified 70 different firms that provide some sort of ESG ratings data.2 (This does not include the multitude of investment banks, government organizations, and research organizations that conduct ESG-related research that can be used to create customized ratings.)
A few think tanks and other organizations publish annual reviews of ESG data providers. SustainAbility has been publishing the Rate the Raters report since 2010 to provide survey results from various sustainability professionals regarding the quality of certain ESG data providers.3 SRI-Connect also publishes an annual survey called the Independent Research in Responsible Investment Survey, or IRRI,4 which provides rankings on ESG data providers as well as recognizes the efforts of individual ESG researchers and analysts.
An ESG investor should begin by properly categorizing the various types of data available based on the information they seek. We have developed a three-tiered framework that allows investors to better understand the different types of ESG ratings data:
Fundamental. This category includes ESG data providers that collect and aggregate publicly available data (typically from company filings, company websites, and nongovernment organizations, or NGOs) and disseminate these data to end users in a systematic way. Typically, these providers do not have a ratings methodology and do not provide overall company ESG scores. The user of the data must determine the materiality of the data and develop their own methodology when constructing a portfolio. Examples of fundamental providers are Refinitiv (formerly, Thomson Reuters) and Bloomberg.
Comprehensive. This category includes ESG data providers that utilize a combination of objective and subjective data covering all ESG market segments. Typically these data providers will develop their own ratings methodology and combine publicly available data as well as data produced by their own analysts through company interviews/questionnaires and independent analysis. These providers use hundreds of different metrics across environmental, social, and governance concerns and apply an established, systematic methodology to determine a company’s overall ESG score.
In addition, these companies often scrub data from public websites and newspapers to supplement company ESG ratings with additional information, such as controversy assessments related to company-specific issues. They also produce country and industry trend reports. Examples of comprehensive providers are MSCI, Sustainalytics, Vigeo Eiris, ISS, TruValue Labs, and RepRisk. TruValue Labs and RepRisk are part of a growing field of algorithmic-focused ESG data providers and rely less heavily on traditional ESG analysts to create company scores.
Specialist. This category includes ESG data providers that specialize in a specific ESG issue, such as environmental/carbon scores, corporate governance, human rights, or gender diversity. Given these providers’ expertise in a specific field, they are useful for investors whose objective is to tackle a particular issue and improve in that domain. Examples of these providers are TruCost (now owned by S&P Global), the nonprofit Carbon Disclosure Project (CDP), and Equileap (gender equality data). Given the vast amount of ESG data the comprehensive providers acquire and maintain, they often can provide specialized data to end users.
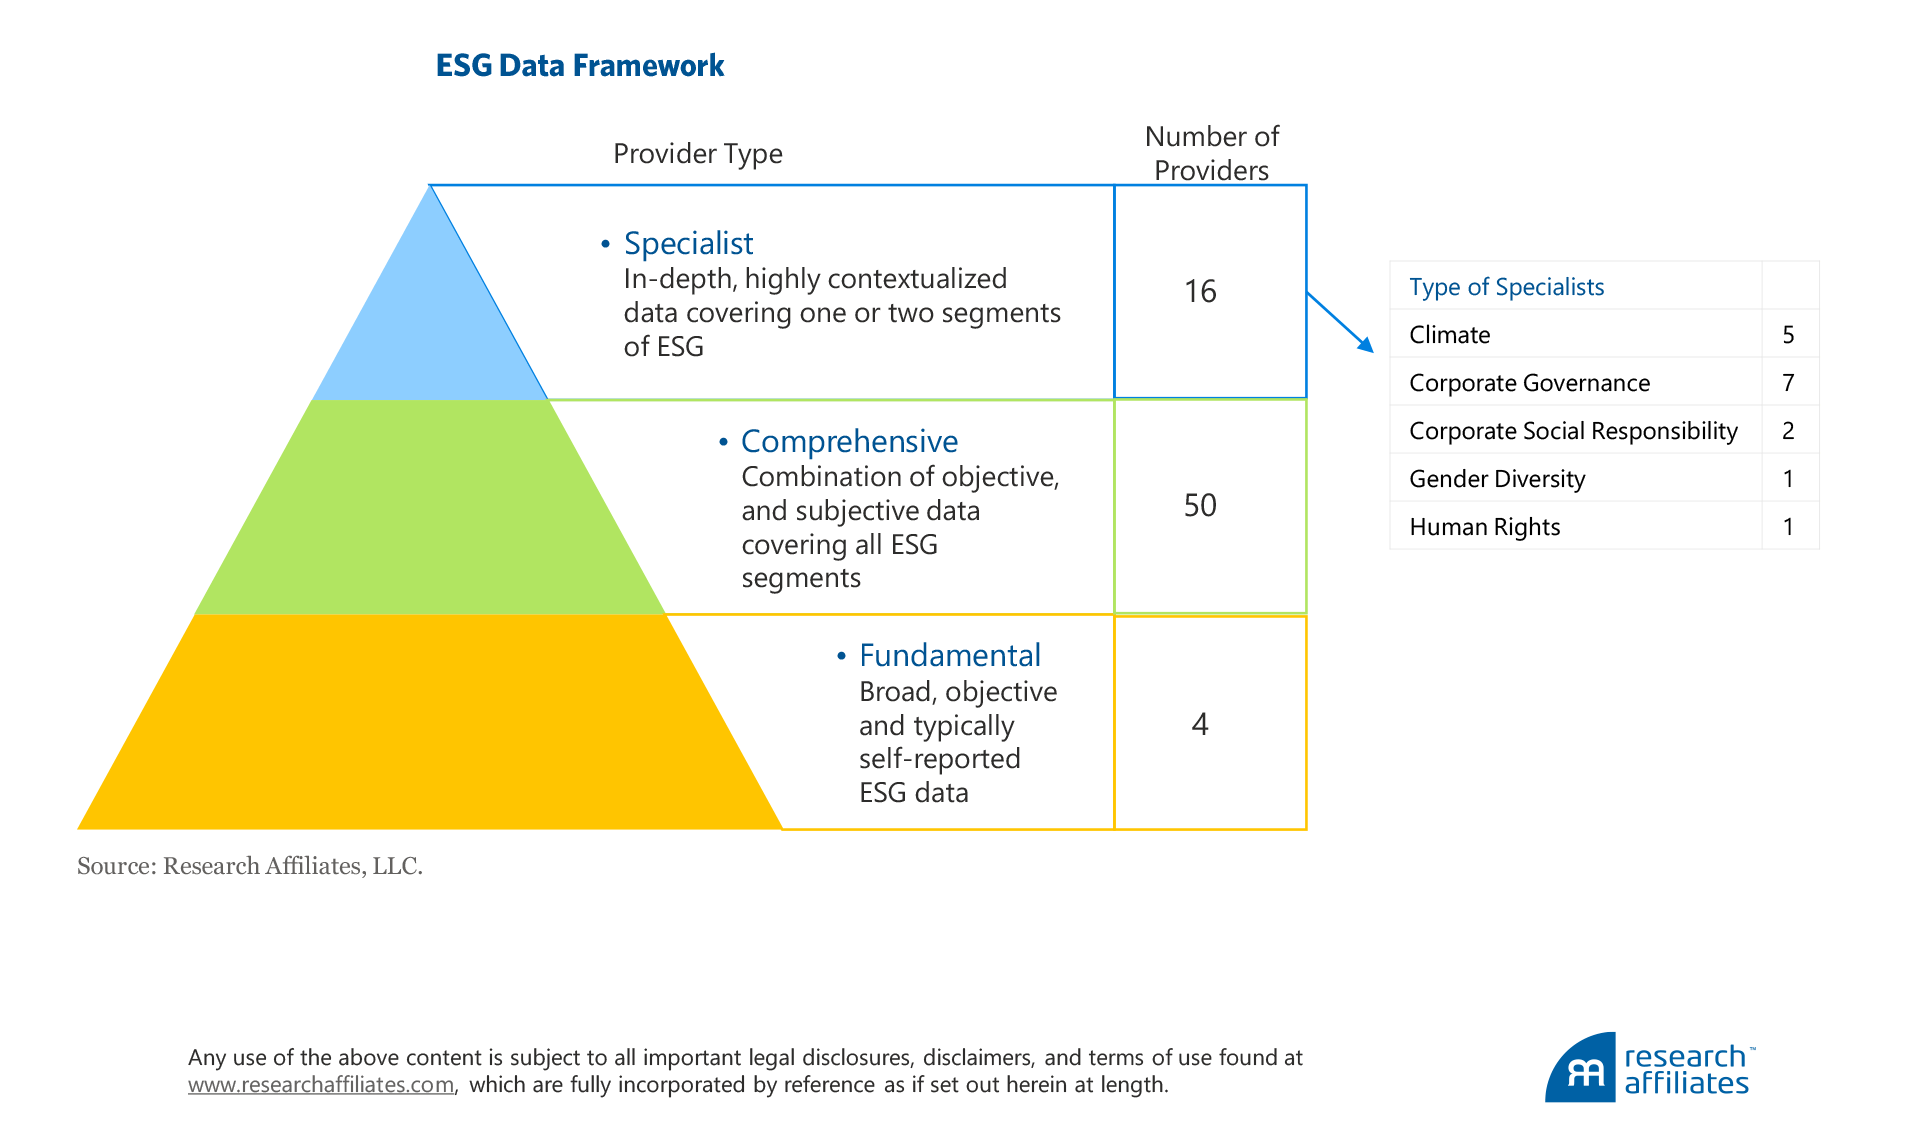
Based on our study of current ESG ratings providers, the majority are in the comprehensive category. Some of these providers, such as MSCI, Sustainalytics, and Vigeo Eiris, rate companies globally, while others focus on comprehensive ESG ratings data for a specific country or region. The Sustainable Investment Research Institute (SIRIS), for example, provides comprehensive ESG ratings data from companies in the Asia Pacific region. In the specialist provider category, the majority of ratings providers focus on climate-related concerns.
Data Comparison: An In-Depth Example Using the Portfolio Construction Approach
Data vendors’ rating systems can vary dramatically, which leads to drastically different ratings for the same company. Berg, Koelbel, and Rigobon (2019) illustrate that discrepancies in ratings between providers are primarily driven by measurement (i.e., what metrics are used to assess different ESG attributes), followed by differences in scope (i.e., what attributes are being assessed), and lastly by weight (i.e., the level of materiality the ratings provider assigns to each attribute).
In contrast to Berg, Koelbel, and Rigobon’s detailed analysis, which focuses on why ESG ratings differ, we focus on how the ratings discrepancy impacts investors in a meaningful way.
To vividly illustrate this point, we analyze two popular comprehensive ESG data vendors, which we call Provider 1 and Provider 2.5 We construct two separate portfolios, one in the United States and one in Europe, using ESG ratings data from both providers. We then examine the differences in performance and portfolio characteristics of the US/Provider 1 and US/Provider 2 portfolios as well as the Europe/Provider 1 and Europe/Provider 2 portfolios.
We follow a simple portfolio construction approach. First, we rank all the publicly traded companies by market capitalization from large to small, then define the starting universe as the top 86% of companies by cumulative market capitalization. Next, we rank each company by its ESG score, from high to low (companies without an ESG rating receive a score of zero), and select the top 50% of companies by cumulative market capitalization. The remaining constituents are then market capitalization–weighted and the portfolio is rebalanced annually at the beginning of each calendar year. Our simulations start from July 2010, when the data are available from both providers. We then repeat the process for individual environmental (E), social (S), and governance (G) scores to examine the effects on the individual ratings.
Although the data are available only over a short period, both providers have relatively broad coverage in the cross-section. For example, Provider 1 covers roughly 1,900 US companies and Provider 2 covers 2,100 US companies, representing 97% and 99%, respectively, of the US market by capitalization.
In the roughly eight-year period we analyze, the two headline portfolios have a performance dispersion of 70 basis points (bps) a year in Europe (9.4% versus 8.7%) and 130 bps a year in the United States (14.2% versus 12.9%), which translates into a cumulative performance difference of 10.0% and 24.1%, respectively, over the full period! Quite a noticeable difference for two strategies with an identical portfolio construction process. The tracking error between the two portfolios is approximately 1.5% in the United States and 2.2% in Europe with an active share of 20% and 30%, respectively, as of June 30, 2018.
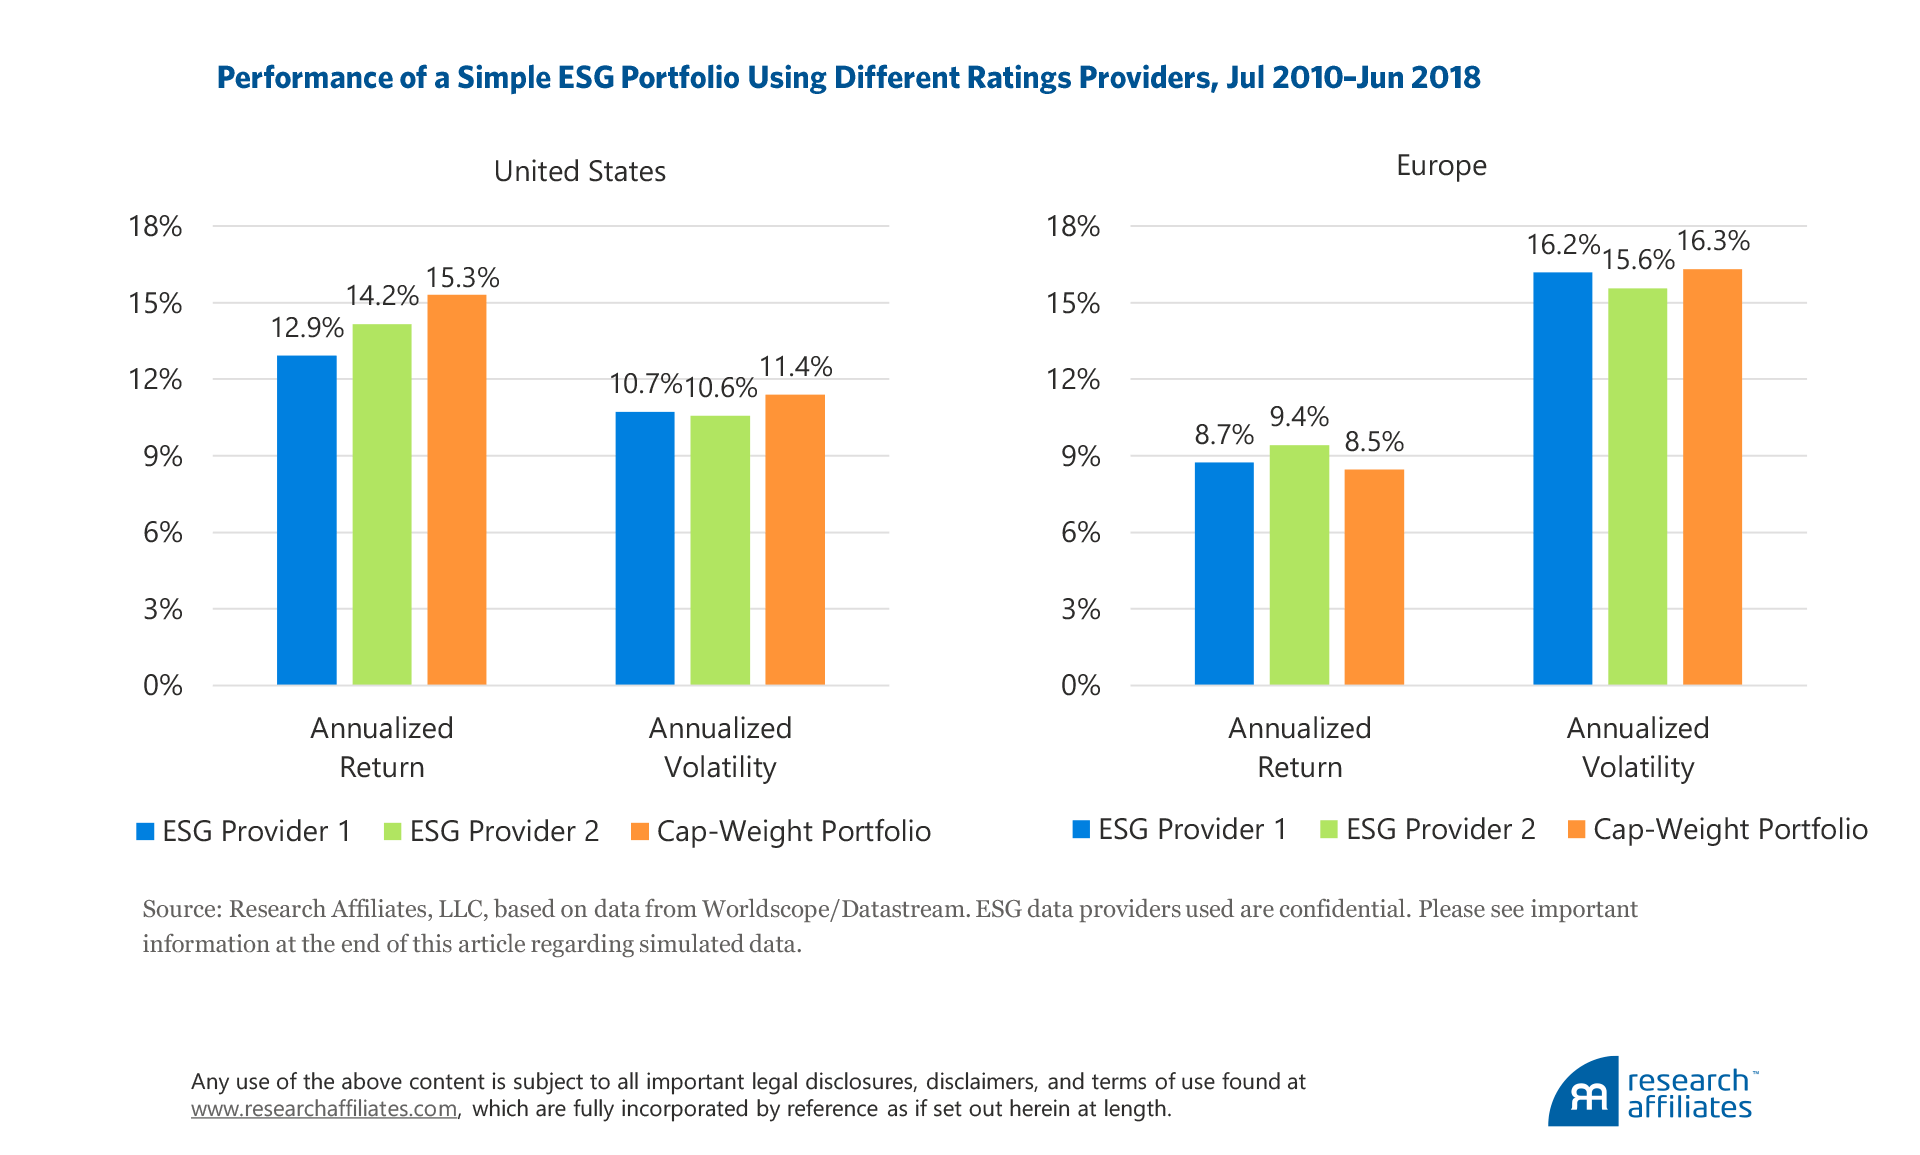
Interestingly, both US portfolios underperformed the simulated cap-weighted benchmark, and both Europe portfolios outperformed the simulated cap-weighted benchmark. This is unsurprising given the short history, and we would caution against making any assertions as to the performance advantage of ESG investing or lack thereof. Similarly, our purpose is not to draw any conclusions regarding the investment efficacy of ESG Provider 1 versus ESG Provider 2 based on the short-term performance.
We observe an even greater performance dispersion in the portfolios constructed using individual environmental, social, and governance scores. The performance differences range from 70 bps a year to 220 bps a year, with the biggest dispersion and tracking error coming from the governance-based strategies in both geographic regions. The noticeable difference between the two providers’ performance measures, despite an identical portfolio construction process, indicates different stock selections arising from the different ratings each company receives.
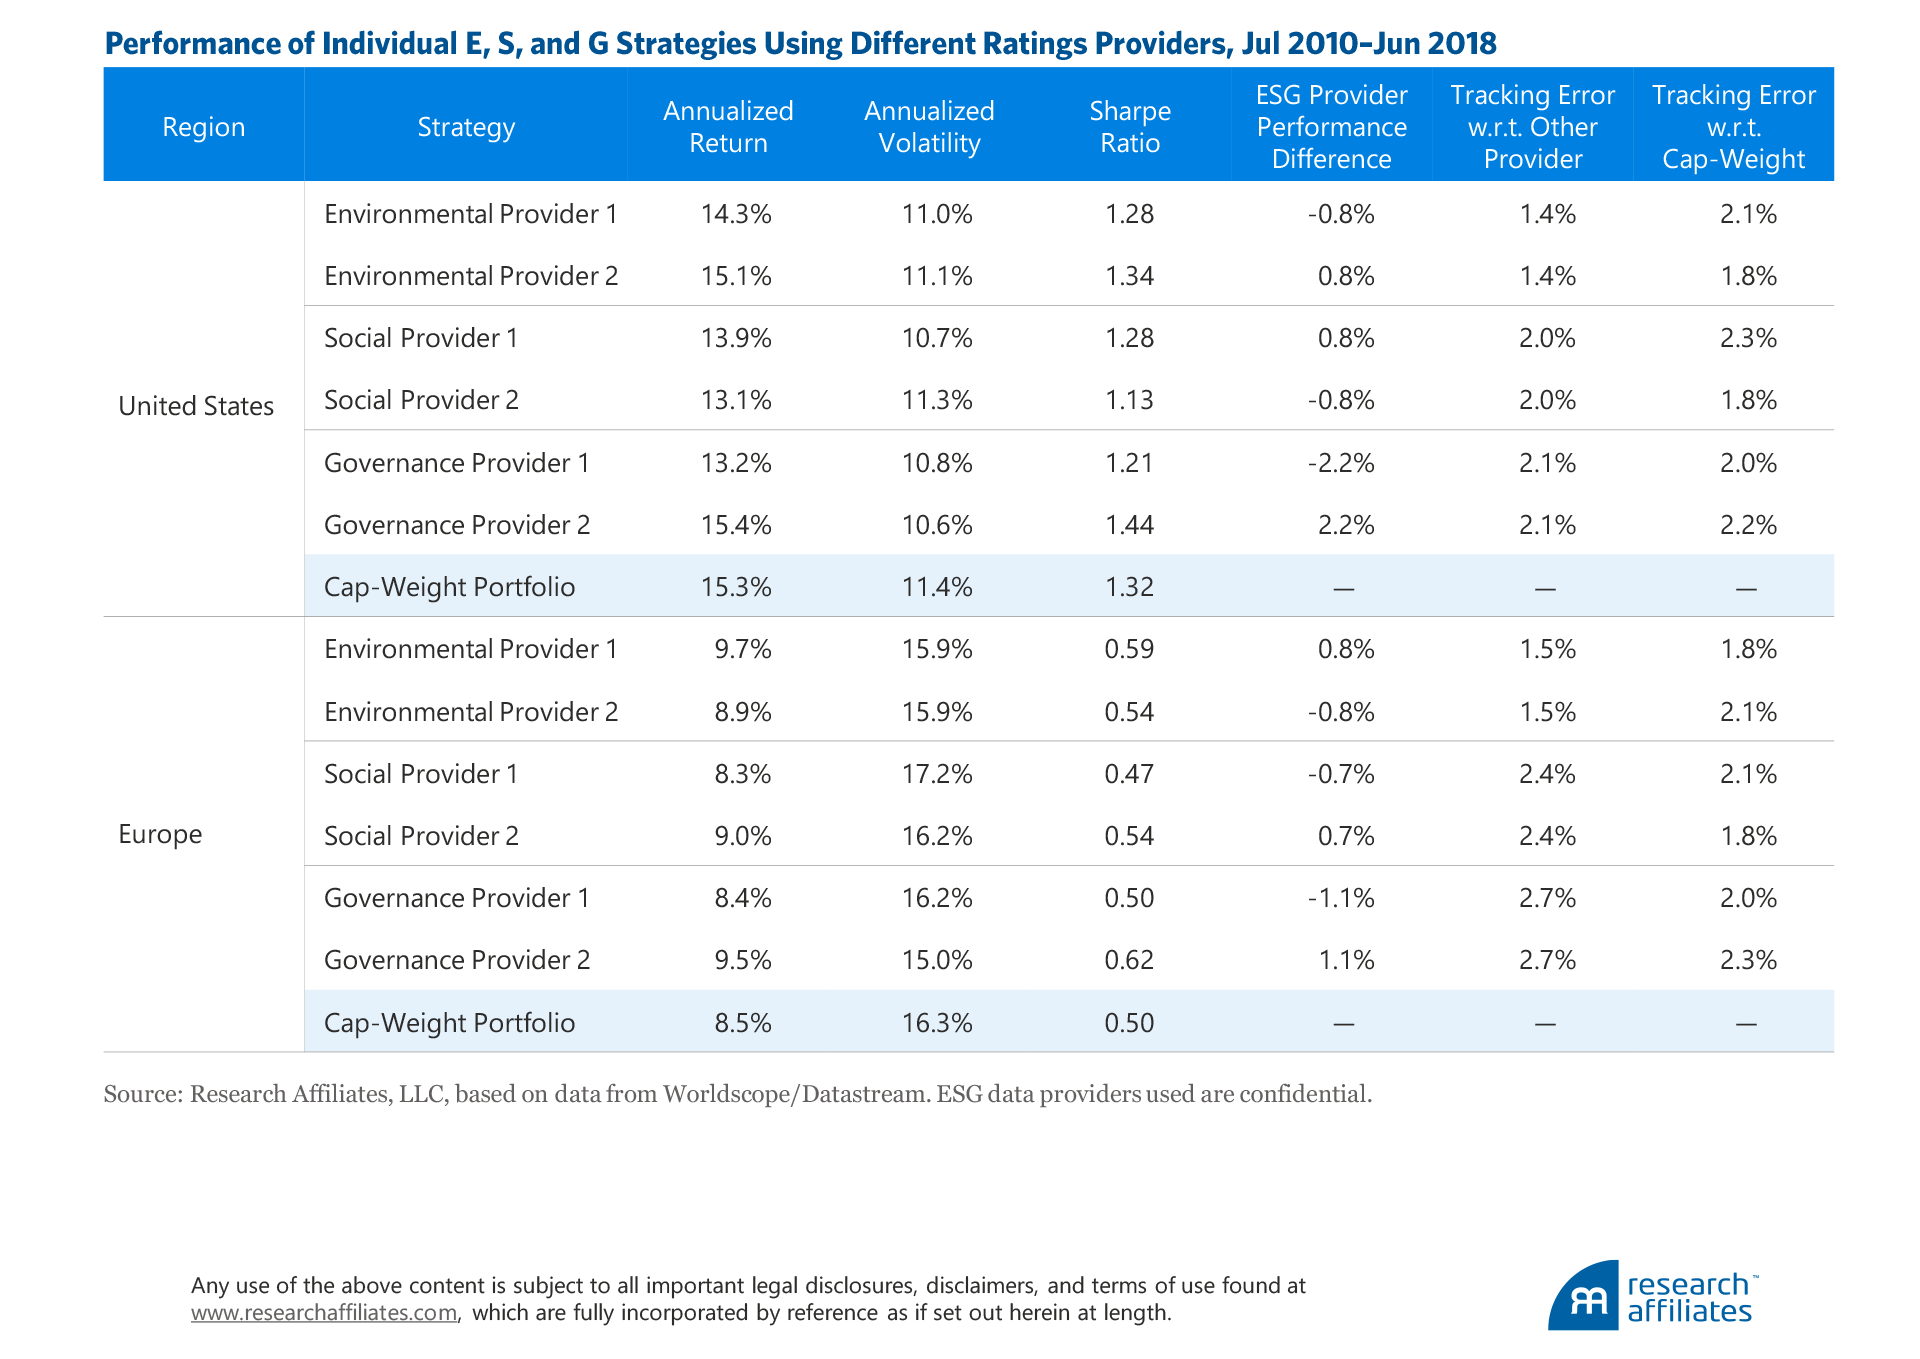
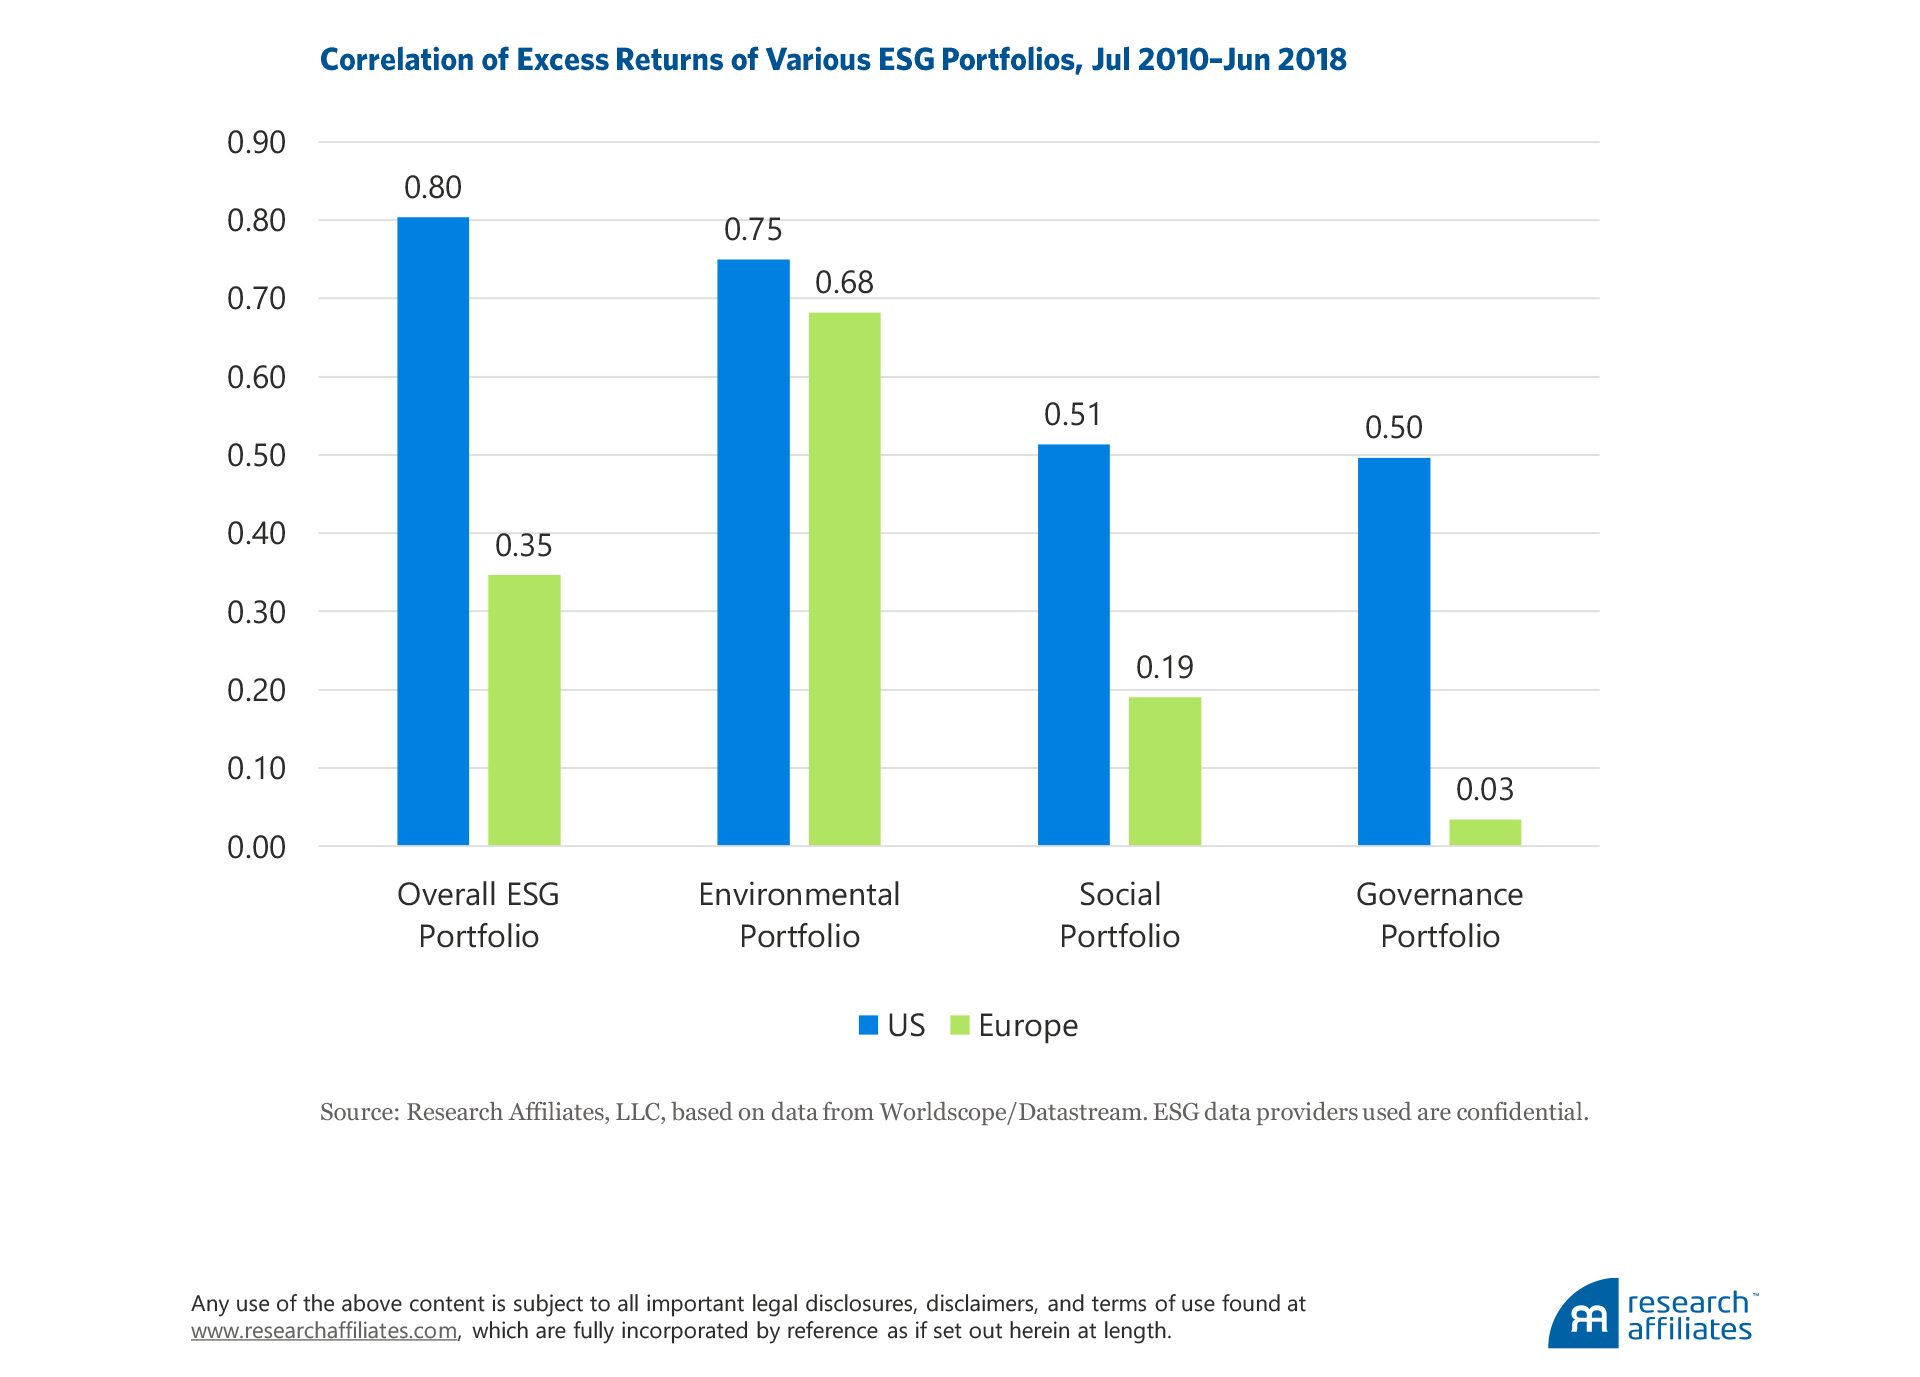
The excess returns of the portfolios yield surprisingly low correlations, especially when the paired portfolios based on individual scores for environmental, social, and governance characteristics are compared separately. The correlation of the excess returns of the US environmental, social, and governance portfolios are only 0.75, 0.51, and 0.50, respectively. The correlations of the excess returns of the Europe environmental, social, and governance portfolios are even lower at 0.68, 0.19, and 0.03, respectively. The two governance portfolios in Europe have almost no relationship at all!
After removing the market exposures of these portfolios, they produce quite different outcomes for investors even though they are meant to capture the same ESG exposure. In the United States, a portfolio selecting the top 50% of stocks with the highest social score based on Provider 1’s data produces excess returns that have a correlation of only 0.51 with the portfolio selecting the top 50% of stocks based on Provider 2’s social score. This correlation is actually lower than the correlation of 0.59 between Provider 1’s socially conscious portfolio and Provider 2’s governance portfolio!
The social and governance ratings encompass different corporate traits. Social scores typically take into account company diversity, labor standards, and how the company manages its relationships with its stakeholders and surrounding communities, whereas the governance rating captures board composition, executive compensation, internal controls, audit committee structure, lobbying, political contributions, and so forth. At a higher and broader level of ESG rating, however, data providers tend to exhibit better agreement.
Why do portfolios constructed based on seemingly similar criteria have such lowly correlated or unrelated investment outcomes? Looking deeper into the details of the individual metrics we use for sorting and selecting the stocks to construct our portfolios provides a clearer picture. Individual company ratings for environmental, social, and governance characteristics from the two different providers are quite different.
The correlation of ESG rating between the various combinations of pairs ranges from 0.38 to 0.72, with the lowest correlations in the governance ratings for both the US and Europe portfolios. ESG ratings consider hundreds of metrics, with many of them qualitative in nature. Because some metrics are included by one provider but not the other, translating a qualitative metric into a numerical quantity largely depends on the provider’s algorithm. Another consideration is that one ratings provider may place a greater weight on a particular metric versus another.

We can illustrate this point more clearly by diving deeper into individual stock examples.
Individual Stock Examples
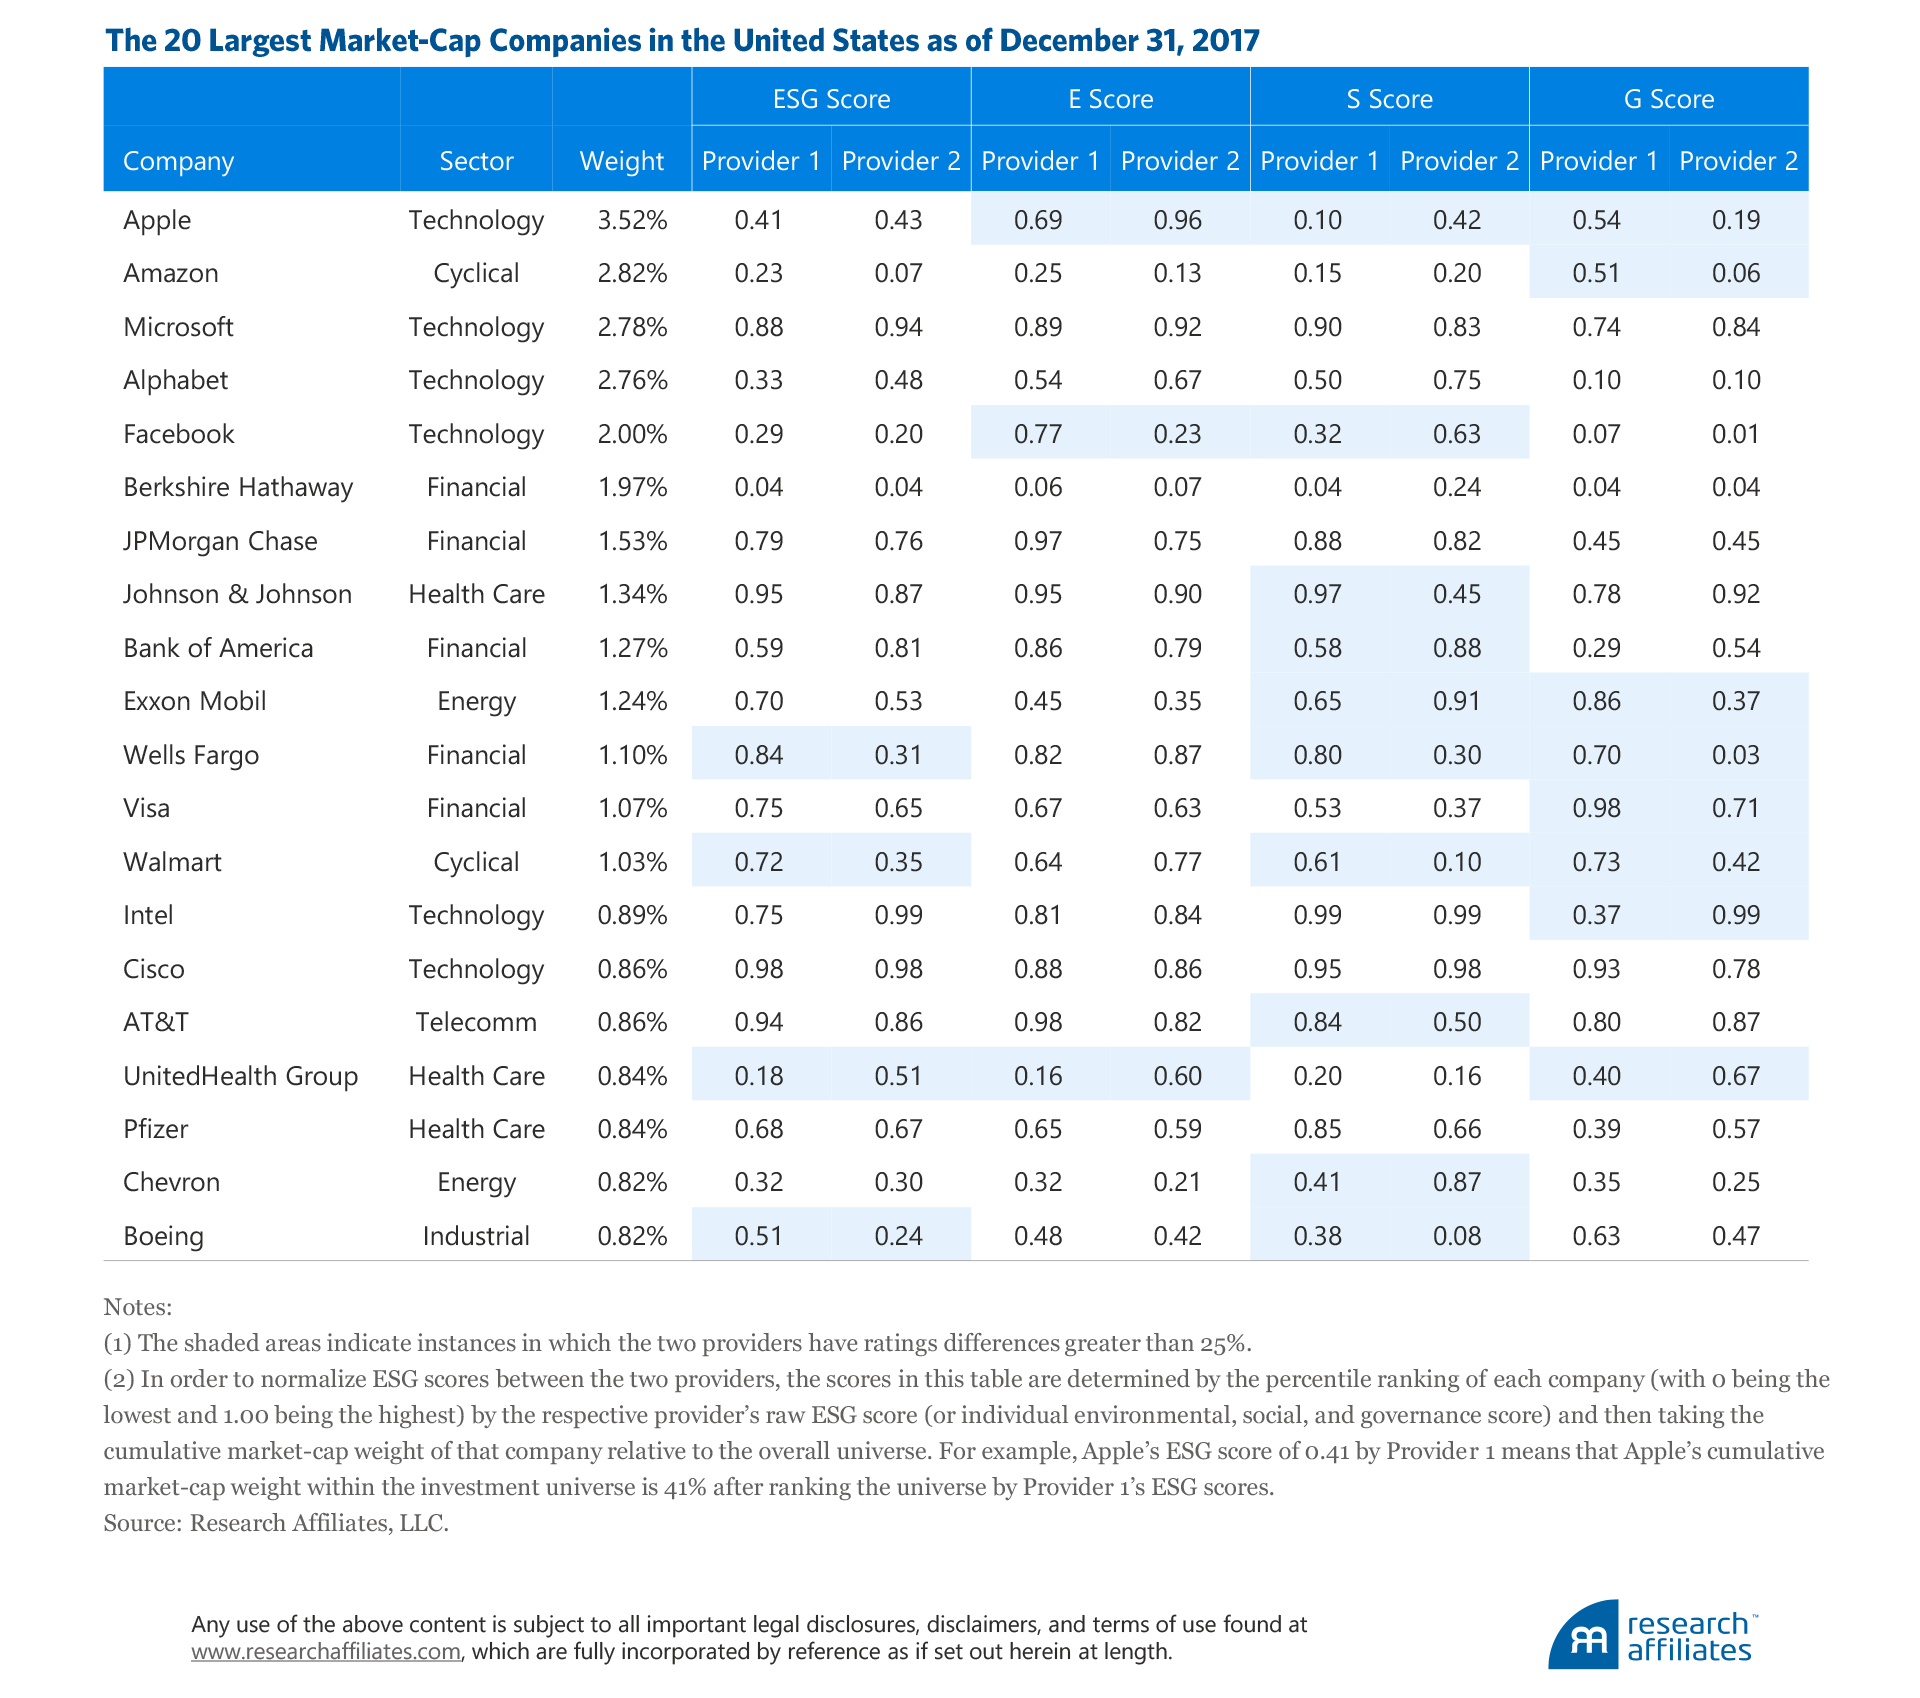
We examine the 20 largest US companies by market capitalization as of December 31, 2017, in terms of their overall ESG rating and individual environmental, social, and governance ratings from Provider 1 and Provider 2. Wells Fargo stands out the most in terms of how different the two ESG ratings providers assess the company on every single dimension except the company’s environmental score. The large difference in the company’s social and governance ratings leads to a more favorable overall score by Provider 1 than by Provider 2.
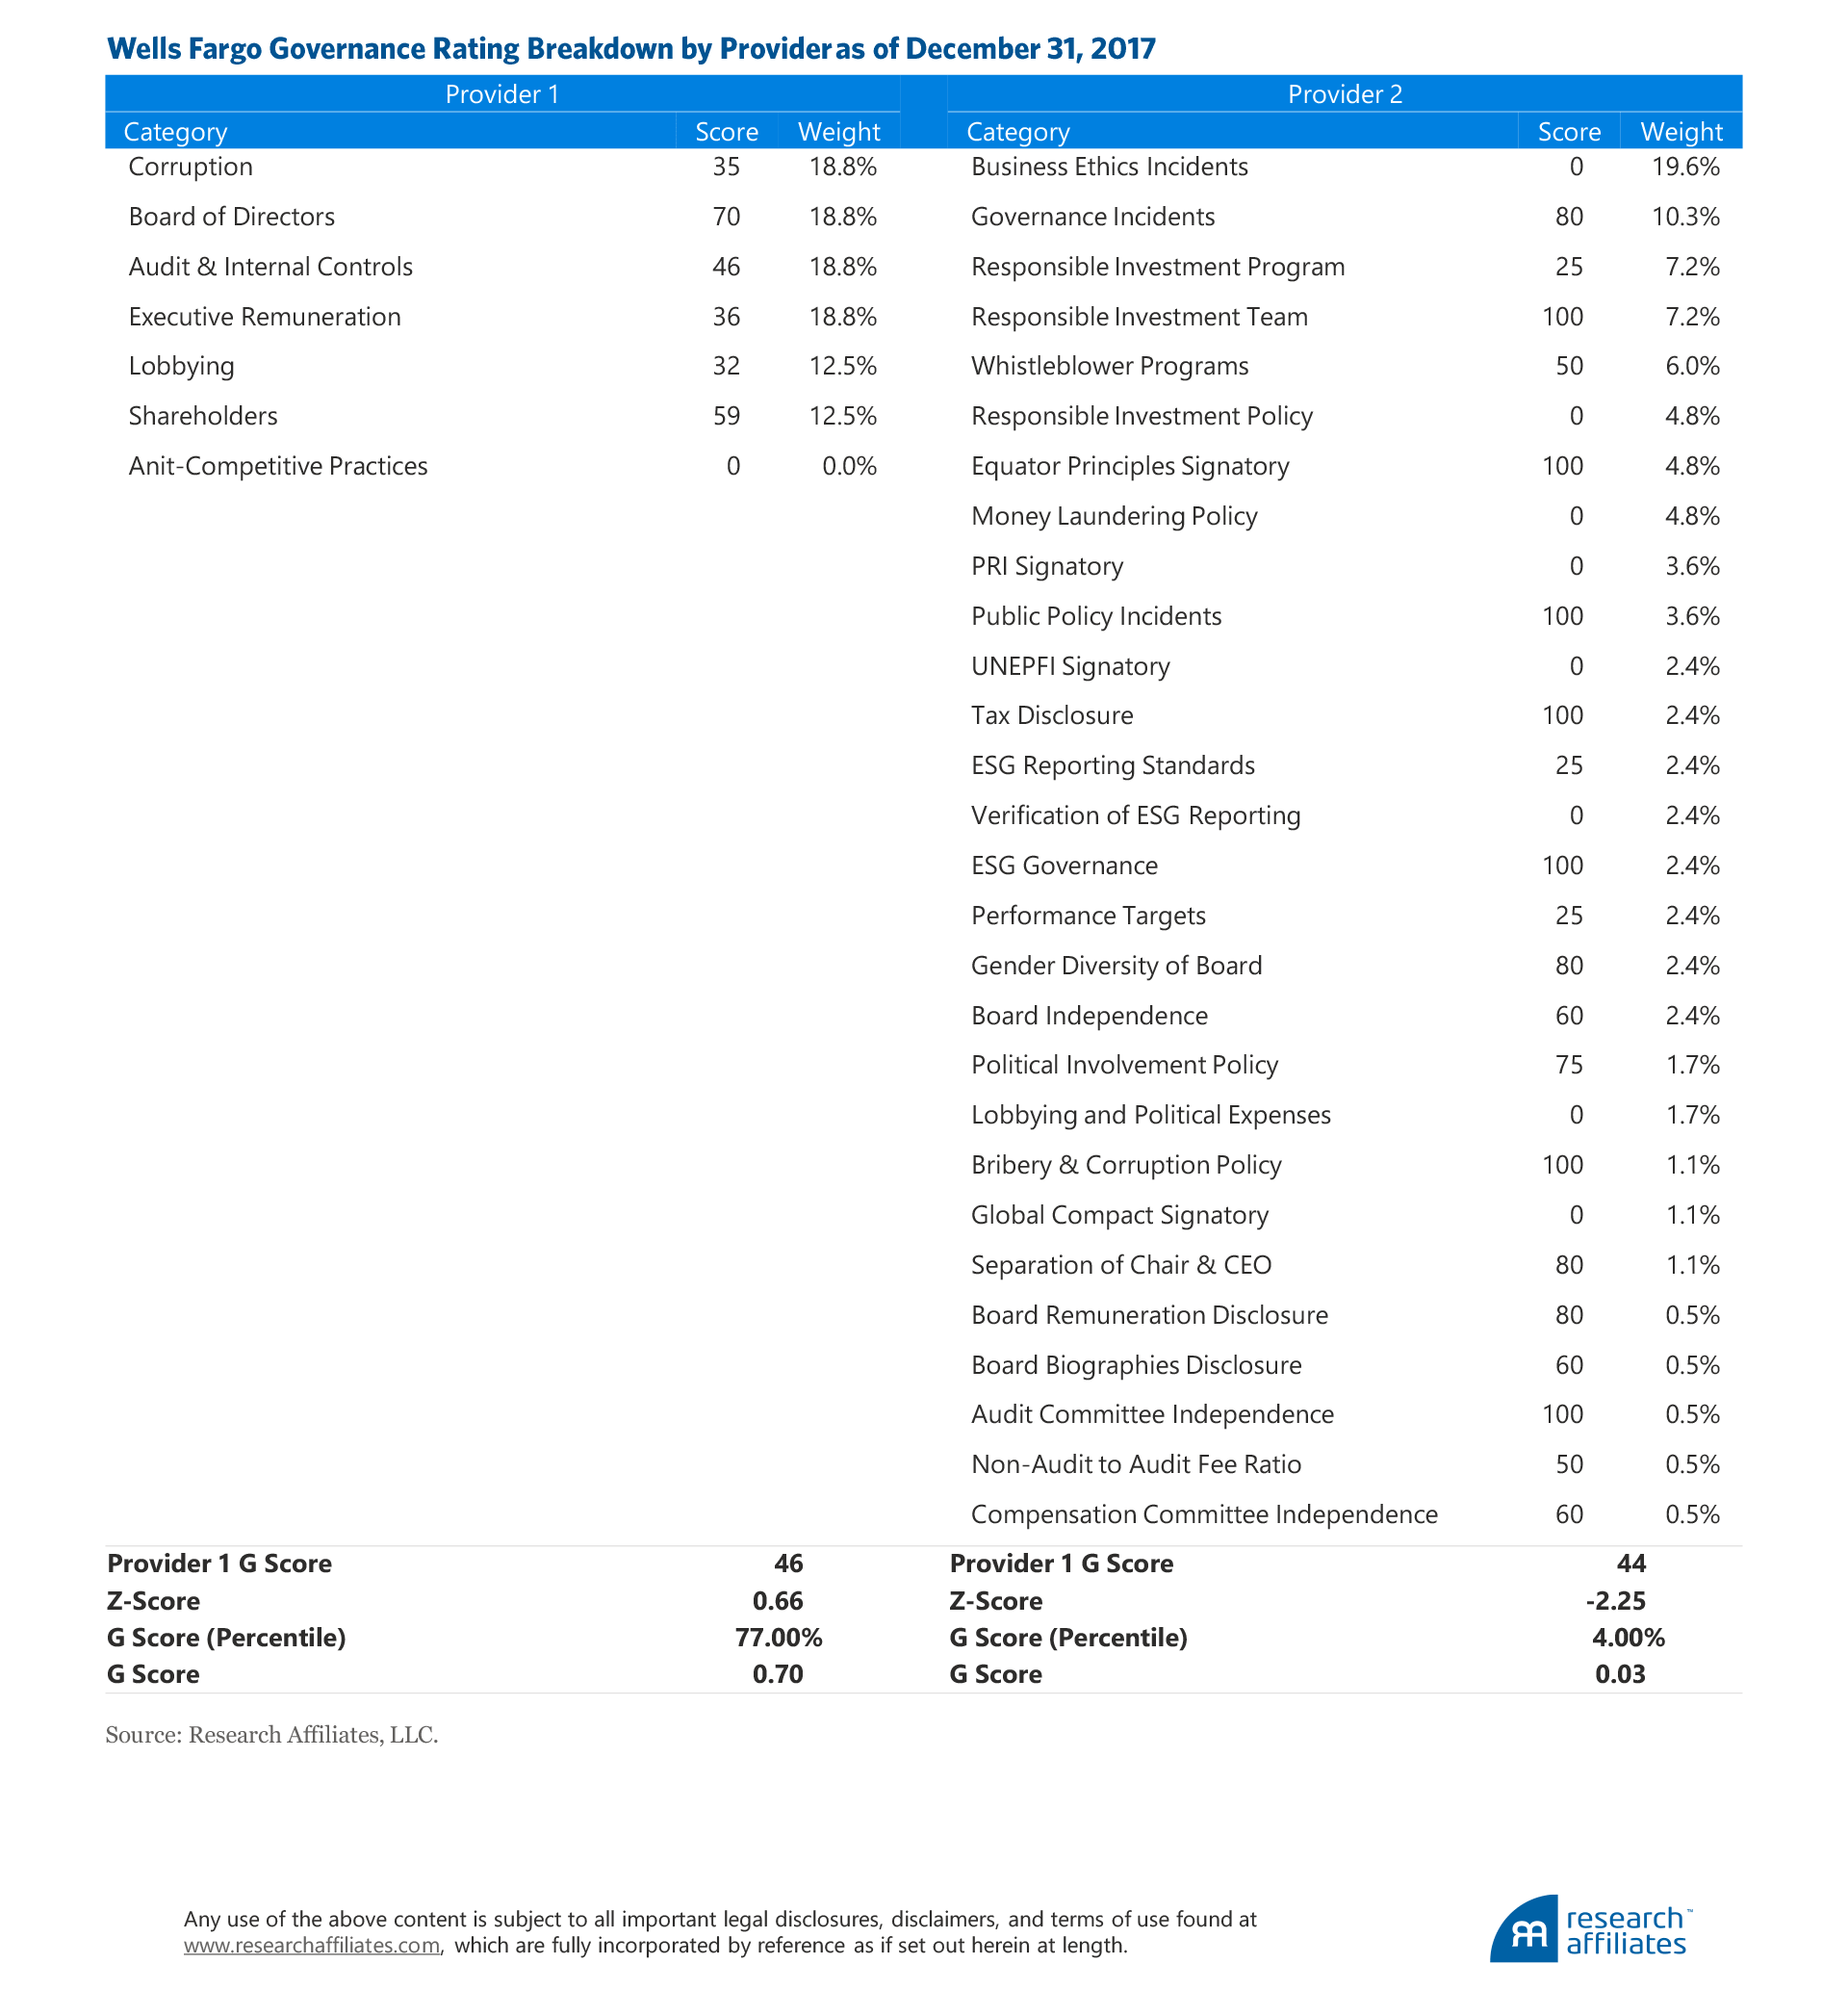
To illustrate how ESG ratings providers can evaluate the same company very differently, let’s look more closely at the governance score for Wells Fargo and decompose it to its underlying metrics. The first thing we observe is the difference in the metrics used by the two providers to evaluate the governance practices of Wells Fargo. At first pass, it appears that Provider 1 takes a much narrower view of governance, listing only 7 categories of assessment, while Provider 2 assesses governance along 28 categories. If we dig deeper into Provider 1’s methodology, however, Provider 1 also assesses many of the metrics used by Provider 2 as themes within each of its 7 categories. For example, Provider 2 separates out the OSHA Whistleblower Protection Programs a company has in place, while Provider 1 includes this as a theme when determining the corruption rating of a company.
Provider 1 ranks Wells Fargo in the top-third by governance in their universe, whereas Provider 2 ranks it in the bottom 5%. One of the biggest contributors to the ranking difference comes from the assigned score of zero on “Business Ethics Incidents” by Provider 2, which accounts for nearly 20% of the aggregate score calculation. These data were collected in 2017 when Wells Fargo was in the middle of their very public fake account sandal. Highlighting a difference in methodology, the Wells Fargo account scandal would fall under Provider 1’s “Information to Customers” category, reflected in a company’s social score.
Another example is Facebook. How different vendors calculate its environmental score can place it in the top decile of the universe or below average. Provider 1 only assigns positive weights to three categories based on its assessment of sector relevance; Facebook was classified as an information technology company in 2017. It is easy to understand how “Environmental Strategy” by Provider 1 maps almost perfectly to “Environmental Policy” by Provider 2, although the weight assigned by Provider 1 is 10 times as high as that assigned by Provider 2. It becomes fuzzier when we try to map “Minimizing Environmental Impacts from Energy Use” to “Carbon Intensity.” The two categories seem to be related, but by how much is not clear.
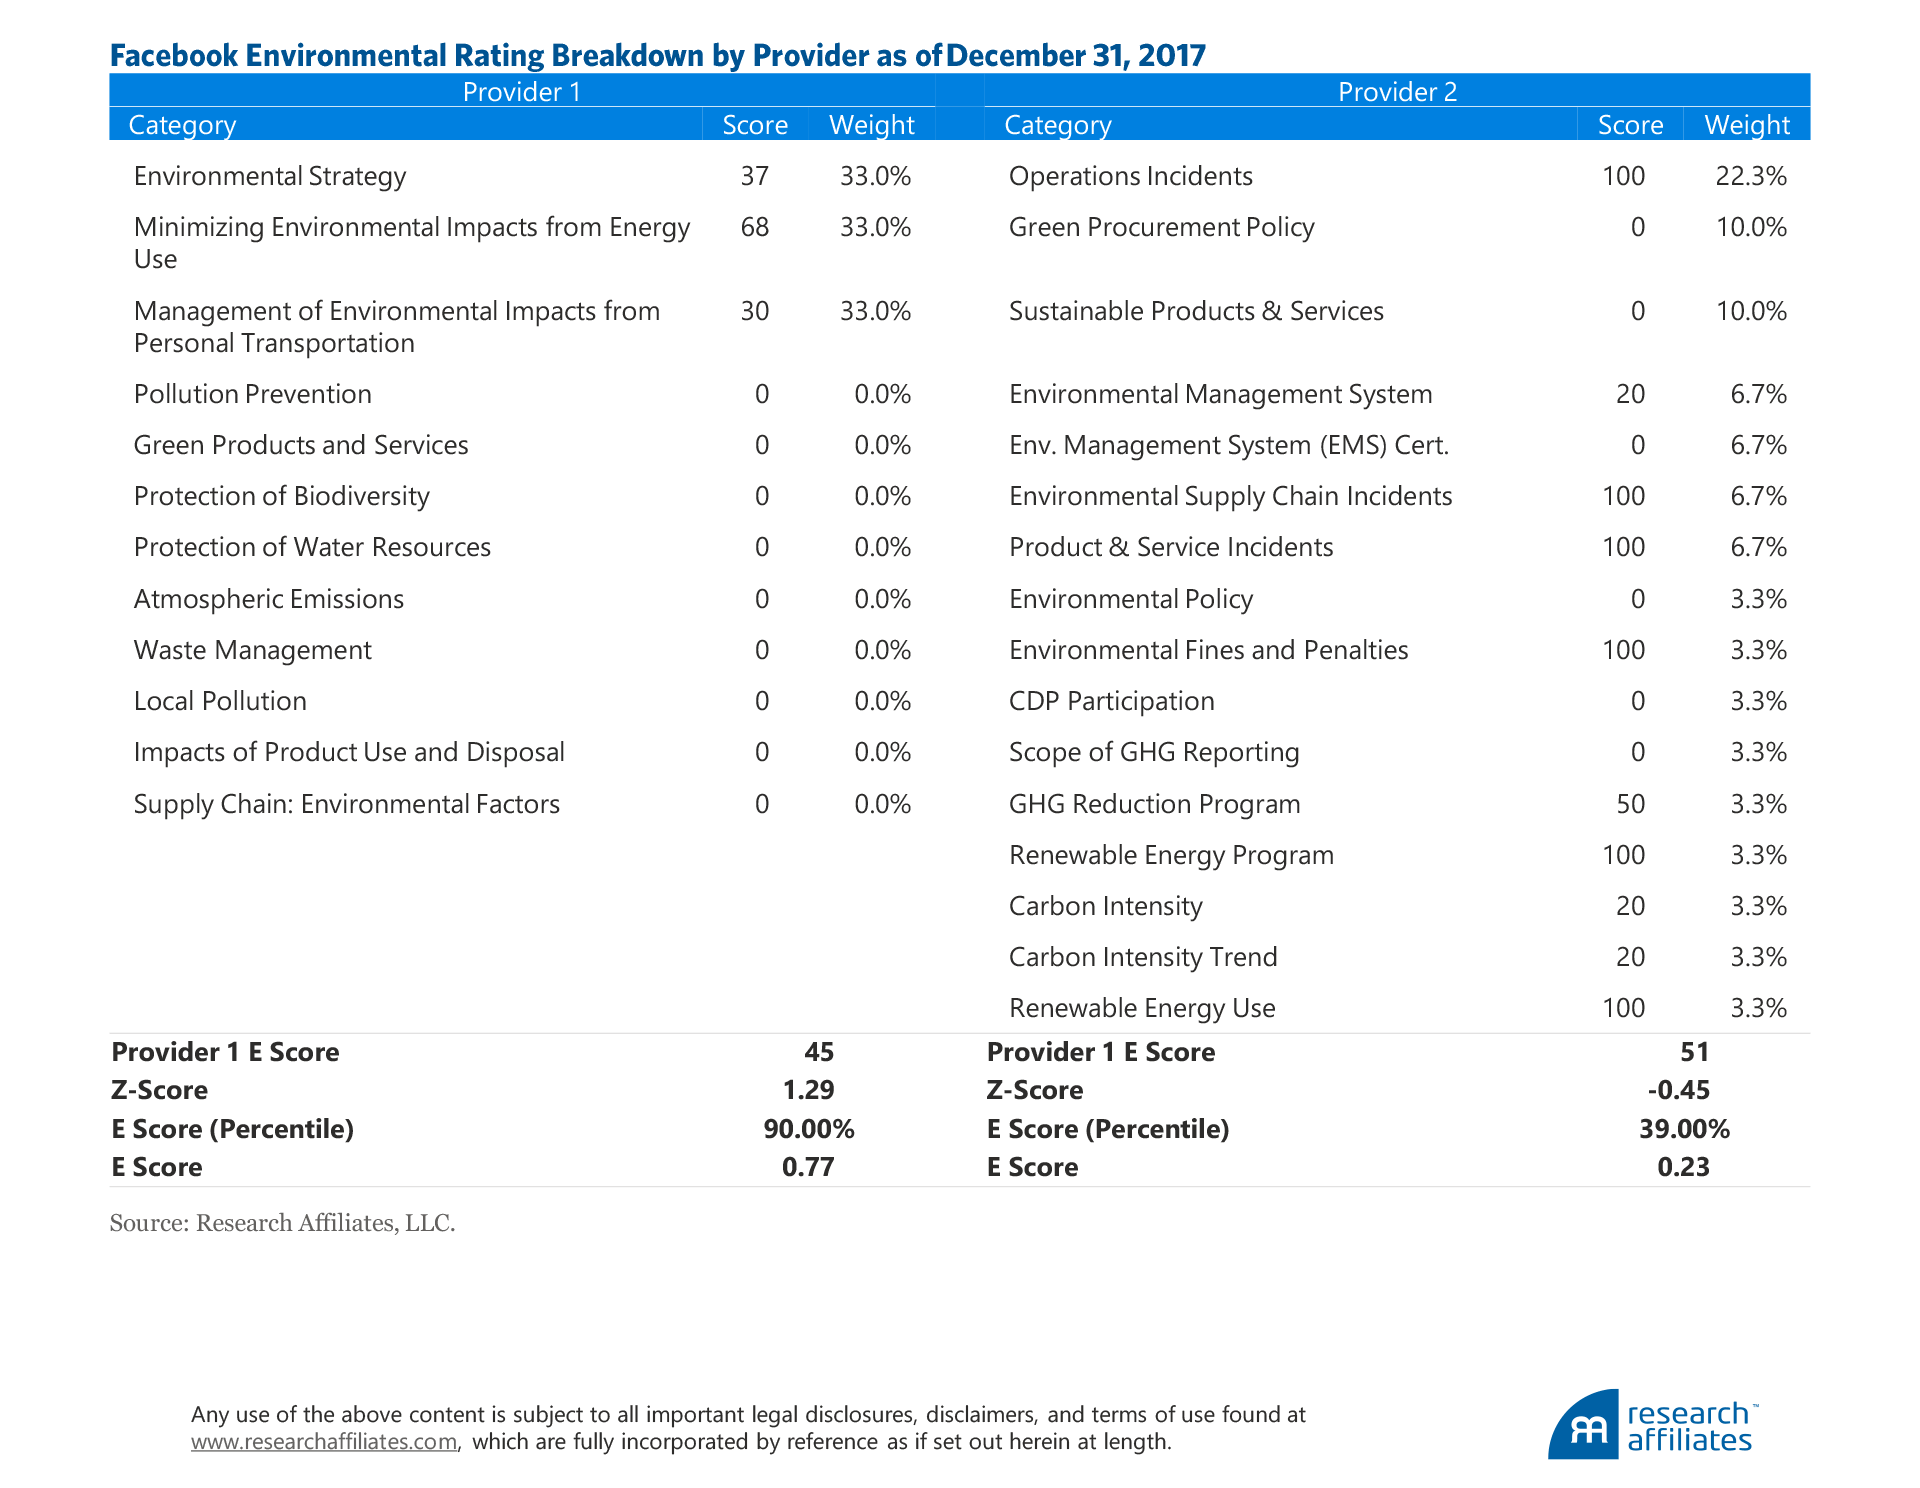
Provider 1 puts a one-third weight on “Management of Environmental Impacts from Personal Transportation,” which does not seem to be captured in any of Provider 2’s 16 categories, and how it is measured is also unclear. Provider 2 gives a large weight to “Operations Incidents,” which does not seem to be covered by Provider 1. The bottom line is that the two data vendors are including distinctively different sets of metrics to gauge the environmental characteristics of Facebook, assigning different weights and different evaluations of similar metrics, which results in Facebook being rated as a top firm by one provider and a below-average firm by the other provider.
Our comparison of Wells Fargo and Facebook demonstrates clearly that each ratings provider takes a unique approach based on its perspective, varying both the particular metrics they evaluate to varying how they categorize the metrics among the individual environmental, social, and governance criteria. When assessing a ratings provider, investors must look beyond the basics of a provider’s coverage and history to examine the methodology the provider uses in its rating process as well as considering the methodology’s alignment with the investor’s own ESG preferences.
Conclusion
ESG is a highly heterogeneous space. Investors, asset managers, and ESG ratings providers each have their own preferences about which issues are important to address and how to address them. Investors may exhibit a preference for low carbon solutions, diversity-oriented strategies, or a holistic approach to reward companies with high overall ESG scores. Asset managers design investment strategies with the dual objective of achieving those preferences while retaining their intended investment outcome. ESG ratings providers play an increasingly important role in the investment process by providing their assessment of companies across various ESG metrics.
Many challenges face investors who are choosing an ESG ratings provider because of the sheer number and different types of providers available and the lack of correlation and consistency in ratings produced by the different providers. As we have demonstrated in this article, even two well-known, well-established providers with robust methodologies can assign different ratings to the same company, but that hurdle alone should not prevent investors from considering or adopting an ESG strategy. We believe that investors should instead study the various ESG ratings providers’ methodologies to select the provider whose ratings align more closely with the investor’s own views on ESG.
Please read our disclosures concurrent with this publication: https://www.researchaffiliates.com/legal/disclosures#investment-adviser-disclosure-and-disclaimers.
Endnotes
- The “Great Expectations for ESG” report is a global survey of 461 asset owners and asset managers conducted by BNP Paribas in early 2017.
- Data compiled by reviewing organizations listed as service providers on the Principles for Responsible Investment website (unpri.org), SRI-Connect.com, and through web searches.
- “Rate the Raters 2019: Expert Survey Results” by Wong, Brackley, and Petroy.
- “Independent Research in Responsible Investment Survey 2019” results.
- The purpose of our study is to examine the different investment outcomes that arise from the choice of an ESG ratings provider and not to determine if one provider is better than another. Therefore, we are omitting the names of the data providers included in our study.
References
Berg, Florian, Julian Koelbel, and Roberto Rigobon. 2019. “Aggregate Confusion: The Divergence of ESG Ratings.” MIT Sloan Working Paper 5822-19. MIT Sloan School of Management (August).
BNP Paribas. 2017. “Great Expectations for ESG: What’s Next for Asset Owners and Managers?”
Douglas, Elyse, Tracy Van Holt, and Tensie Whelan. 2017. “Responsible Investing: Guide to ESG Data Providers and Relevant Trends.” Journal of Environmental Investing, vol. 8, no.1: 92–114.
SRI-Connect. 2019. “Independent Research in Responsible Investment Survey 2019.” SRI-Connect.com.
Wong, Christina, Aiste Brackley, and Erika Petroy. 2019. “Rate the Raters 2019: Expert Survey Results.” SustainAbility.com (February).

