Indicators across four channels—the macroeconomy, credit conditions, capital markets, and politics—are all flashing warning signs. These escalating vulnerabilities were moving the markets closer to an inflection point, even before the novel coronavirus entered the picture.
Warning signals for the US capital markets include the inverted yield curve; unanticipated repo market stress, growing percentage of BBB-rated debt, and steadily increasing numbers of zombie companies; historically high CAPE ratios; and the uncertainties the 2020 US presidential election holds.
An informed investor acknowledges the challenges and nuances behind assessing an asset’s worth in different parts of the business cycle. The next turn may be toward recession, possibly ending the positive equity market trajectory experienced over the last decade. Now may be an opportune time to rebalance away from long-outperforming US growth stocks into cheaper and higher-yielding US and international value stocks.
We’ve all heard the maxim “when the US sneezes, the world catches a cold.” In the last few weeks, the truth in this saying has made itself evident, although in this case, China did more than sneeze. In our interconnected world, when a highly contagious disease such as the novel coronavirus emerges, the damage, both human and economic, can quickly take on a global scale. Globalization provides economic leverage that can cause the gearing to rapidly spin out of control across supply chains, and downside risk suddenly becomes reality. Could this new virus be the catalyst to a Minsky moment?
We view the…market turmoil as creating more risk to growth stock prices than to the broader market.
”Even before COVID-19 entered the picture, we were already concerned about the year ahead. Indicators across four channels—the macroeconomy, credit conditions, capital markets, and politics—are flashing warning signs. These escalating vulnerabilities, moving the markets closer to an inflection point, were worrisome enough, but the coronavirus epidemic may be the tipping point that triggers the what’s-this-worth question asked by many investors all at once. The creation and spread of an unsettling narrative (Shiller, 2019)1 could precipitate a self-fulfilling crisis (Merton, 1948).2
The last 10 years have produced a growth-dominated, monetary-policy-fueled US bull market—the longest in the nation’s history—that almost no one saw coming (Wang, 2019). Remember what it was like back then? A decade ago we had just realized that money market funds could “break the buck.” That’s the kind of thing you don’t want to try at home. It tests your faith in the system on a good day. Credit markets were frozen like a new Ice Age had descended on the capital markets. The S&P 500 Index flashed the “sign of the beast,” and investment banks went bust over various weekends. Those were the final symptoms of serious trouble, suggesting to some investors that the patient could be terminal and that we didn’t have a financial system we could lean on the next day.
Move the clock forward by a decade. By the beginning of 2020, the US economy had stretched into a record-setting growth cycle as capital-market asset prices steadily trended upward. Against this backdrop, few investors appeared worried about the intrinsic value of their investments. When “bad times” are far enough in the rearview mirror, complacency reigns and the price-setting mechanism that prevails in the capital markets tends to boil down to a simple question: Is the next investor in this asset willing to pay the recently struck price or even bid it up? Adopting this mentality is far easier and more comfortable than 1) assessing the worth of a series of uncertain future cash flows and its residual value today, and 2) maintaining the margin-of-safety discipline to put protection in place before the risks become self-evident.
Unfortunately, as history has shown, this behavior tends to encourage capital allocation to enterprises and securities that do not deserve funding, leading to the dangerous territory of NINJA asset pricing reminiscent of the “no income, no job application” granting of mortgage loans.3 Directing capital to undeserving entities at scale and for an extended period of time not only has negative societal implications, but also has precarious investment implications. Inevitably, an economic shock or catalyst shakes investors out of their complacency by forcing the fateful question: “Oh my! What’s this stuff really worth?”
Let’s explore a few warning signs we see in the four arenas of the macroeconomy, credit, capital markets, and politics. Then we’ll offer a few thoughts on the possible impacts of the viral epidemic (at this stage not officially a pandemic) and conclude with a summary of the potential investment implications for the years ahead
What’s the Economy Telling Us?
Leading indicators of economic activity, such as the Purchasing Managers’ Index (PMI), new orders and inventories, and the slope of the yield curve (an admittedly market-based signal, widely watched by monetary authorities), serve as common gauges of the economy’s likelihood to experience a slowdown in the coming months. During an economic slowdown, equity prices tend to fall and credit spreads to widen, and volatilities rise along with cross-asset correlations. Economic slowdowns precede full-blown recessions, though not every slowdown becomes a recession.
We estimate that the likelihood of a slowdown in the United States has meaningfully risen recently, reaching a level last seen in the summer of 2007 in the months preceding the global financial crisis. We have observed a similar increase in the odds of a slowdown across the developed markets.
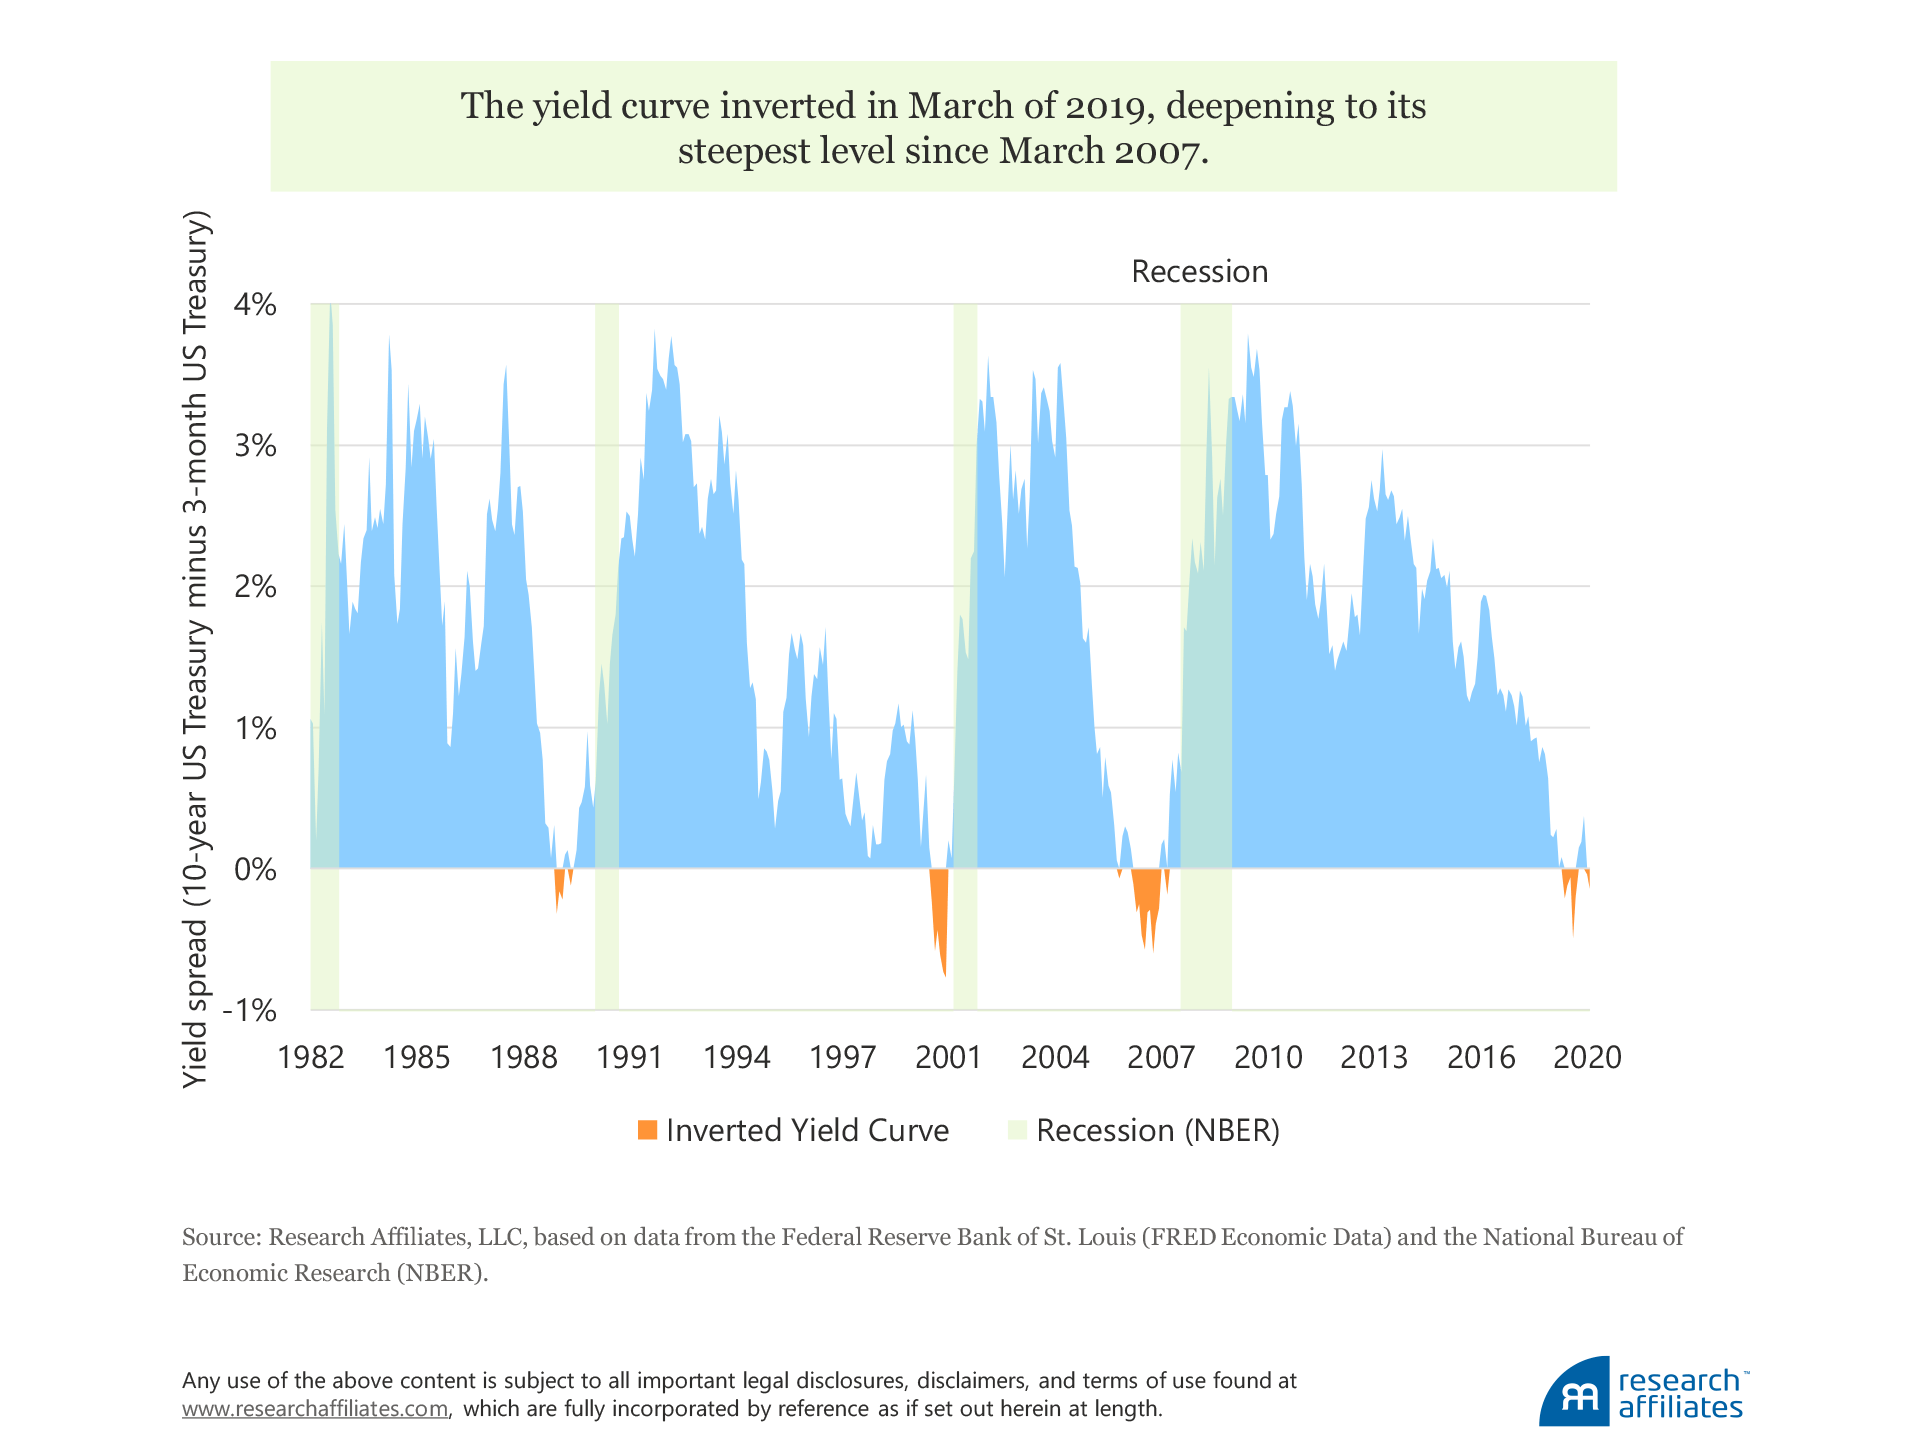
The slope of the US yield curve is among the most widely watched economic indicators. The curve first inverted in March 2019 with the inversion deepening in August to its steepest level since March 2007. Since mid-October 2019, 10-year bond yields had risen and were for a time higher than three-month yields so that many investors “relaxed,” choosing to view the inversion as a false alarm. The recent market action has taken us back to inversion territory.

Using history as a guide—the spectral alternative to “this time is different”—the yield curve inverted approximately a year before each of the past three recessions; over the last seven recessions, going back to the 1960s, the lag ranged from 8 to 60 months. Each of the past three pre-recession inversions reversed themselves before the ensuing economic downturn began.
While US equities broadly suffered after an inversion, value stocks tended to fare remarkably well.
”Across these recessionary episodes, on average, the S&P 500 delivered a negative one-year loss relative to cash, and cumulative returns over cash following an inversion remained negative over a three-year horizon. Interestingly, while US equities broadly suffered after an inversion, value stocks tended to fare remarkably well, delivering on average a cumulative 19% return over the next three years.4
The yield curve is a standard yardstick used by central bankers in assessing economic health, so how are central banks interpreting this information today? As we were approaching year-end, they had collectively made more rate cuts (about 50, globally) than in any six-month period since the global financial crisis, including periods of serious economic and geopolitical stress, such as the European debt crisis (Woodward, Devery, and Young, 2019). On March 3, 2020, the Fed made an emergency rate cut of 50 basis points (bps), reminiscent of the types of rate cuts made in October 2008 (Smialek and Tankersley, 2020). The year-end tally seemed like a lot of medicine for a healthy patient—and now the patient is catching the coronavirus, for which rate cuts may not be a miracle cure!
Cracks in Credit Conditions
The repo market, which has a daily turnover of approximately US$1 trillion, is an integral part of our economy, a mechanism that provides overnight cash funding to financial institutions for a variety of purposes. In turn, it helps nonfinancial companies meet liquidity needs and manage cash flows, including making payroll.
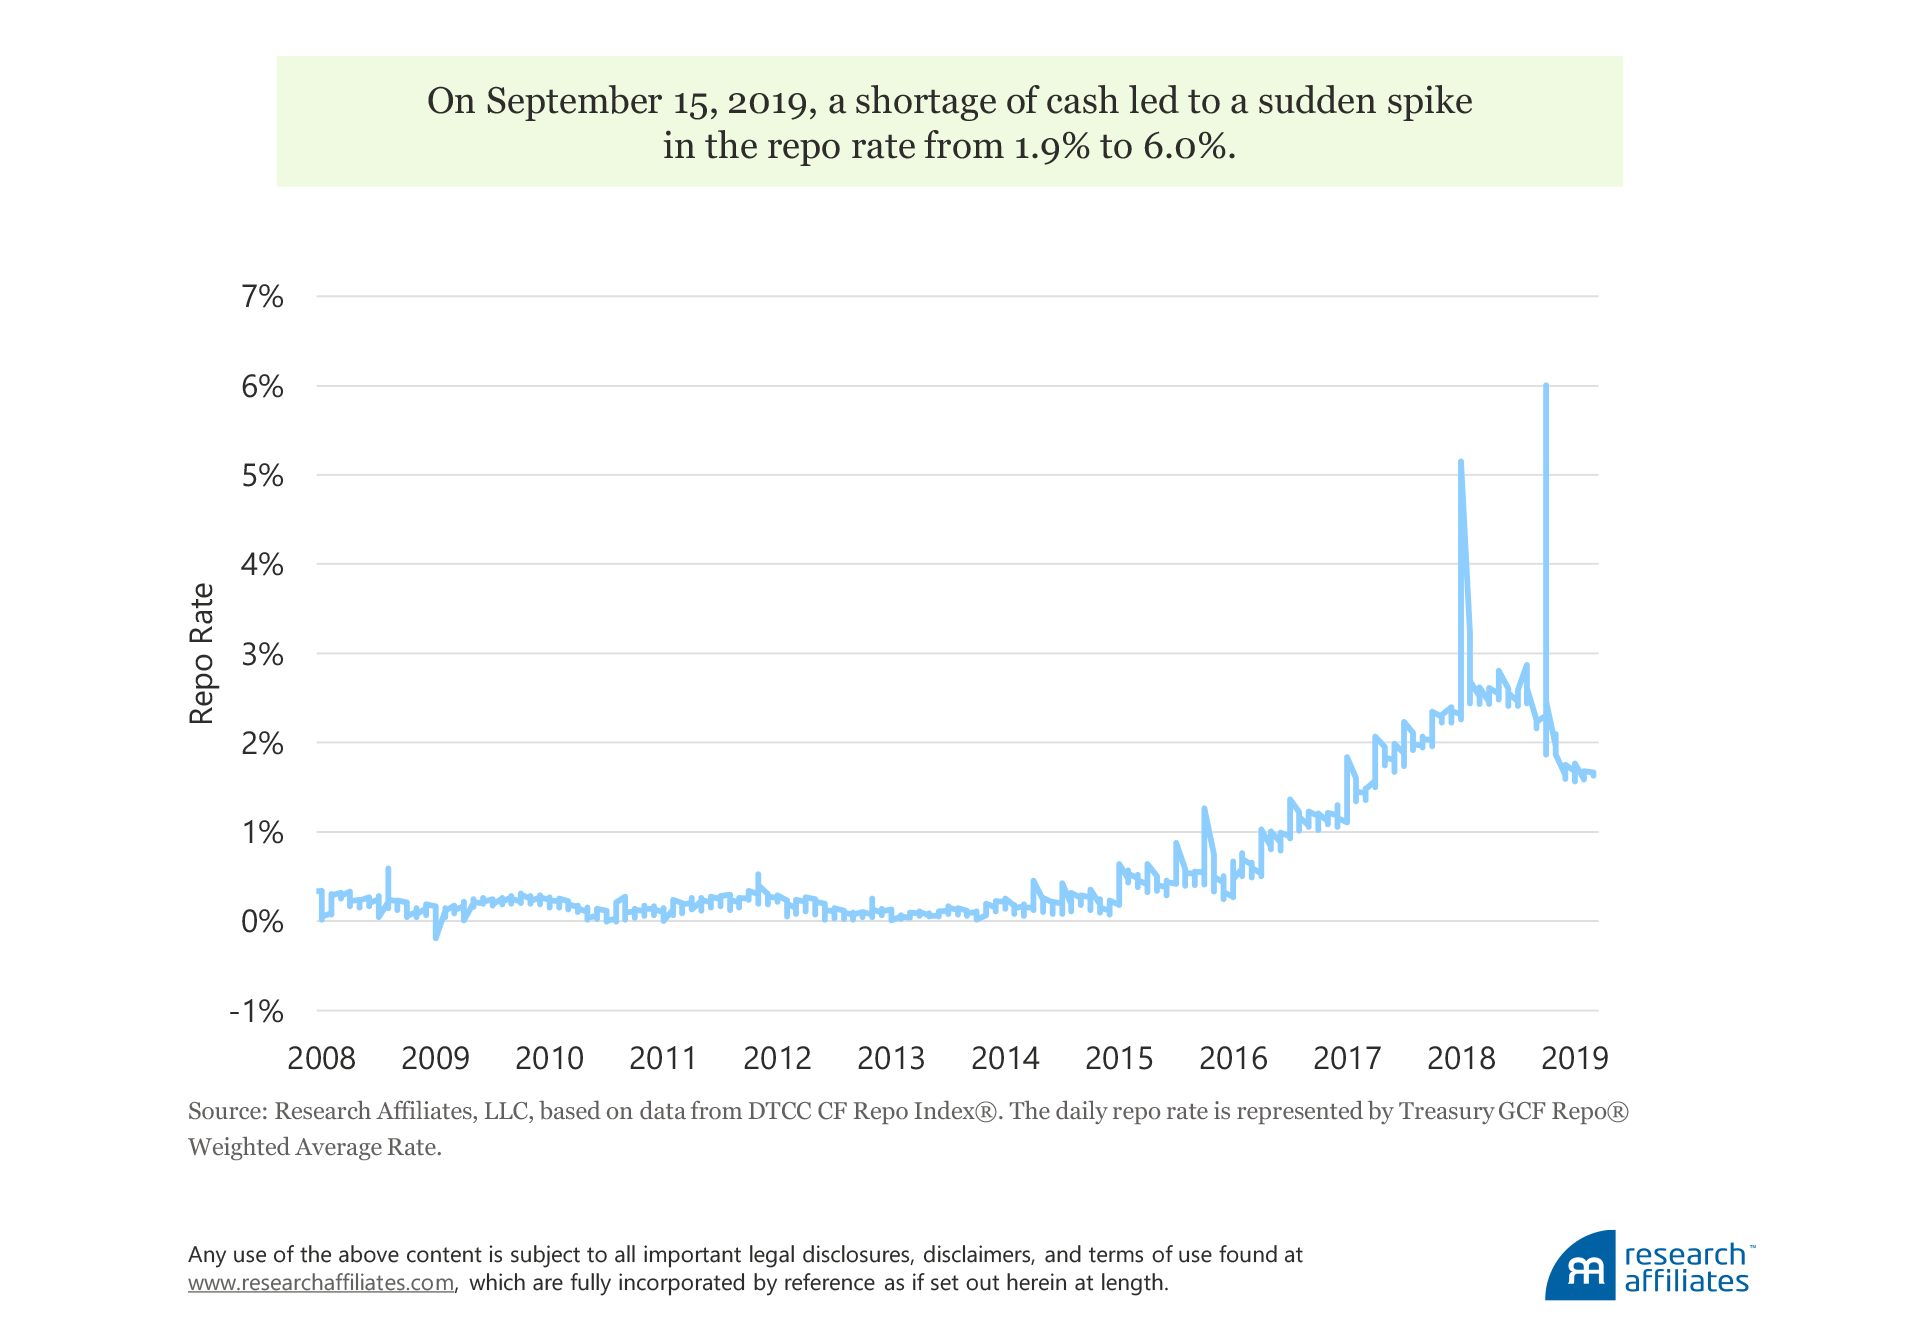
The repo market came under severe and unexpected stress in mid-September 2019 when the repo rate jumped to approximately 700 bps over the course of a single day (Avalos, Ehlers, and Eren, 2019), a couple of orders of magnitude greater than normal rate moves (10–20 bps). This rate spike caught market participants off guard, and the Federal Reserve Bank of New York intervened in the market for the first time since the end of the global financial crisis in 2008.
The structural contributors to this development—a reduction in bank reserves as the Federal Reserve started contracting its balance sheet in 2017 and a rise in the amount of US Treasuries held by US banks—may mean more trouble in repo markets is on the horizon. At the very least, we may find that the Fed takes on the role of permanent fire brigade to the repo market, even though year-end 2019 proved smoother than feared (Derby, 2020).

Beyond the recent hiccups in the repo market, credit quality has been broadly eroding. In the third quarter of 2019, the number of credit rating downgrades for US companies relative to upgrades reached the highest level since 2015. The average credit rating of BBB, one level above junk, is now 50% of the investment grade universe and, as of May 2019, had grown to over US$3.2 trillion (Vazza, Kraemer, and Gunter, 2019). Contrast this to the 1990s, during which the median corporate debt rating from rating agency S&P Global was investment grade.
The number of companies with heavy debt loads and without enough earnings to cover their interest payments has been steadily increasing. Referred to as zombie companies, this group of businesses has grown to its highest level since the global financial crisis; now we have five-fold the number of zombies as in the late 1990s (Velimukhametova, 2019). Years of central bank easy-money policies and cheap borrowing costs have enabled these companies to survive.
Similarly, the share of small-cap US stocks with negative earnings is merely three percentage points from record highs set in 1987, a level that has historically coincided with BBB credit spreads exceeding 2.5%.5 As The Wall Street Journal (Davies, 2020) recently reported, we may well be entering “white knuckle time” for investors who hold the debt of lower credit-quality companies.
Vulnerabilities within Capital Markets
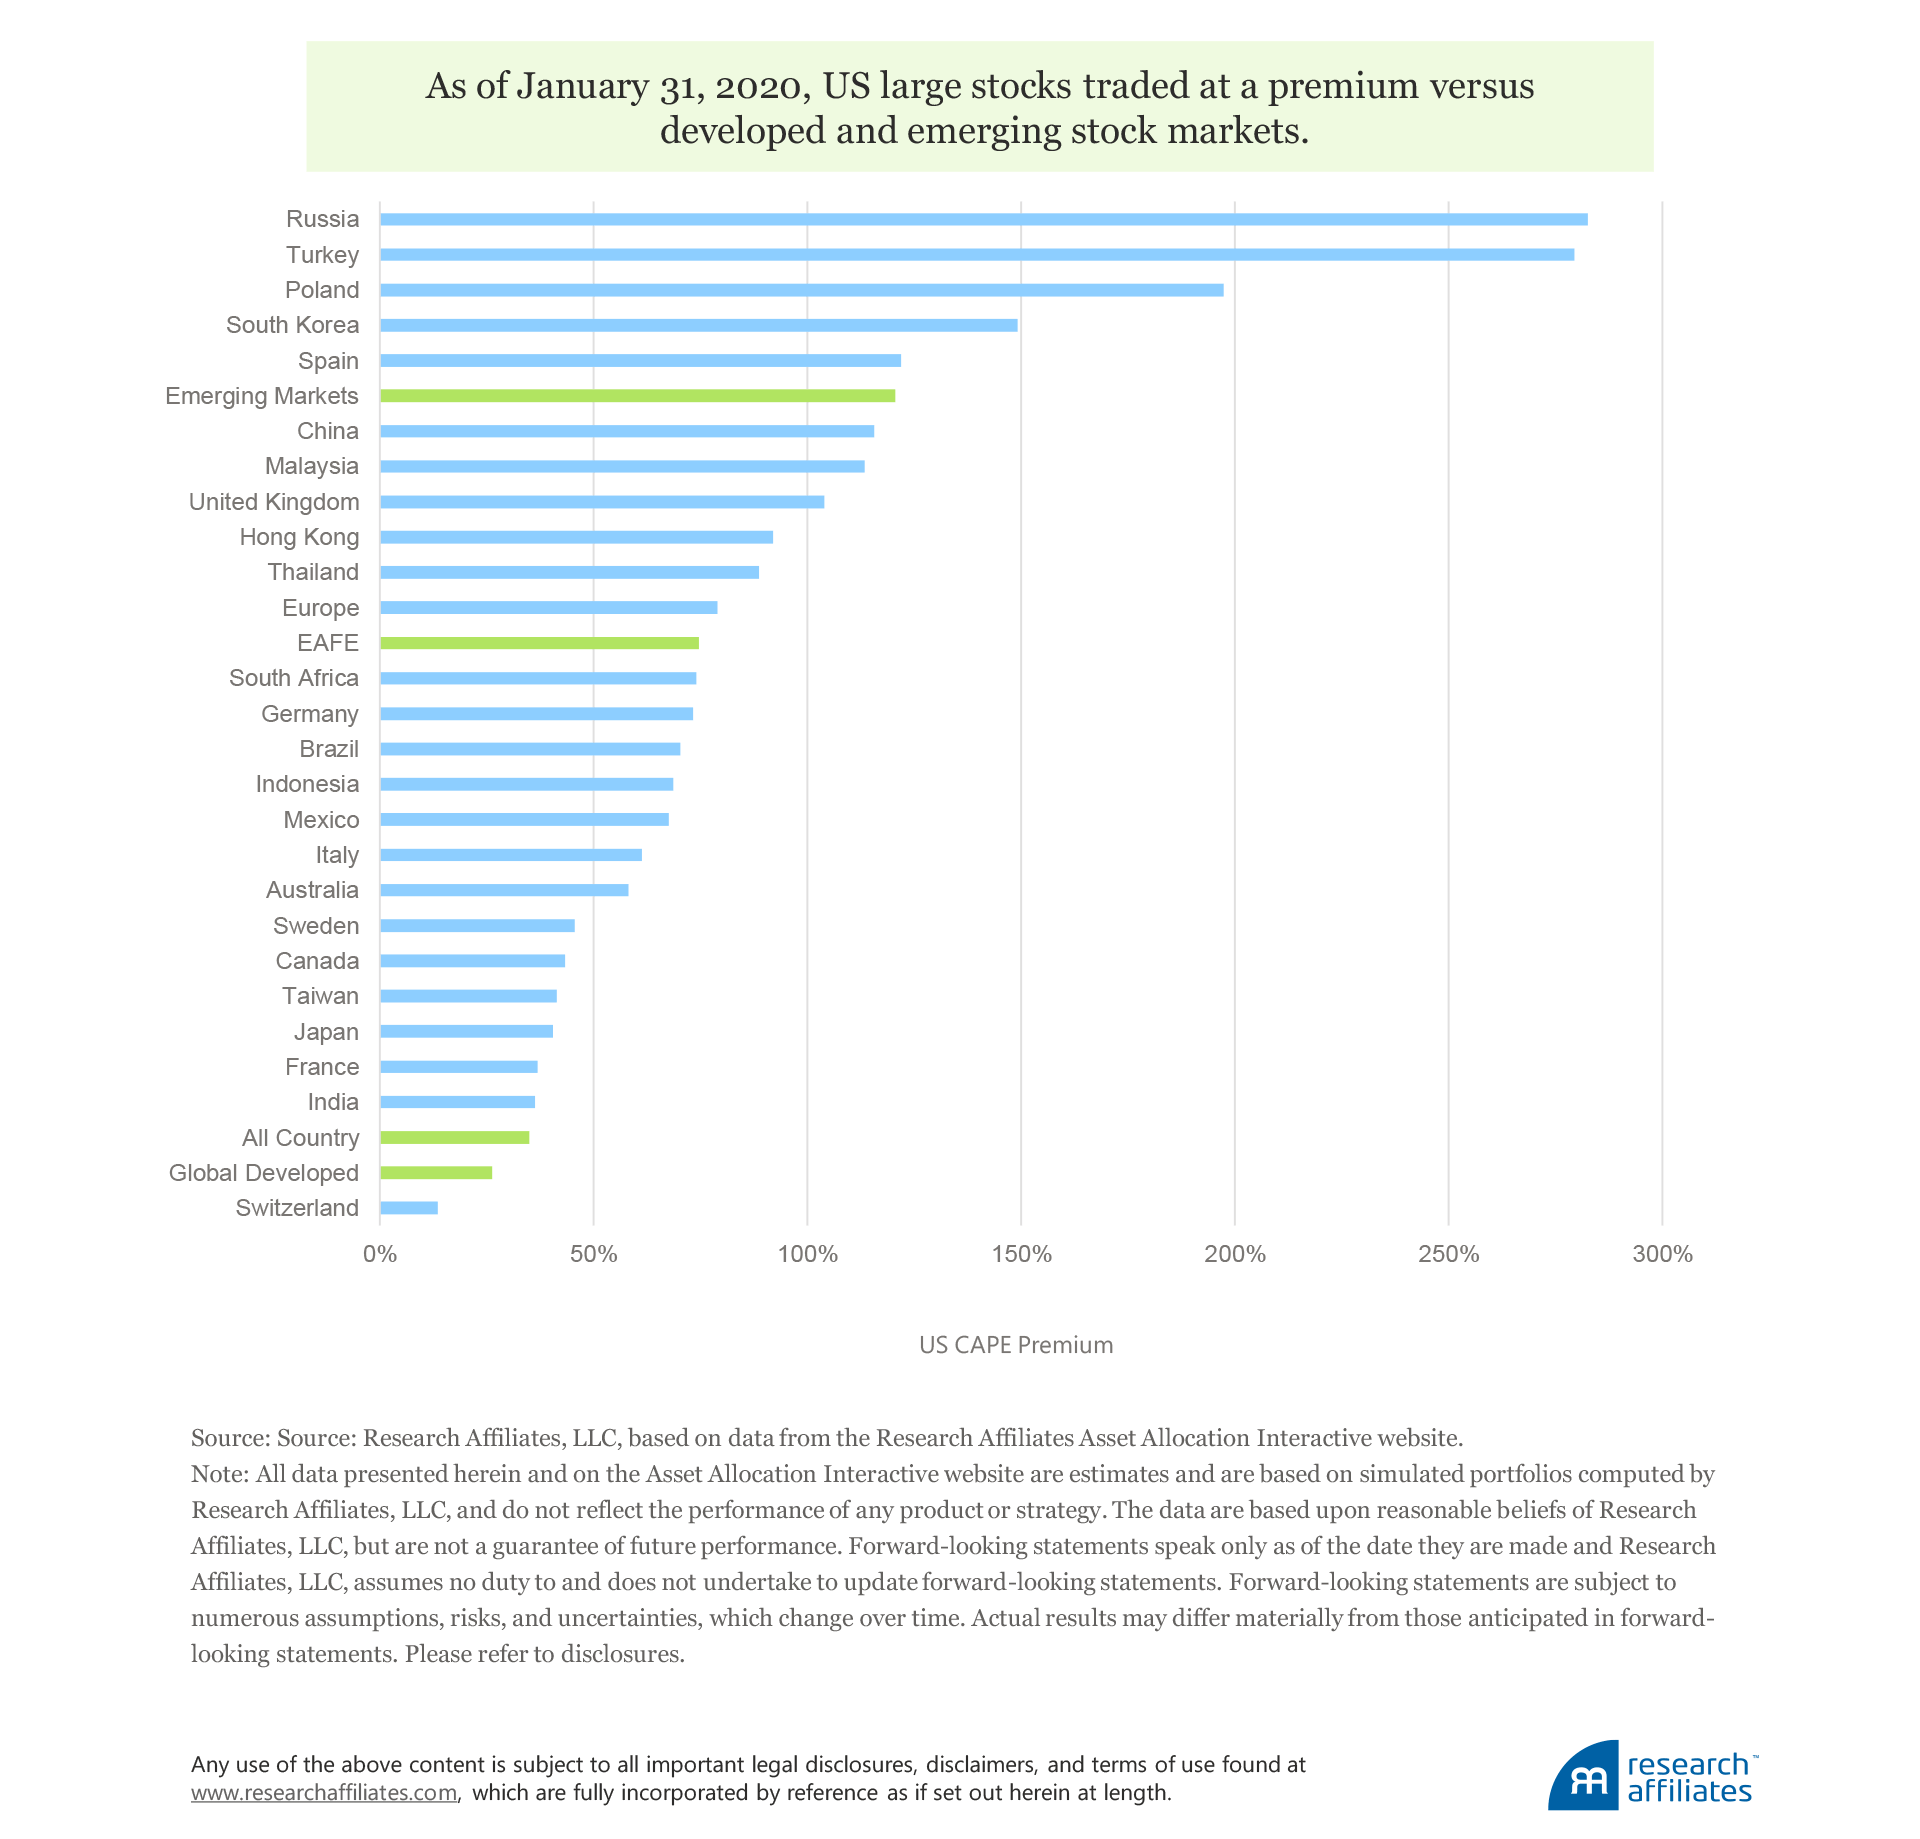
Across various metrics, including cyclically adjusted price-to-earnings (CAPE) levels, US stocks are expensive, both relative to US history and relative to other markets. Beginning this year, the CAPE level of US stocks is no longer capturing the earnings drag from the global financial crisis, which many argue was artificially inflating the CAPE metric. Regardless, as of January 31, 2020, US stocks traded at a CAPE level of 30.6x, falling within the highest 96th percentile ranking of all levels since 1871.
Not only is the S&P 500 expensive relative to its own history, the index is trading at a stark premium relative to many global developed and emerging equity markets, ranging from a 14% premium versus the Swiss equity market to over 280% versus the Russian equity market. Any valuation reversion toward long-term historical averages would likely punish US stocks, while potentially serving as a tailwind for developed and emerging stock markets.

Beyond concerns over nosebleed valuations, let’s not ignore the possibility of fat-tail events. As Kalesnik and Linnainmaa (2018) highlighted, the return distributions of various equity factors generally exhibit negative skew and fat tails, and factor returns tend to be serially correlated. Combinations of equity factors can still result in extensive and severe periods of underperformance because correlations across factors are not constant over time and many factors may be exposed to similar risk drivers.
And One More Thing… Potential Implications from the Political Arena
Lastly, beyond the most concerning of US capital markets’ warning signals—yield-curve inversions, a pressured repo market, deteriorating credit quality, and stretched equity-market valuations—we would be remiss to ignore potential implications from the political arena. The probability of the Democratic US presidential nominee winning in 2020 is close to even odds today in prediction markets and might soar in a full-blown US recession. Under a progressive Democratic administration, tax, anti-trust, and regulatory policies could turn from tailwinds to headwinds for US equity returns, particularly high-flying tech stocks.
Conclusion
We do not harbor the illusion that we have prescience in identifying catalysts or accurately picking the peaks and troughs of a market cycle. Such predictions are inherently difficult because of the complexity of our economic and capital market systems. Until markets turn, sentiment can appear to be getting better even as the economic data suggest conditions are worsening.
Any valuation reversion toward long-term historical averages would likely punish US stocks.
”We choose to study a mosaic of economic and market trends, to step aside from the noise and headline deluge, and to prepare for the most probable investment outcomes, informed by forward-looking empirical analysis. Evidence from the credit markets, macroeconomy, political landscape, and capital market valuations suggest we may be approaching, or even at, an inflection point.
And now, in the early weeks following the outbreak in China of the novel coronavirus, much of the world is experiencing a range of disruptions to daily life: government-mandated quarantines, factory shutdowns, and flight cancellations. At the time of this writing, while impossible to predict the severity and duration of the epidemic (verging on pandemic), daily reports suggest that the economic, as well as human, toll may be significant. The fear of the unknown has begun to catalyze a spike in risk premiums and market discount rates.
A collective turn from greed to fear appears to be emerging in markets now. We view both the current and future market turmoil as creating more risk to growth stock prices than to the broader market. As we have often stated, an informed investor can avoid being caught off guard when trends reverse and recession-based narratives propagate by acknowledging the challenges and nuances behind assessing an asset’s worth in different parts of the business cycle. This premise forms the central thesis (and title) of our article. Pair this awareness with an understanding of the several signals currently flashing red in the US capital markets. We caution that the result may be an end to the positive equity market trajectory we have enjoyed over the last decade. Now may be an opportune time to rebalance away from long-outperforming US growth stocks into cheaper and higher-yielding US and international value stocks.
Please read our disclosures concurrent with this publication: https://www.researchaffiliates.com/legal/disclosures#investment-adviser-disclosure-and-disclaimers.
Endnotes
- Robert Shiller emphasized that important events tend to be the result of the confluence of many factors and often changing narratives are at work in those factors. In a recent paper and book, both entitled Narrative Economics, he offered a narrative-based explanation for the Depression of 1920–1921, Great Depression of the 1930s, and recent global financial crisis, among other major economic and market downturns.
- Robert K. Merton, father of financial economist Robert C. Merton, coined the term self-fulfilling prophesy to describe a situation in which the announcement of a risk is sufficient to drive future events that ensure that the pronouncement is realized. A classic example is a run on a bank, without deposit insurance. In this case, a rumor of a run on a bank may cause customers to line up and withdraw their deposits, causing further concern and eventually ensuring that a run does indeed take place.
- How our capital markets became so weakened requires more ink than we have to spare, but NINJA (no income, no job application) mortgage loans offer a shorthand explanation for how fragility permeated the financial system during the 2000s. While NINJA loans represented a small fraction of loans made during the real estate bubble that preceded the global financial crisis, in cases such as this one, a small fraction is too much by about 100%.
- Harvey (1988) explained the link between a yield-curve inversion and future stock returns. In several video interviews available on the Research Affiliates website in our series RA Conversations, Harvey discusses the most recent yield-curve inversion as well as why value stocks offer investors a potential hedge against downside risk following a yield-curve inversion.
- Woodward, Devery, and Young (2019) described the relationship between the share of loss-making small caps and investment-grade credit spreads since 1987 in the BoA Global Research RIC Report “2020 Year Ahead: Prophets of Profits.”
- If this epidemic does not become a global pandemic, then we would anticipate a short-term, although material, temporary reduction to economic growth in China, a more modest hit to global growth, and corresponding downward pressure on real yields and inflation. If history is a guide, expect central banks to respond by stimulating the economy (as witnessed in recent weeks when China’s central bank injected over US$240 billion, or RMB 1.7 trillion, of liquidity into the banking system), thereby inflating asset prices by lowering discount rates. For interested readers, Chris Brightman discusses this topic in more detail in the March 2020 All Asset All Access publication at pimco.com.
References
Avalos, Fernando, Torsten Ehlers, and Egemen Eren. 2019. “September Stress in Dollar Repo Markets: Passing or Structural?” BIS Quarterly Review (December).
Davies, Paul J. 2020. “Tense Time for Buyers of Riskier Corporate Loans.” Wall Street Journal (January 6).
Derby, Michael S. 2020. “Demand for Fed Liquidity Rises, New York Fed Injects Nearly $100 Billion.” Wall Street Journal (January 7).
Harvey, Campbell R. 1988. “The Real Term Structure and Consumption Growth.” Journal of Financial Economics, vol. 22, no. 2:305–333.
Kalesnik, Vitali, and Juhani Linnainmaa. 2018. “Ignored Risks of Factor Investing.” Research Affiliates. (October).
Merton, Robert K. 1948. “The Self-Fulfilling Prophecy.” Antioch Review, vol. 8, no. 2 (Summer): 193–210.
Shiller, Robert J. 2019. Narrative Economics. Princeton, NJ: Princeton University Press.
Smialek, Jeanna, and Jim Tankersley. 2020. "Fed Slashes Interest Rates in Emergency Move as Coronavirus Fears Mount." New York Times (March 3).
Vazza, Diane, Nick Kraemer, and Evan Gunter. 2019. “The ‘BBB’ US Bond Market Exceeds $3 Trillion.” S&B Global Ratings (May 29).
Velimukhametova, Galia. 2019. “Beware the Dawn of the Corporate Dead.” Financial Times (November 25).
Wang, Lu. 2019. “The Bull Market Almost No One Saw Coming.” Bloomberg Businessweek (December 15).
Woodward, Jared, Justin Devery, and Jordan Young. 2019. “2020 Year Ahead: Prophets of Profits.” BoA Global Research RIC Report (December 10).

