
RAFI Fundamental Index offers an excess return with all the benefits investors expect from traditional passive indexing: simple, intuitive, low cost, transparent, high capacity, and representative of the broad market.
RAFI Dynamic Multi-Factor is designed to offer diversified factor exposure and a smoother ride over a full market cycle relative to a cap-weighted benchmark, and is well suited to investors comfortable taking on greater complexity for the potential of added return.
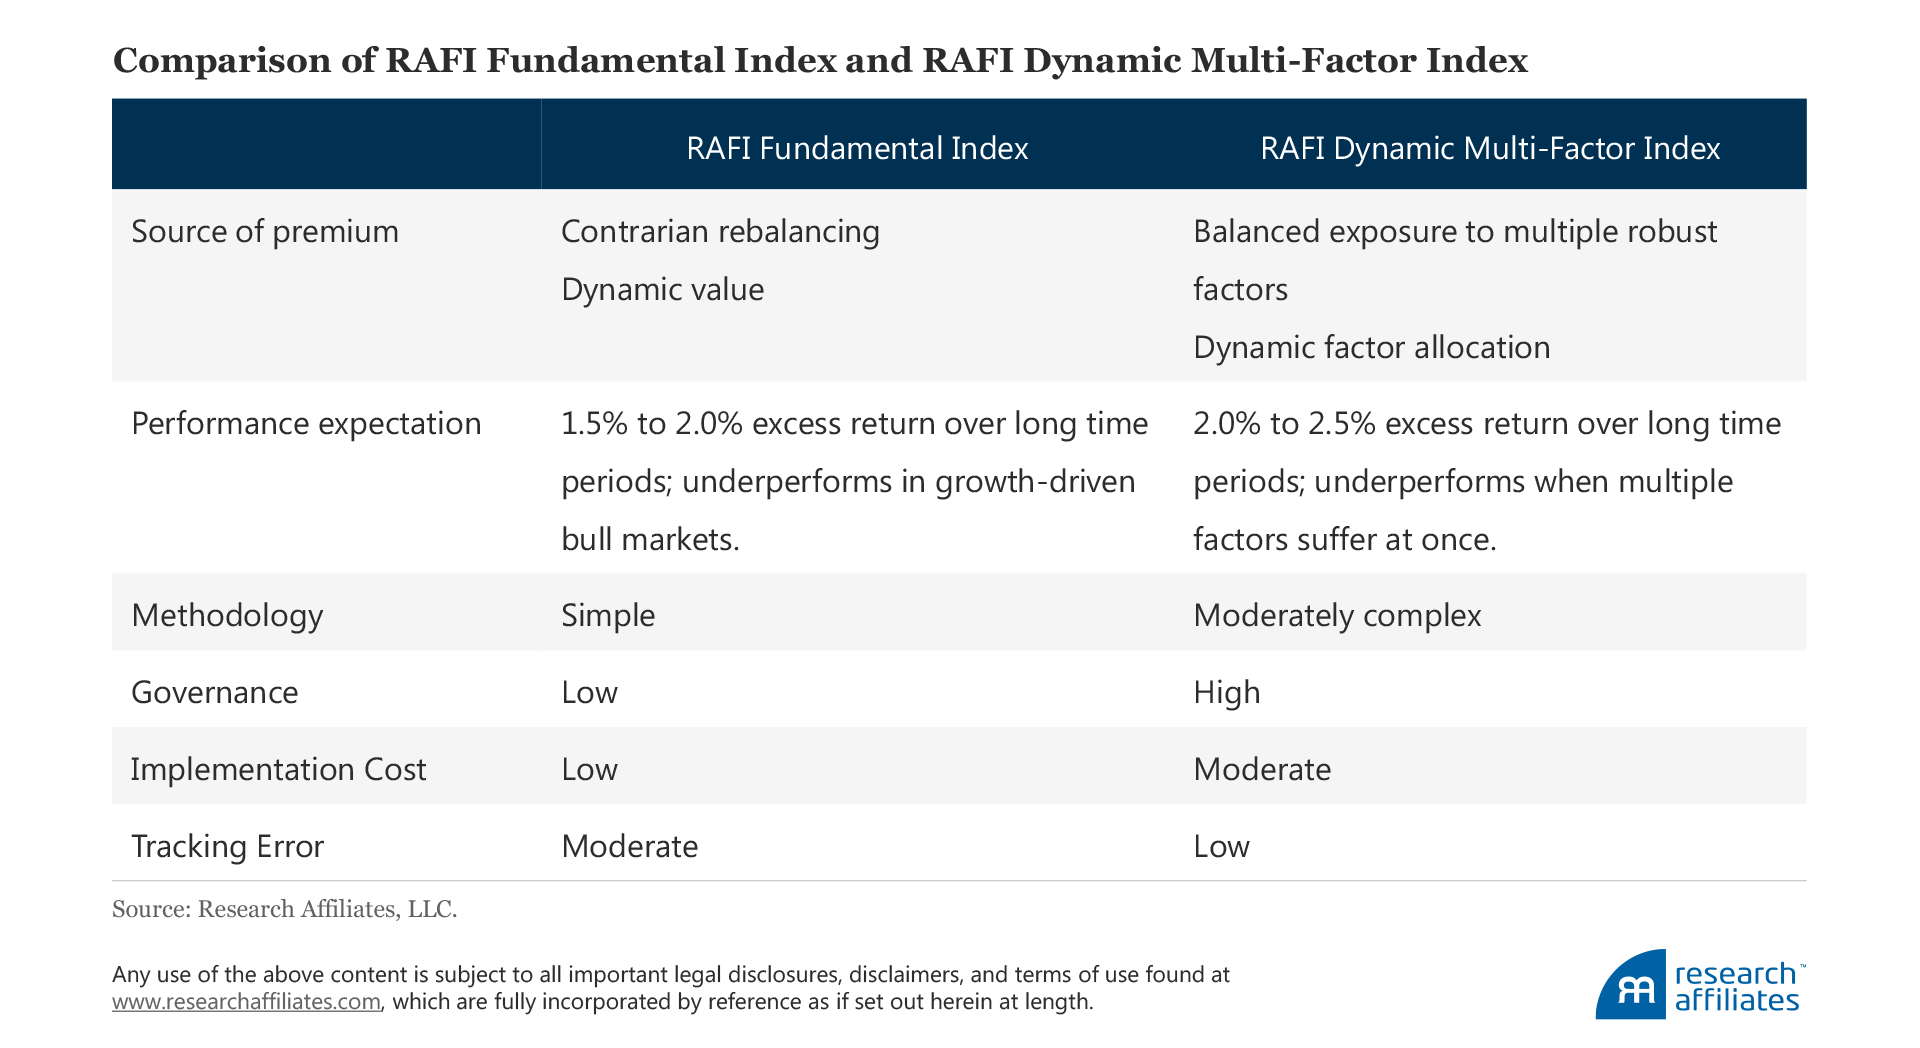
RAFI and RAFI Dynamic Multi-Factor have different risk and return characteristics. The investor’s objectives and governance mechanism should guide their selection of strategy.
Investors, when making asset allocation decisions, look beyond returns and seek to accommodate their own unique constraints and governance requirements. These investor-specific preferences—such as generating income, limiting downside risk, or controlling tracking error—significantly influence how investment decisions are made. At Research Affiliates we strongly believe that “Investor preferences are broader than risk and return.”1 Thus, finding the right fit in terms of strategy is crucial to investors’ long-term success, comfort, and satisfaction with their investment decisions.
A survey of the smart beta landscape reveals a myriad of strategy choices available to investors, each designed to appeal to (and some to arguably prey on) the wide range of investor preferences. Investors should be diligent in educating themselves about which is right for them. We find ourselves fielding questions about the differences between the RAFI™ Fundamental Index™ strategy and our recently launched RAFI Multi-Factor Index series.2 In this article we provide an overview of both methodologies, examining their respective characteristics and benefits, so the reader can make the final call on which strategy best suits their needs.
RAFI Fundamental Index
Since the launch of the first RAFI Fundamental Index (RAFI) strategies in 2005 by FTSE Russell, RAFI has been one of the leaders in the move beyond conventional indexing and active management. The RAFI methodology is relatively simple. It selects and weights securities by fundamental measures of company size such as delevered sales, cash flow, dividends + buybacks, and book value.3 Instead of mirroring the look and composition of the cap-weighted market, RAFI mirrors the look and composition of the macroeconomy.
RAFI is built on the principles of contrarian investing and disciplined rebalancing. It aims to deliver excess return over the cap-weighted benchmark by systematically rebalancing out of the trendy, popular, and most expensive securities, and into securities whose prices have fallen and become undervalued. With a live track record over a decade long, RAFI has proven its efficacy and still has all the benefits of traditional passive investing: simplicity in construction, full transparency, broad diversification, representative of the macroeconomy, low cost, and high investment capacity.
RAFI Dynamic Multi-Factor Index
The RAFI Dynamic Multi-Factor Index strategy is a rules-based, transparent smart beta index that offers diversified factor exposures through a combination of five theoretically sound and empirically robust single-factor strategies: value, low volatility, quality, momentum, and size. Each factor is constructed by selecting the top 25% of the security universe by factor definition4 (e.g., systematic risk for low volatility and high profitability, and low investment for quality) in order to create targeted and concentrated factor exposures.5 Through concentrated exposures across diversified factors, RAFI Dynamic Multi-Factor is expected to offer higher returns. A smoother ride is achieved over time relative to strategies that rely on a single factor because the five factors have moderate to low correlations of excess returns. In addition, the RAFI Dynamic Multi-Factor strategy offers the potential for added return through a dynamic weighting process that allocates to factors particularly attractive on a forward-looking basis.6
Performance
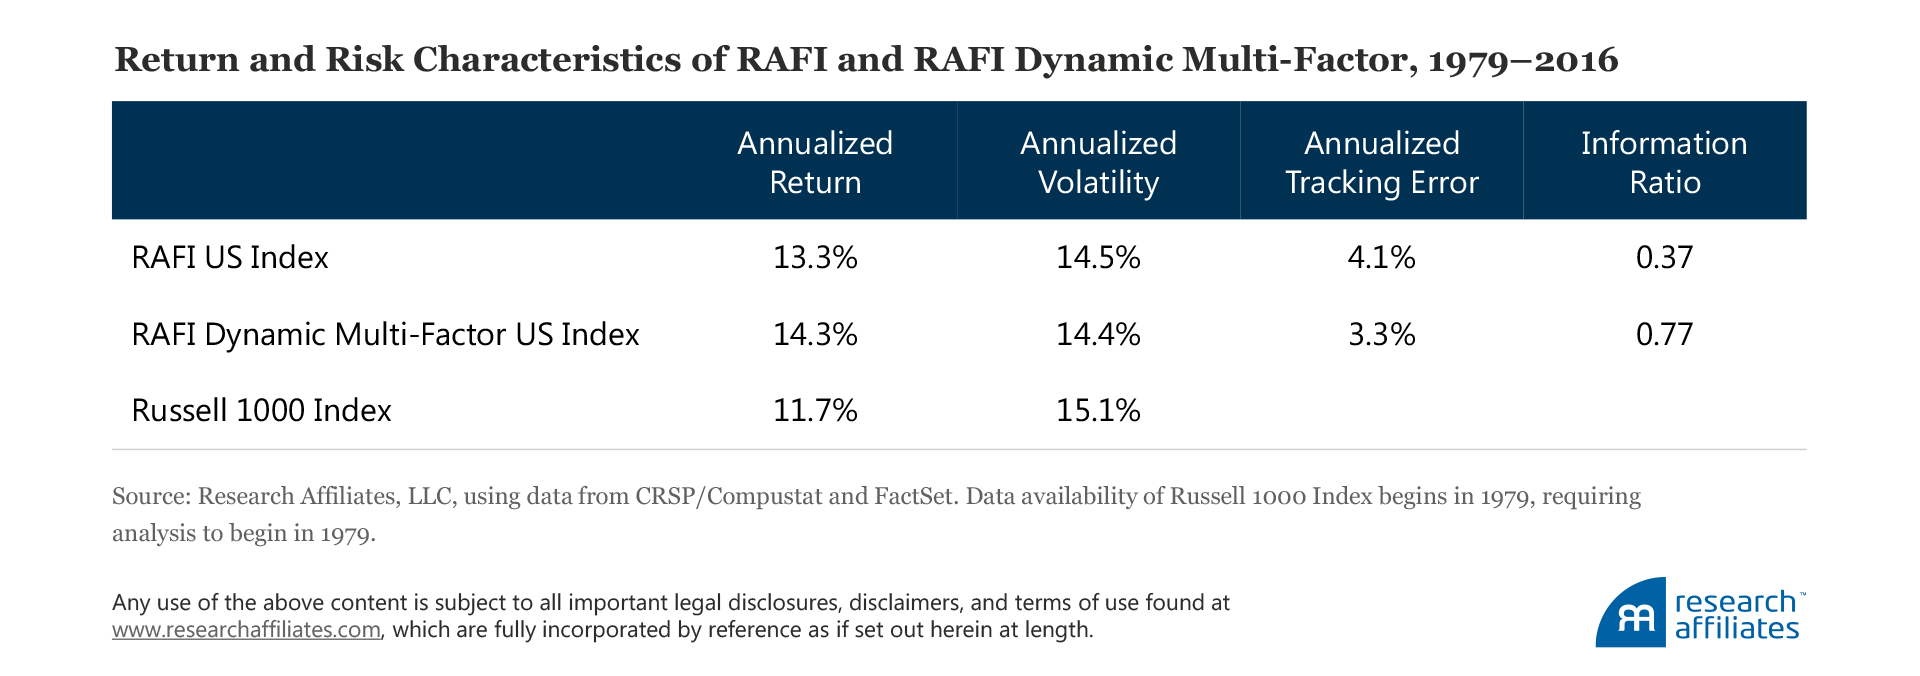
The different index construction approaches for the RAFI and RAFI Multi-Factor strategies yield different return profiles over time. Historically, the RAFI US Index has outperformed the market by approximately 1.5% a year with similar volatility. As a result of concentrated factor exposures and a dynamic factor allocation approach, the RAFI Dynamic Multi-Factor US Index strategy has outperformed the market by approximately 2.5% a year in our US simulation. The combination of higher excess returns and lower tracking error results in a much higher information ratio. The clear return advantage to the RAFI Dynamic Multi-Factor approach nevertheless requires greater complexity and finer portfolio engineering to achieve this benefit. It’s also important to note that more complex strategies typically depend more heavily on backtesting and are more prone to overfitting issues. Multi-factor is no exception here, relative to RAFI strategies.
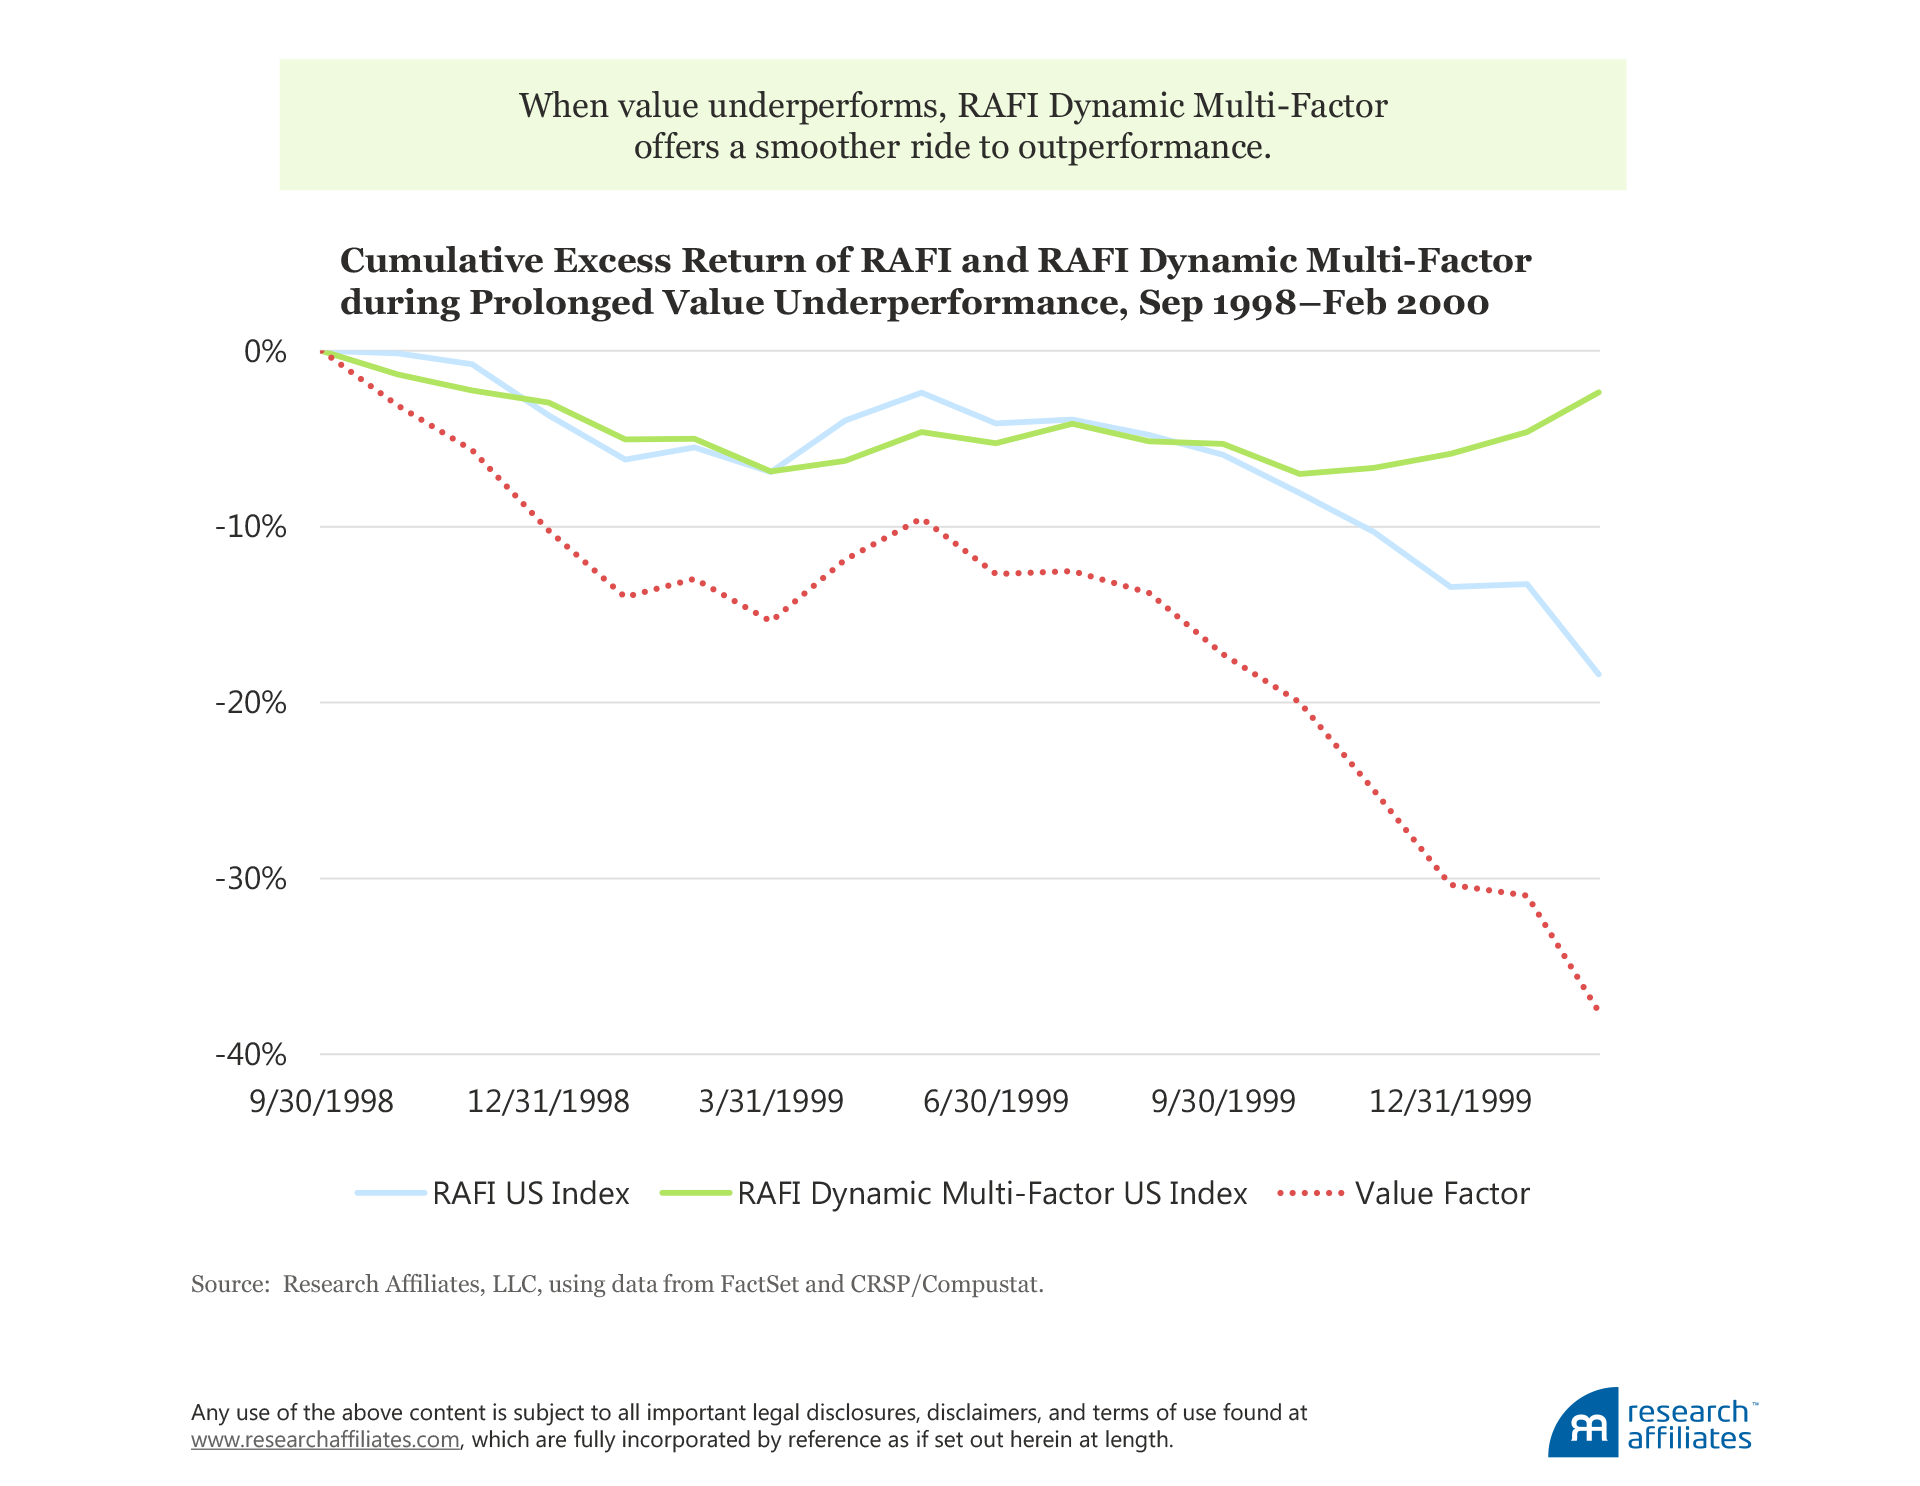
When examining performance over shorter time horizons, the RAFI US Index has outperformed the Russell 1000 Index 72% of the time on a rolling three-year basis. Underperformance versus the market has typically come during periods of strong value underperformance and trending markets, when contrarian rebalancing fails to add value. September 1998 to March 2000 is one such period of RAFI underperformance that occurred during a prolonged drawdown for the value factor.7
RAFI three-year annualized underperformance peaked on March 31, 2000, at 8.6%, when large underweights to stocks such as Cisco, EMC Corporation, and Sun Microsystems each posted cumulative returns of over 1,000% for the period. As a rebalancing strategy, RAFI was systematically rebalancing back to those companies’ fundamental weights as their stock prices soared. But for the three years following the bursting of the tech bubble, Cisco, EMC, and Sun Microsystems posted cumulative returns of −83%, −88%, and−93%, respectively, while RAFI outperformed the cap-weighted benchmark by approximately 13% a year.
The excess return of RAFI Dynamic Multi-Factor is steadier when compared to RAFI over the 1979–2016 period, outperforming 87% of the time on a rolling three-year basis. Typically, underperformance for RAFI Dynamic Multi-Factor has occurred when multiple factors underperform at the same time. A notable example of this is the period March 2009 through March 2011 when RAFI Dynamic Multi-Factor underperformed the overall market as well as RAFI, coincident with drawdown periods for the momentum and low beta factors.8 This period of underperformance followed on the heels of the global financial crisis and was characterized by strong mean reversion in value stocks, in particular, the lower-quality, high-beta stocks, such as Bank of America, Ford, and General Electric, which underperformed the most during the crisis.

Although the RAFI Dynamic Multi-Factor US strategy did well during the recent financial crisis, outperforming the Russell 1000 Index by 5.0% and the RAFI US Index by 5.7% from June 2008 through February 2009, the strategy lagged the market by 4.3% for the year following the crisis, March 1, 2009, to February 28, 2010. We can partially attribute this performance lag to Bank of America, Ford, and General Electric scoring poorly on the factor selection metrics and failing to make it into the momentum, low volatility, and quality factor strategies within the RAFI Dynamic Multi-Factor US Index. As of March 31, 2009, these three stocks had a collective weight in the RAFI Dynamic Multi-Factor US Index of 0.1% compared to 1.9% for the Russell 1000. They posted returns of 162%, 378%, and 85%, respectively, over the following year, returns obviously not captured in the RAFI Dynamic Multi-Factor US Index.
Factor Exposure
RAFI is a contrarian rebalancing strategy, so the largest and most prominent loading for the RAFI US Index is unsurprisingly on the value factor. Because its systematic rebalancing approach is away from whatever is popular and into whatever is loathed, the strategy has a dynamic exposure to value. That means RAFI has a larger loading on value when value is cheap relative to the market, and a smaller loading when value is trading at a premium. Consequently, as a result of trading against recent winners, RAFI has negative exposure to momentum. A reasonable expectation is that the RAFI strategy will face tailwinds during periods of value outperformance and during market corrections, and headwinds in momentum-driven markets.
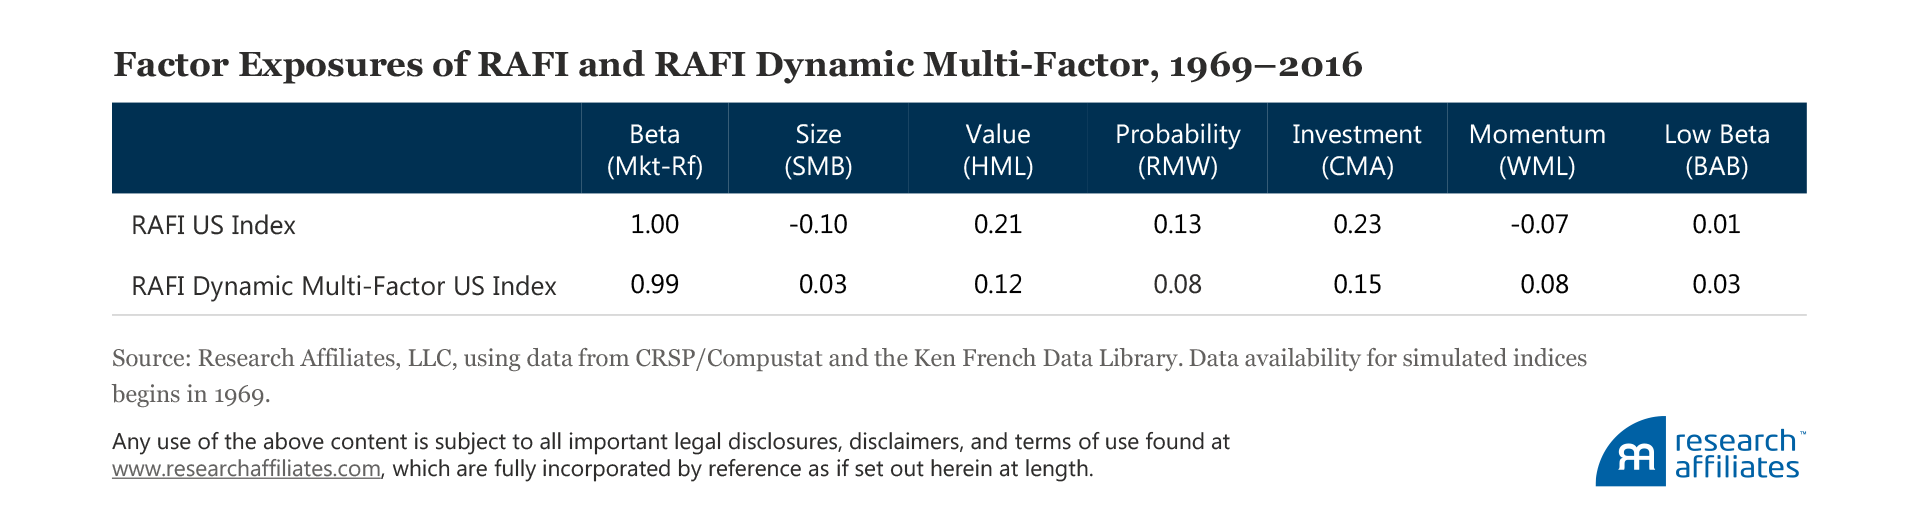
RAFI Dynamic Multi-Factor is designed to have more evenly dispersed loadings on the value, low volatility, quality, momentum, and size factors. The more balanced exposures to factors beyond value imply a low correlation between the two strategies and a lower tracking error versus the cap-weighted benchmark for RAFI Dynamic Multi-Factor. Correlation of excess returns between the two index strategies throughout history is only 42%.9
In the context of investor preferences, the difference in factor exposures provides investors with an interesting choice. RAFI makes large uncomfortable bets when value is trading cheaply. For example, at the height of the tech bubble, RAFI’s three-year annualized tracking error versus the market was approximately 11%, largely stemming from an underweight to technology of 18.7%. Similarly, during the global financial crisis in 2008, tracking error was approximately 4.5%,10 driven by a total overweight of 6.5% to the battered consumer cyclical and financial sectors. Certainly holding these positions was uncomfortable at the time, but investors in the strategy were ultimately rewarded when the market reverted to the mean and value paid off. A patient investor with a conviction in the benefits of contrarian investing would have been comfortable with these interim deviations from the benchmark. The majority of investors, however, followed the crowd and loaded up on technology stocks in the late 1990s as the tech bubble expanded, and sold out of financials in early 2009 as the financial crisis bottomed out.
Investors who are uncomfortable with contrarian positions should find greater comfort with a strategy that offers more balanced factor exposures and lower tracking error, and thus should find it easier to stay the course. The RAFI Dynamic Multi-Factor US Index appears to fit the bill. During the tech bubble, the strategy registered a tracking error of approximately 6.5%, almost half that of the RAFI US Index, while having a much more modest underweight (6.0%) to technology. Its tracking error was a mere 3.2% in the midst of the global financial crisis, while being underweight consumer cyclicals and financials by approximately 0.5%.
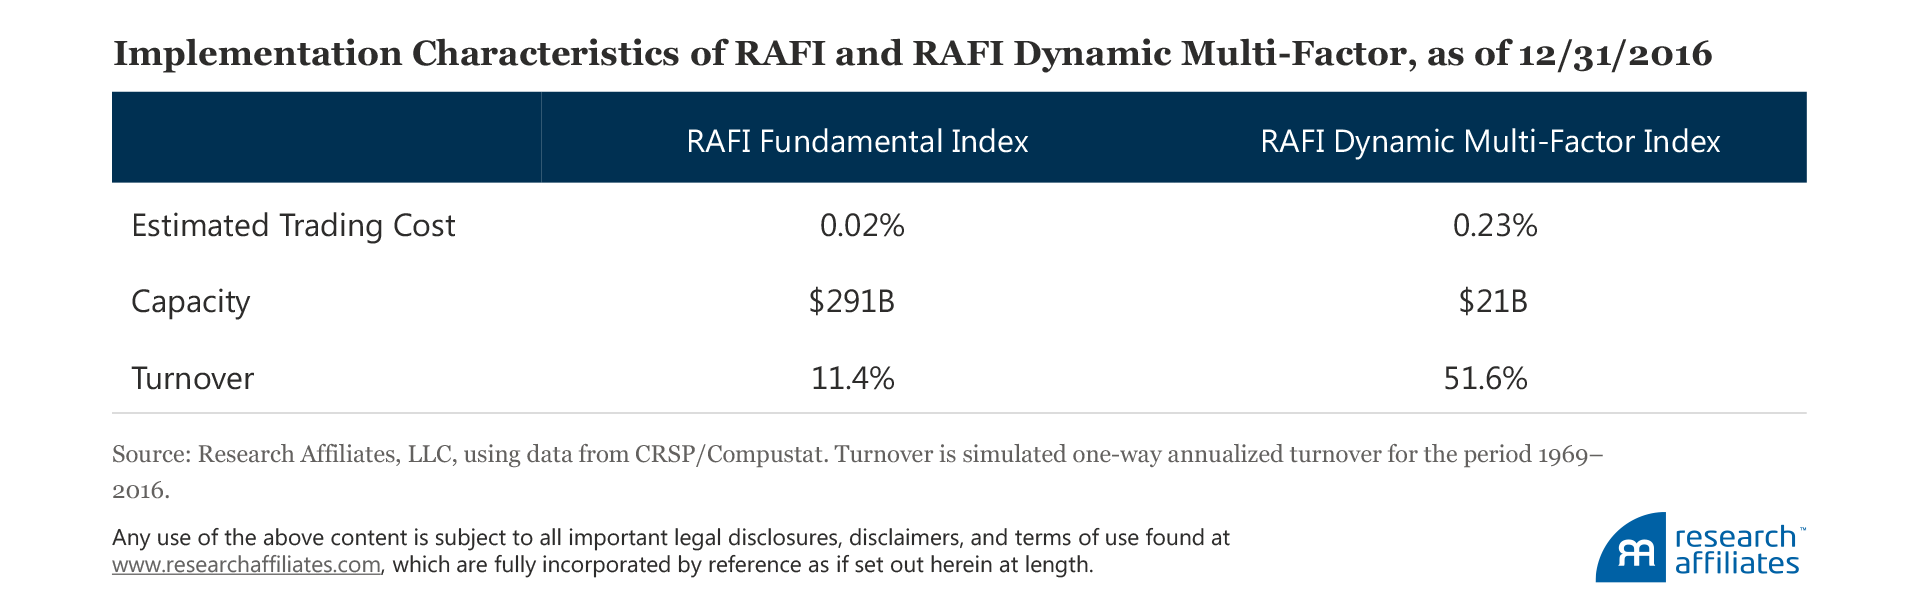
Implementation
RAFI is a broad-market core index with a simple methodology that results in far lower governance costs than other smart beta approaches. One of the benefits of this approach is minimal implementation costs. In long-term simulations, one-way turnover has averaged just 11% a year. Due to its low turnover, broad coverage, and relatively large liquid holdings, the expected market impact cost of a US$10B investment is merely 2 basis points (bps). Relative to RAFI, RAFI Dynamic Multi-Factor has a more complex methodology, which requires a deeper understanding of the factor investment framework and stronger governance. By design, the more-concentrated, less-diversified single-factor strategies that underlie the RAFI Dynamic Multi-Factor Index offer deep and targeted factor exposures, resulting in the multi-factor strategy having much lower capacity and higher turnover than RAFI. In our historical simulation, turnover has averaged approximately 55% a year with an expected market impact cost of 23 bps.11
Which Strategy Is the Right Fit?
Both RAFI and RAFI Dynamic Multi-Factor strategies offer investors outperformance over the long term along with favorable risk and return characteristics. Their respective construction and implementation characteristics, however, translate into obvious differences in costs and capacity, turnover and tracking error. RAFI is an attractive strategy for investors who seek an alternative to traditional cap-weight investing because it is simple, transparent, broadly diversified, and low cost, while delivering an excess return over the market. Because it, at times, tilts deeply toward value, it can have substantial tracking error—particularly when the market is paying a huge premium for growth stocks. This deep value tilt can be daunting for investors until the inevitable snapback, or mean reversion, occurs.
RAFI Dynamic Multi-Factor seeks to achieve a higher information ratio than RAFI by diversifying its sources of return. Investors with tighter performance measurement constraints or shorter governance evaluation horizons, and investors looking for diversified factor exposures and a smoother ride over time, should find RAFI Dynamic Multi-Factor a good fit. This approach requires finer portfolio engineering and leads to more complexity, more concentration, higher turnover, increased transaction costs, and less capacity than RAFI Fundamental Index. Simply stated, the “right” strategy is based on each investor’s unique set of risk and return preferences. Only the investor knows what those preferences are in order to make the best decision about best fit.

Endnotes
1. Brightman, Treussard, and Masturzo (2014) explain the three overriding investment beliefs of Research Affiliates.
2. Press Release, January 31, 2017: “Research Affiliates Launches RAFI Multi-Factor and Single Factor Index Suite.”
3. The FTSE RAFI Index Series, Russell RAFI Index Series, and RAFI Fundamental Index series all use fundamental measures of company size to select and weight index constituents. All three index strategies are expected to provide similar long-term excess return versus a traditional capitalization-weighted index because they all share the common element of non-price weighting, albeit through various fundamental measures of company size. By breaking the link between the price of a stock and its weight in the index, you are no longer weighting a stock more heavily just because it has a higher price or a higher valuation multiple.
4. Momentum, which uses the top 50% of the security universe, is the exception.
5. We construct our size factor using a multi-factor approach within the small-company universe. We have long questioned the efficacy of small-cap stocks as a standalone equity factor. Whereas small-cap stocks outperform large-cap stocks, their risk is higher and they do not offer meaningfully higher returns on a risk-adjusted basis. Questions remain about the robustness of size investing alone, but research has shown (e.g., Hsu et al. [2016]) that other factors work particularly well within the small-cap universe. The RAFI Size Factor Index is a robust approach that incorporates value, low volatility, quality, and momentum within the small-cap space. More information about the RAFI Multi-Factor methodology is available on the RAFI Indices section of our website.
6. More information is available in Brightman et al. (2017).
7. Value factor performance is measured by going long stocks with low price-to-book ratios and shorting stocks with high price-to-book ratios within the large-cap space. More information on our value factor methodology is available on our website under the “Factors” tab of our Smart Beta Interactive Tool.
8. Momentum factor performance is measured by going long stocks with high past returns over the prior year, skipping the most recent month, and shorting stocks with low returns over the prior year, skipping the most recent month. The factor is created within the large-cap stock universe. More information on our momentum factor methodology is available on our website under the “Factors” tab of our Smart Beta Interactive Tool. Low-beta factor performance is measured by going long stocks with low market beta and shorting stocks with high market beta, within the large-cap stock universe. More information on our low-beta factor methodology is available on our website under the “Factors” tab of our Smart Beta Interactive Tool.
9. The correlation of excess returns is measured versus the Russell 1000 Index over the period 1979–2016.
10. Active weights are measured using the RAFI US Index versus the Russell 1000 Index. For the technology bubble, active weights are as of March 31, 2000, and for the global financial crisis, active weights are as of March 31, 2009.
11. Annualized trading costs are estimated as the market impact of transactions, assuming US$10B in AUM. More information is available on our website in “Methodologies Used in the Interactive Smart Beta Tool.”
References
Brightman, Chris, Vitali Kalesnik, Feifei Li, and Joseph Shim. 2017. “A Smoother Path to Outperformance with Multi-Factor Smart Beta Investing.” Research Affiliates (January).
Brightman, Chris, Jonathan Treussard, and James Masturzo. 2014. “Our Investment Beliefs.” Research Affiliates (October).
Hsu, Jason, Vitali Kalesnik, Noah Beck, and Helge Kostka. 2016. “Will Your Factor Deliver? An Examination of Factor Robustness and Implementation Costs.” Financial Analysts Journal, vol. 72, no. 5 (September/October):58−82.
