
Not all features of smart beta strategies that add value for investors can be replicated with simple factor tilts.
Whereas factor-replicated portfolios can match the short-run returns of smart beta strategies, they have higher turnover, much larger trading costs, smaller capacity, more frequent and prolonged benchmark underperformance, larger drawdowns, higher residual risk, and lower long-run returns.
Implementation matters! Really smart smart beta strategies should be designed to optimally capture factor return premiums and be able to deliver them to investors after trading costs.
This article is the second in a series we are publishing in 2017. The first article of the series showed that the factor returns realized by mutual fund managers can be very different from the returns investors might expect based on the funds’ factor loadings. We find that the performance of the market, value, and momentum factors in live portfolios is sharply lower than their performance in theoretical model portfolios. If the results of long–short factor paper portfolios used in regression analysis to judge manager skill are not replicable with live assets, bad decisions may be made. This may be contributing to many of the new live factor strategies faring as poorly as they are, even though the periods over which their performance is being measured are too short to draw any meaningful conclusions.
In this article, we challenge the common view that smart beta strategies and factor tilts are equivalent. Initially, the term “smart beta” referred to strategies that broke the link between the price of a stock and its weight in the portfolio or index. Capitalization weighting does not do that—neither does a portfolio that applies factor tilts to a cap-weighted starting portfolio.
Some have suggested that certain smart beta strategies are essentially factor tilt strategies in disguise, which can be replicated with factor tilts applied to a cap-weighted market portfolio. We test this assertion by replicating three first-generation smart beta strategies—Fundamental Index™, equal weight, and minimum variance—with factor tilts. Creating factor-replicated portfolios that match the factor loadings of these smart beta strategies is easy, but the factor-replicated portfolios are poor substitutes for their smart beta counterparts: performance is poor, turnover is high, and capacity is terrible. Why? The simple answer is that construction details matter in achieving both lower trading costs and higher performance.
In the third article of the series, we will examine whether expected factor returns based on relative valuation can forecast mutual fund performance better than existing models, whose typical inputs are fees, turnover, and past returns. The fourth paper in our series will take a deep dive into momentum to explore why live results for momentum strategies are so starkly inferior to the results of theoretical model portfolios and to ask how momentum can be preserved as a value-added strategy.
A walk along Canal Street in New York City on a typical day winds around numerous vendors selling replica Rolexes at bargain prices. The replicas’ quality varies from vendor to vendor, but for the most part they all look very much like the real deal and might even keep time reasonably well. But a buyer of a replica Rolex accepts certain risks avoided when buying an original: the watch is not guaranteed, may break easily, and may even contain toxic chemicals used to simulate gold that can turn skin green. To state the obvious: all Rolexes are watches, but not all watches are Rolexes.
We assert the same logic holds for smart beta investment strategies. All smart beta strategies have factor tilts (useful in that factors can educate investors about strategy tendencies and return drivers), and factor tilt strategies can reasonably replicate the short-term performance of smart beta strategies. We show, however, that simple factor tilts based on the factor construction popularized in the academic literature are a poor way to capture the long-term performance of smart beta strategies. Smart beta strategies—as originally defined by Towers Watson—generally deliver superior performance, both before and after trading costs, and have more favorable portfolio characteristics, such as turnover, trading costs, and capacity. Although all smart beta strategies have factor tilts, not all factor tilts are smart beta strategies.
Smart Beta Return Performance
Towers Watson coined the term “smart beta” around 2009, inspired by the Fundamental Index and other strategies, to encompass an array of strategies that break the link between the price of a stock and its weight in the portfolio. Towers Watson found many examples, including among them equal weight, Fundamental Index, minimum variance, low volatility, EDHEC’s Risk-Efficient strategy, and TOBAM’s Maximum Diversification strategy. A unifying attribute of these strategies is that they exploit a simple fact: market capitalization–weighted strategies weight every stock that is currently overvalued (hence, destined to underperform in the future) in the portfolio above its fair-value weight, and underweight every undervalued stock.
Advocates of cap-weighted indexing correctly observe we cannot know which stock is overvalued and which is undervalued because we cannot know fair value, and accordingly we cannot know fair-value weight. They argue this seeming Achilles’ heel of capitalization weighting does not present a problem. But if we can break the link between the price of a stock and its portfolio weight, we will no longer assuredly overweight overvalued stocks and underweight undervalued stocks. An over- or undervalued stock is roughly equally as likely to be above as below its fair-value weight, so the errors cancel! This has been referred to as rebalancing alpha and is a shared attribute of all generation-one smart beta strategies.
Ample evidence exists that these early smart beta approaches add value. We compare three: Fundamental Index, which weights the top 1,000 US stocks by the fundamental economic footprint of the 1,000 largest businesses in the macroeconomy; equal weight, which equally weights the top 1,000 US stocks (selected by market capitalization); and minimum variance, which optimizes (using the top 1,000 US stocks by market cap, subject to constraints) to create the lowest-possible-risk portfolio.1
A comparison of the performance characteristics and factor model return attributions of these strategies is provided in Table 1. Before trading costs, all three add 130−200 basis points (bps) of total return a year above the market capitalization−weighted top 1,000 stocks, and all three have sizable Sharpe ratios and information ratios over the past half-century.
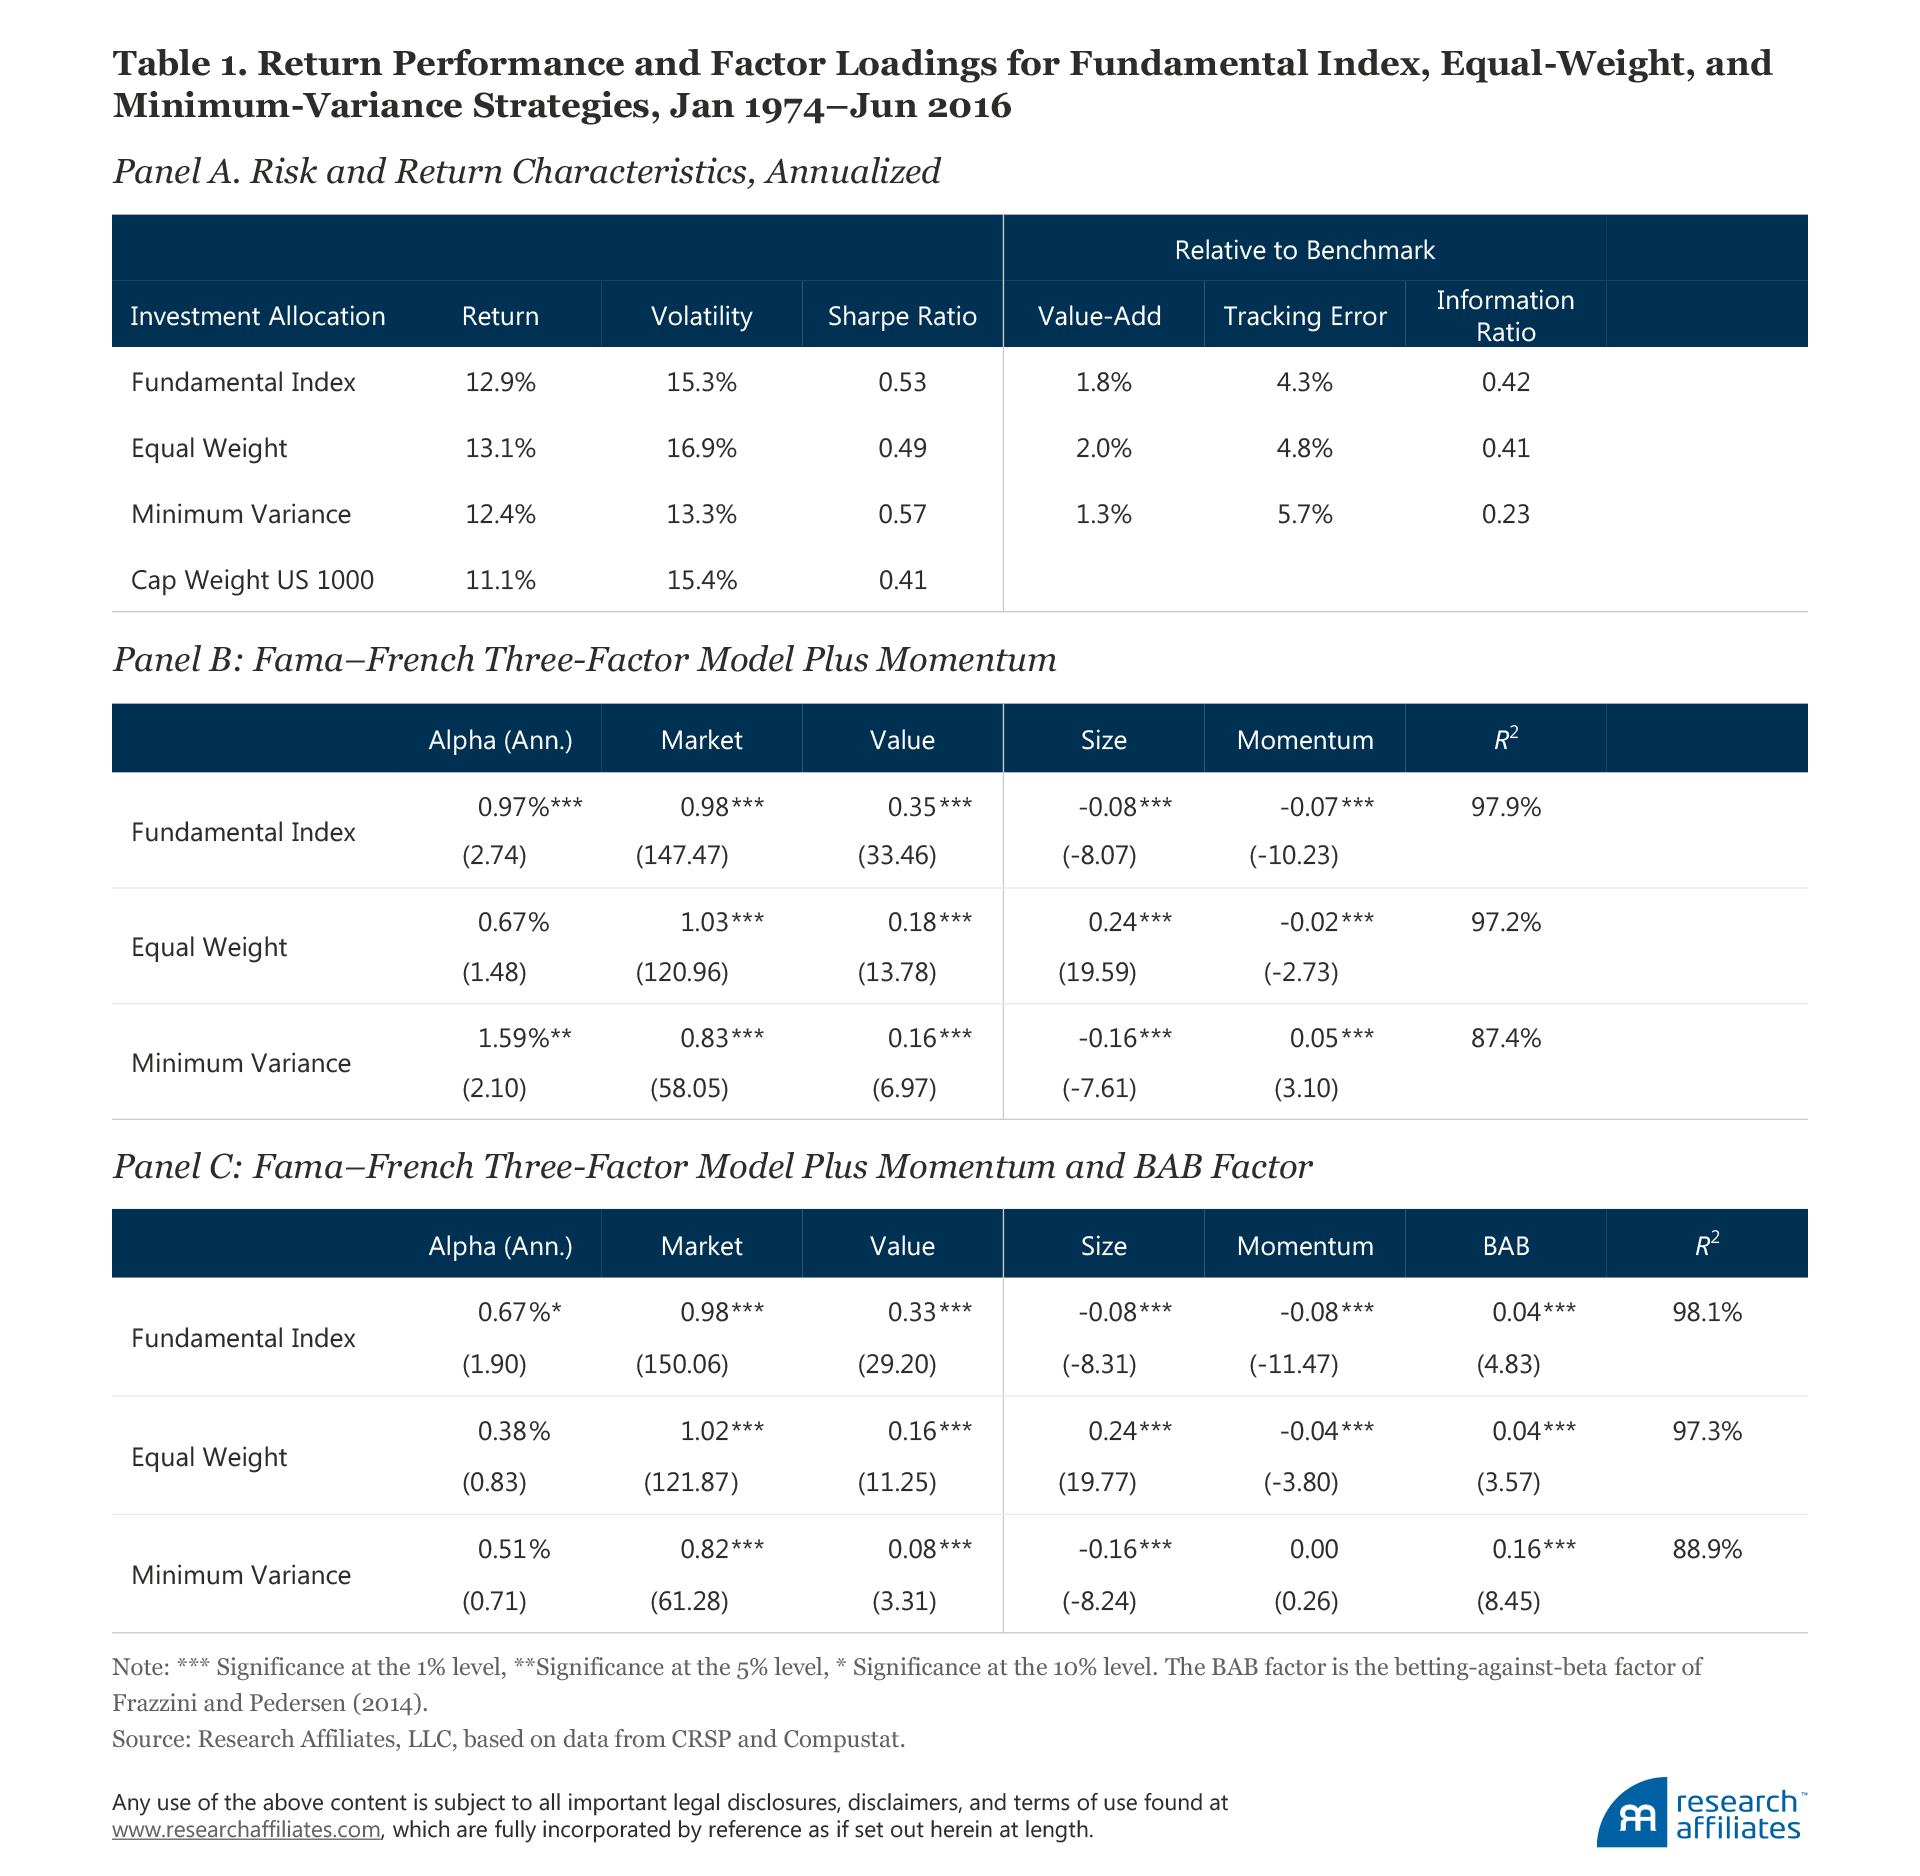
Pundits have argued that the Fundamental Index is nothing more than a value strategy, but in live experience the Fundamental Index outperformed value over a period (2006 through February 2017) when value was savaged: on an annualized basis, the Fundamental Index delivered 9.29%, better than the 7.42% of the Russell 1000 Value Index, the 8.16% earned by the S&P 500 Index, and even the 8.99% earned by the Russell 1000 Growth Index.2 In other words, the Fundamental Index beat Russell Growth in a decade when growth beat value! So much for the early cynics.
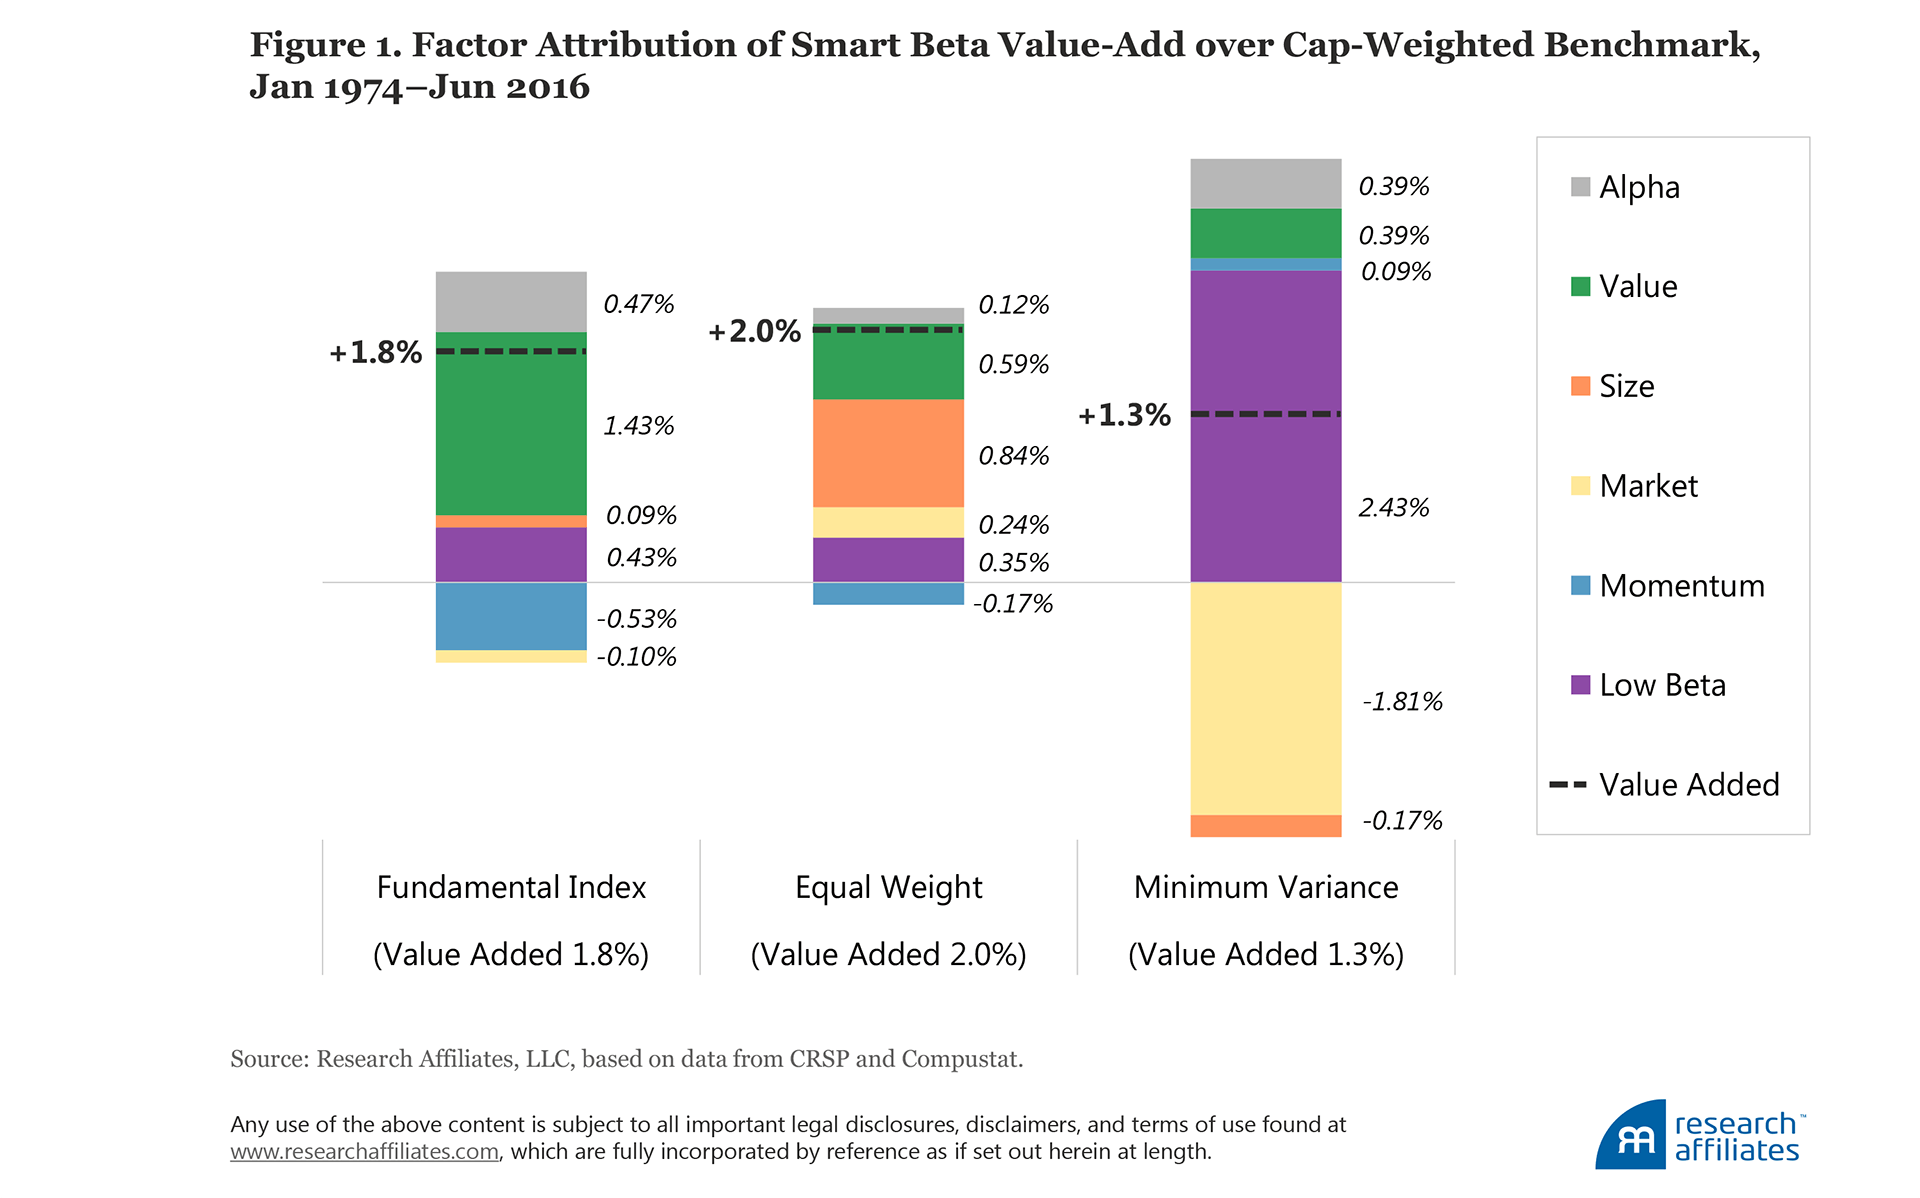
In part, the alpha of the Fundamental Index comes from the fact that the Fama–French value factor is itself not pure value, because it cap-weights the value and growth portfolios. More important, however, the Fundamental Index is value “done better” because it regularly rebalances against the market’s constantly changing perceptions of value. As we have explained in the past, Fundamental Index alpha comes both from buying stocks that are relatively cheap (the value effect) and by dynamically taking a deeper value loading whenever those value stocks are unusually cheap. So, the Fundamental Index is—viewed from its weighting metric—a pure value strategy, but it is also a better means of capturing the value premium than simply tilting away from market cap using a static tilt with the theoretical value factor. Although the Fundamental Index strategy creates a value tilt (and an anti-momentum tilt and a variable, but minor, small-cap tilt), the process cannot be reverse engineered. The bottom line is that in recreating the factor tilts of smart beta strategies much is lost in translation.
Smart Beta Factor–Replicated Portfolios
Can we replicate these smart beta strategies using factor tilts? Of course we can—approximately. We employ a five-factor model consisting of the standard Fama–French three-factor model, which includes the market, value, and size factors augmented by the momentum factor and the Frazzini–Pedersen low beta, or BAB, factor. Using the factor exposures of the smart beta strategies from this model, along with factor portfolio weights, we construct portfolios that tilt away from market cap (our specific methodology is detailed in the appendix). These factor-replicated portfolios have nearly identical factor loadings, on average over time, to the smart beta strategies.
Because factors are built from long–short factor portfolios, we can reverse engineer the three smart beta strategies we analyze by starting with the cap-weighted market and adding in the long–short portfolios with weights that match the factor loadings of the smart beta strategies. In order to avoid look-ahead bias, we estimate factor loadings using expanding window regressions. We use the first 10 years of data to estimate factor loadings in constructing the weights for the subsequent month, and the first 10 years plus one month of data to estimate loadings to construct the subsequent month’s weights, and so on.5
Factors are generally long–short portfolios. Because smart beta strategies are generally long-only portfolios, we create an alternative long-only factor-replicated strategy. This long-only strategy excludes the short weights in the long–short factor-replicated strategy, then renormalizes the weights (including cash) to sum to 100%. The result is that we have two versions of the replicated portfolio: one is a full replication, using long–short portfolios, and the other is a more practical long-only replication strategy.
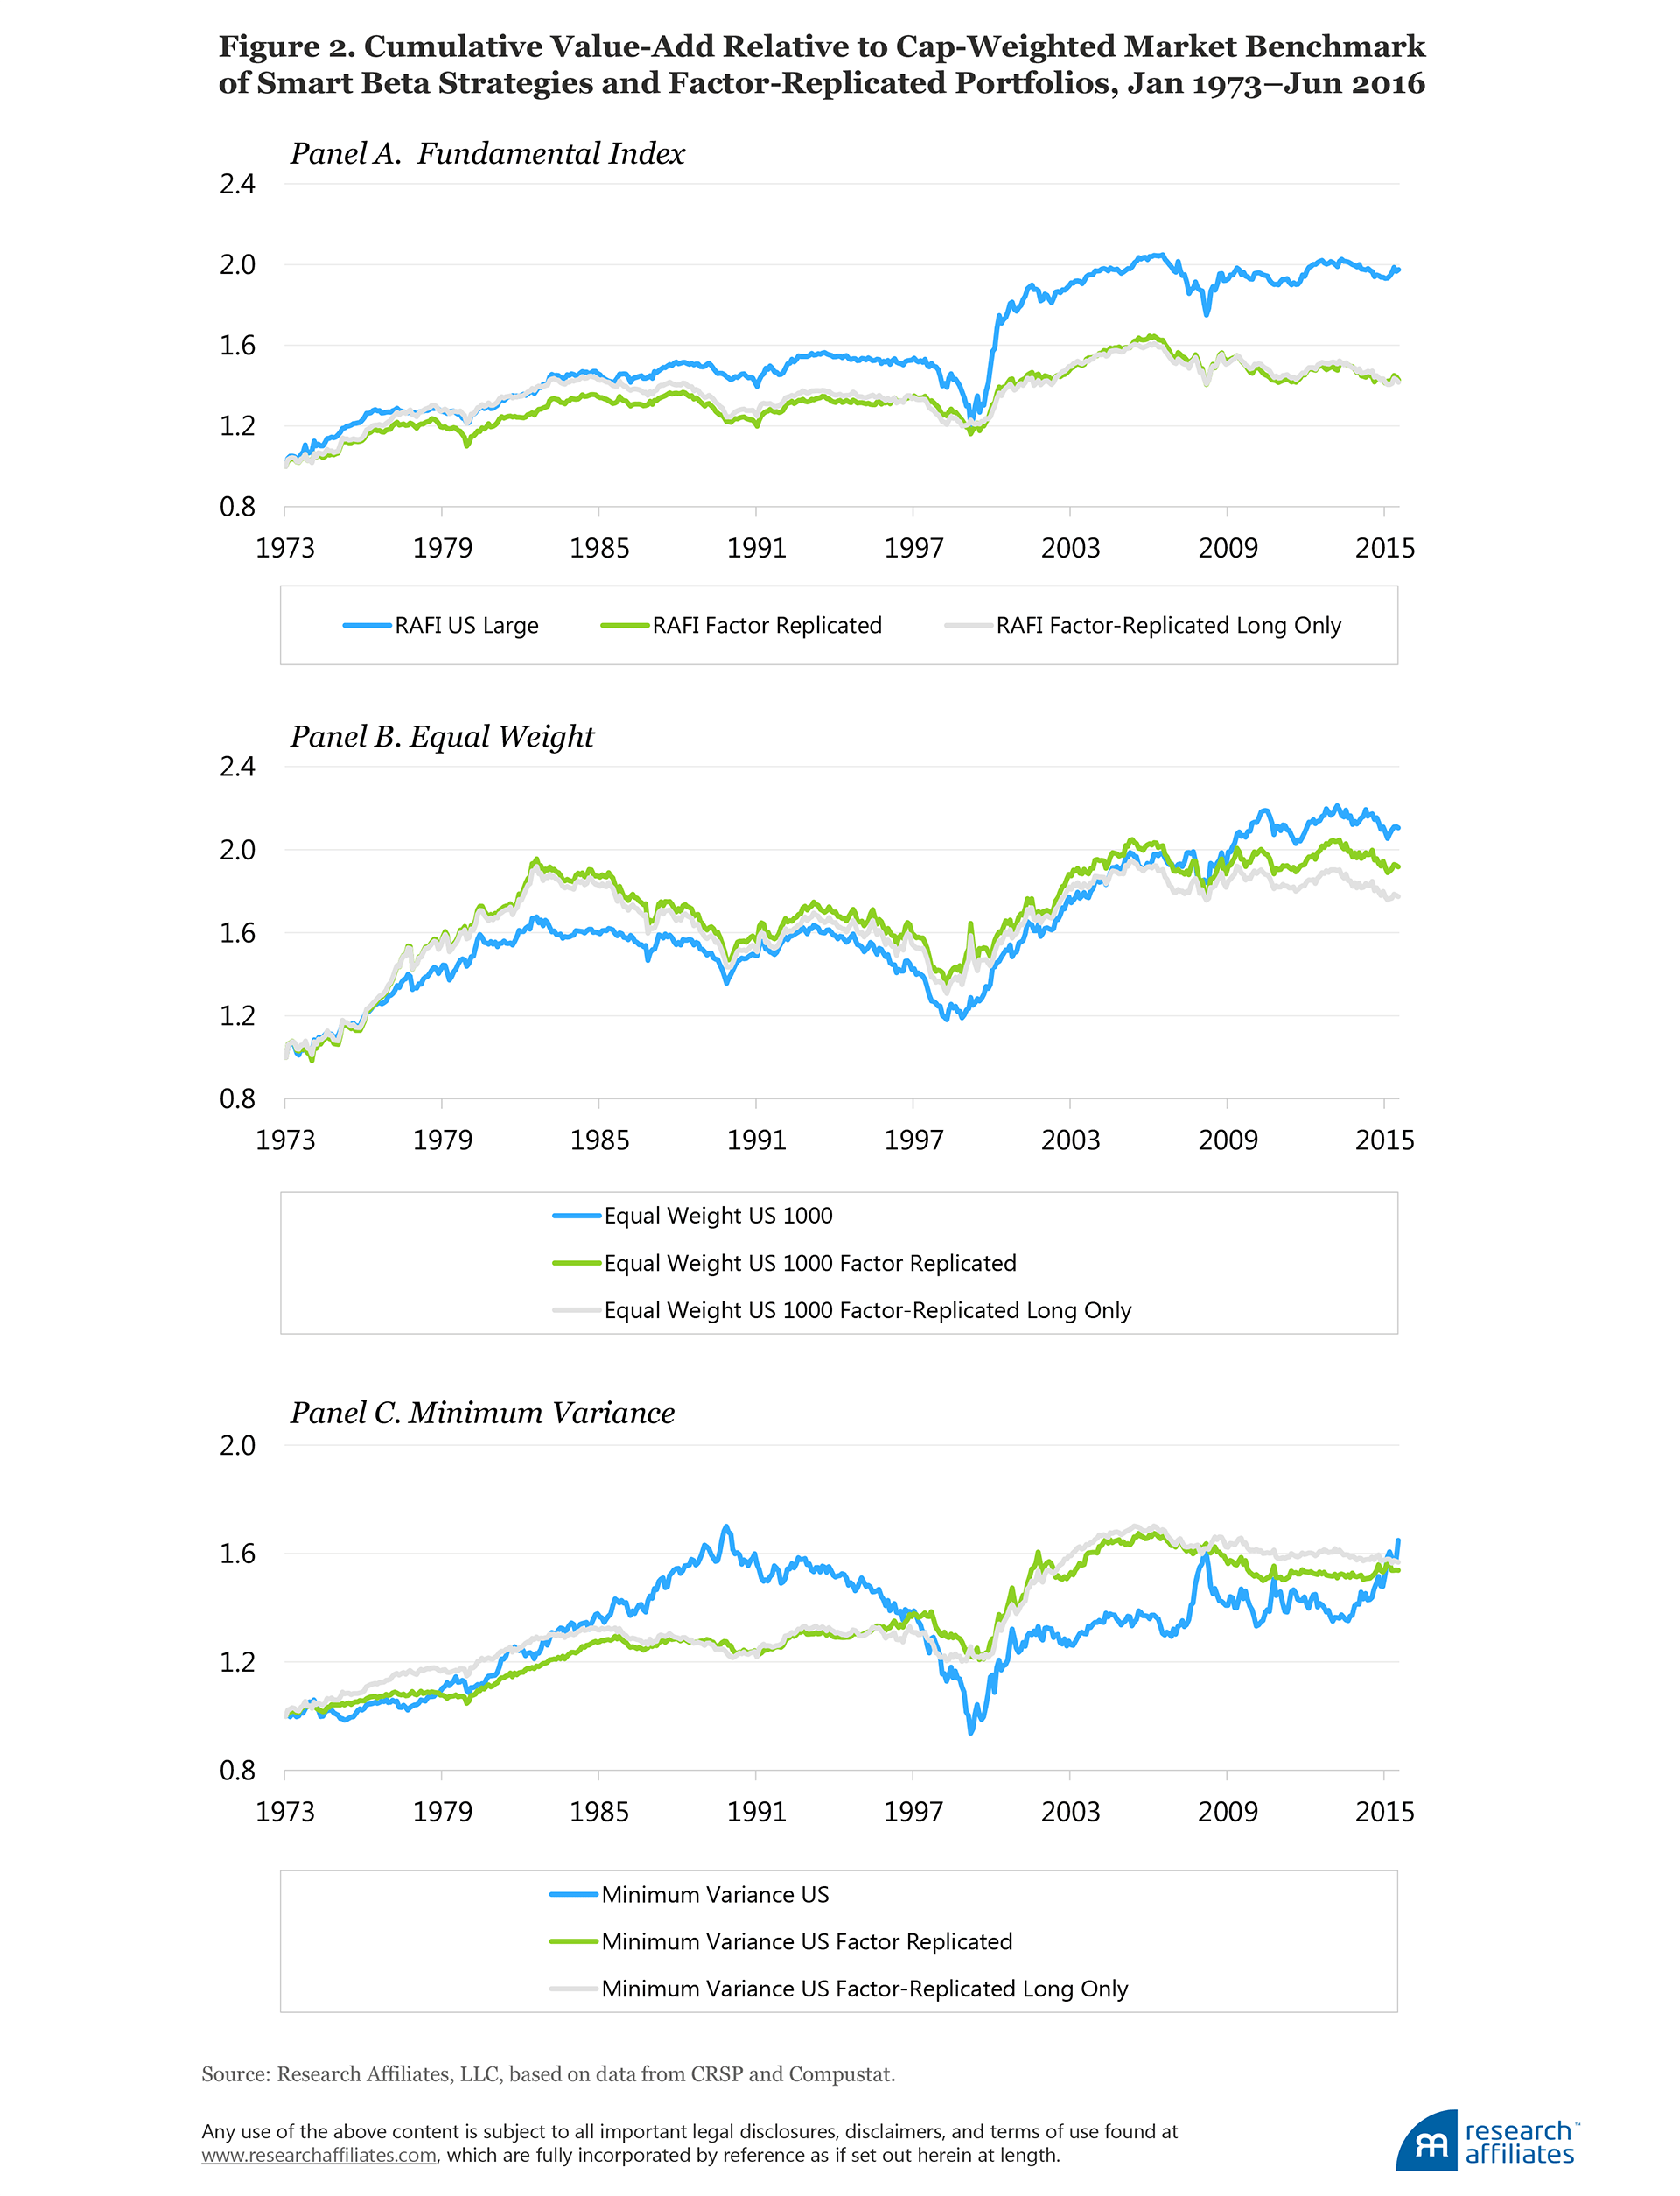
The time series of excess returns for each of the three strategies and their respective replicated portfolios over our sample period are plotted in Figure 2, Panels A–C.Clearly, the value added by the replicating strategies tracks the ups and downs of the original generation-one smart beta strategies reasonably well, but not at all precisely. We do not show the returns here, but the replicating strategies deliver rolling five-year excess returns relative to the cap-weighted market with an average correlation of 79% when compared with the original smart beta strategies we are seeking to match. Game over for the debate on smart beta versus factors? Hardly!
Can Smart Beta Returns Be Replicated with Factor Tilts?
The factor-replicated portfolios do a reasonable job of reproducing the average annualized returns and risk characteristics of the smart beta strategies over our sample period. This should not be surprising because they are constructed to do so. Nevertheless, the Fundamental Index, equal-weight, and minimum-variance portfolios generate 86, 25, and 18 more basis points of value-add a year, respectively, than their factor-replicated strategies, and with the exception of minimum variance, have higher Sharpe ratios and information ratios; minimum variance has roughly the same Sharpe ratio and lower information ratio. These data are all before trading costs.
The factor exposures of the replicated portfolios, reported in Table 2, have the same signs and relative magnitudes and factor attributions to excess returns as the smart beta strategies (once again, by construction).6
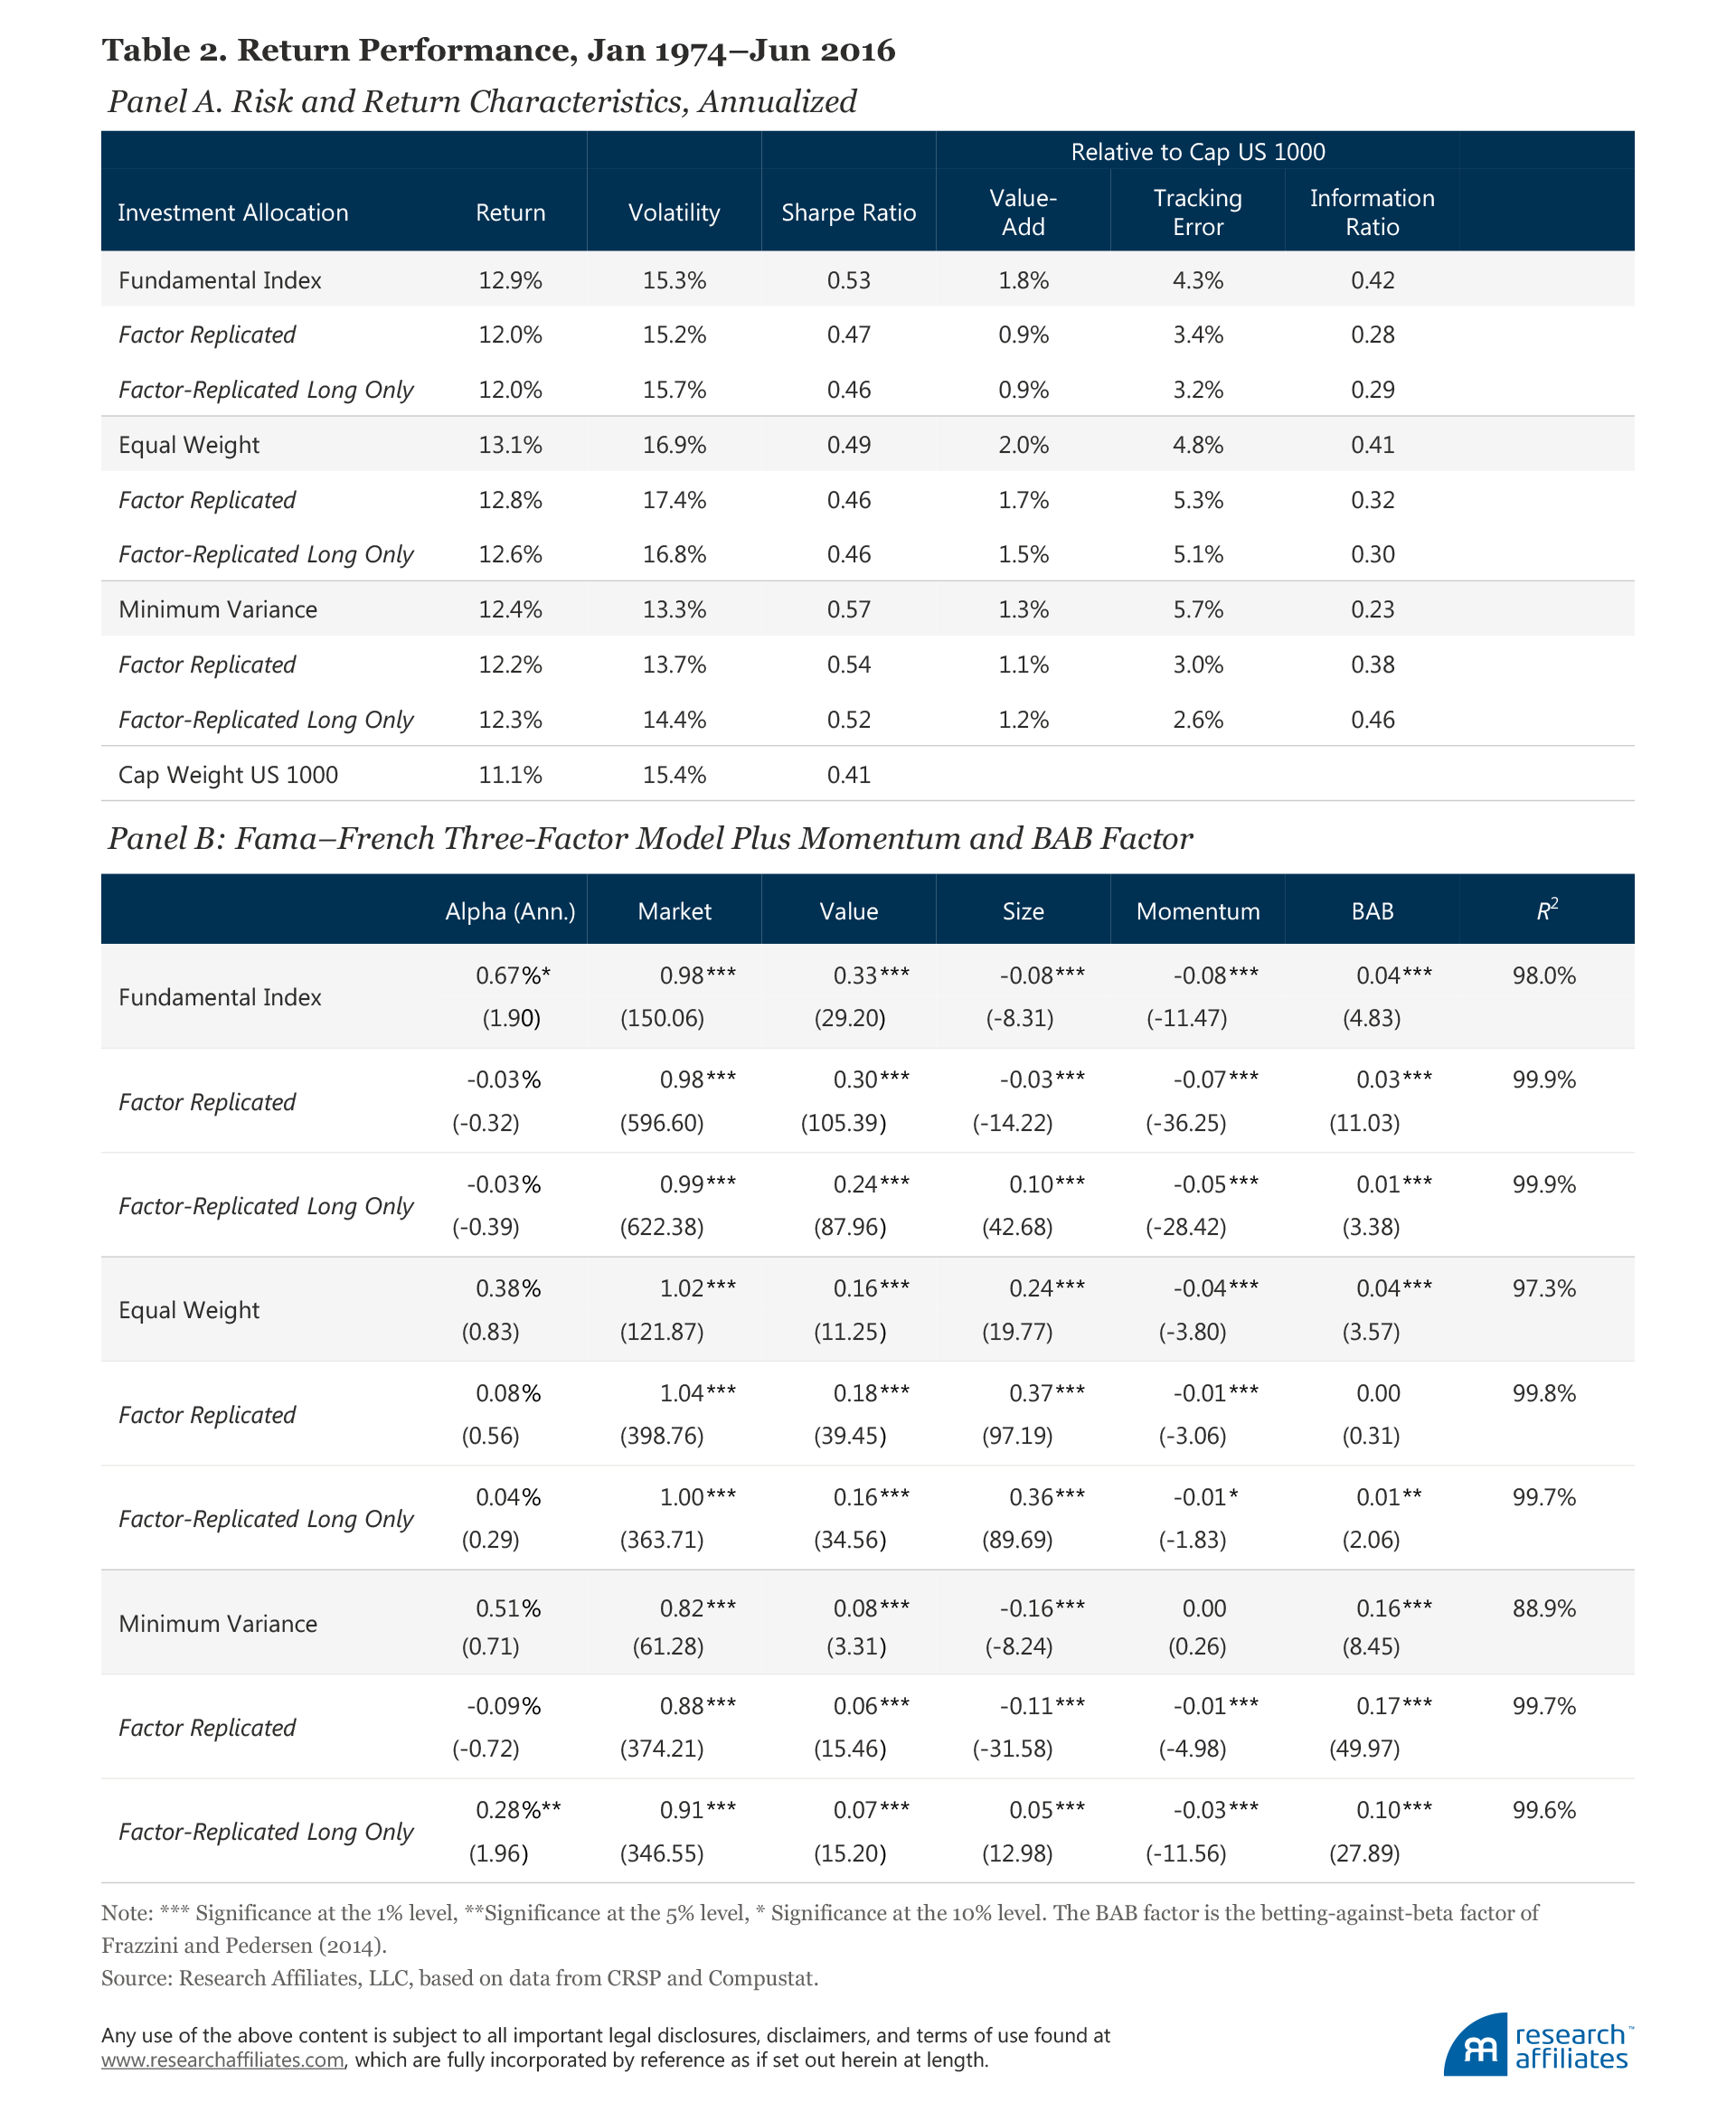
The story for minimum variance is slightly different. The market exposure of this replicated portfolio (0.88) is larger than the smart beta strategy (0.82), presenting a mild setback if the objective of the strategy is a lower beta and a lower volatility. The setback becomes obvious and more alarming if we strip out the short positions—to more closely mimic a long-only smart beta strategy—and look at the volatility and market factor loading for this long-only factor-replicated strategy. The long-only factor replication no longer looks like a minimum-variance strategy: it now sports a market beta of 0.91 with volatility rivaling that of the market (14.4%). An investor who wants to replicate minimum variance with factors would be hugely disappointed!
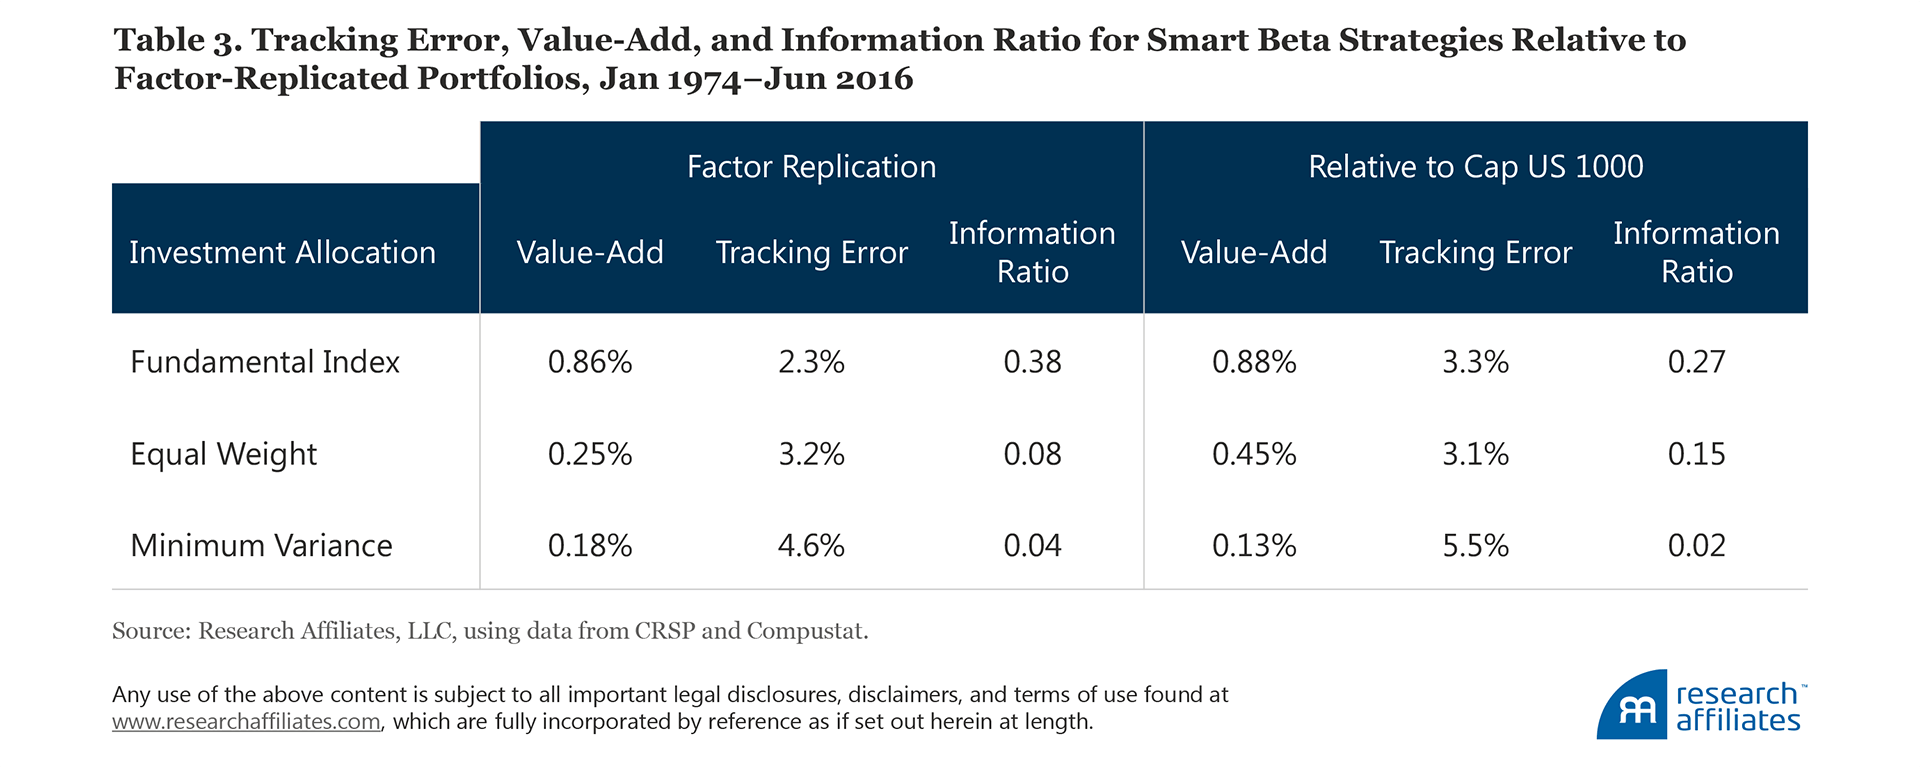
Although the factor-replicated portfolios deliver reasonable value-add, Sharpe ratios, and information ratios, the average return statistics mask just how different the replicated portfolio and smart beta strategy returns are. If we look more closely at the tracking errors, reported in Table 3, of the replicated portfolios to the smart beta strategies they seek to replicate, we find striking dissimilarities. Indeed, it seems the replicating portfolios are often roughly as different from the smart beta strategies—which they are seeking to replicate—as they are from the market!
Portfolio Characteristics
Simply looking at portfolio returns obscures other important ways that smart beta strategies and their factor-replicated portfolios are quite different. For instance, the Fundamental Index and its factor-replicated portfolios trade at a discount relative to the market, as is the nature of a Fundamental Index strategy.7 If we reweight the popular (and expensive) growth stocks down to their economic scale using fundamental measures of a company’s percentage weight in the macroeconomy (by sales, profits, book value, and dividends) and reweight the unloved (and cheap) value stocks up to their economic scale, we are introducing a value tilt.
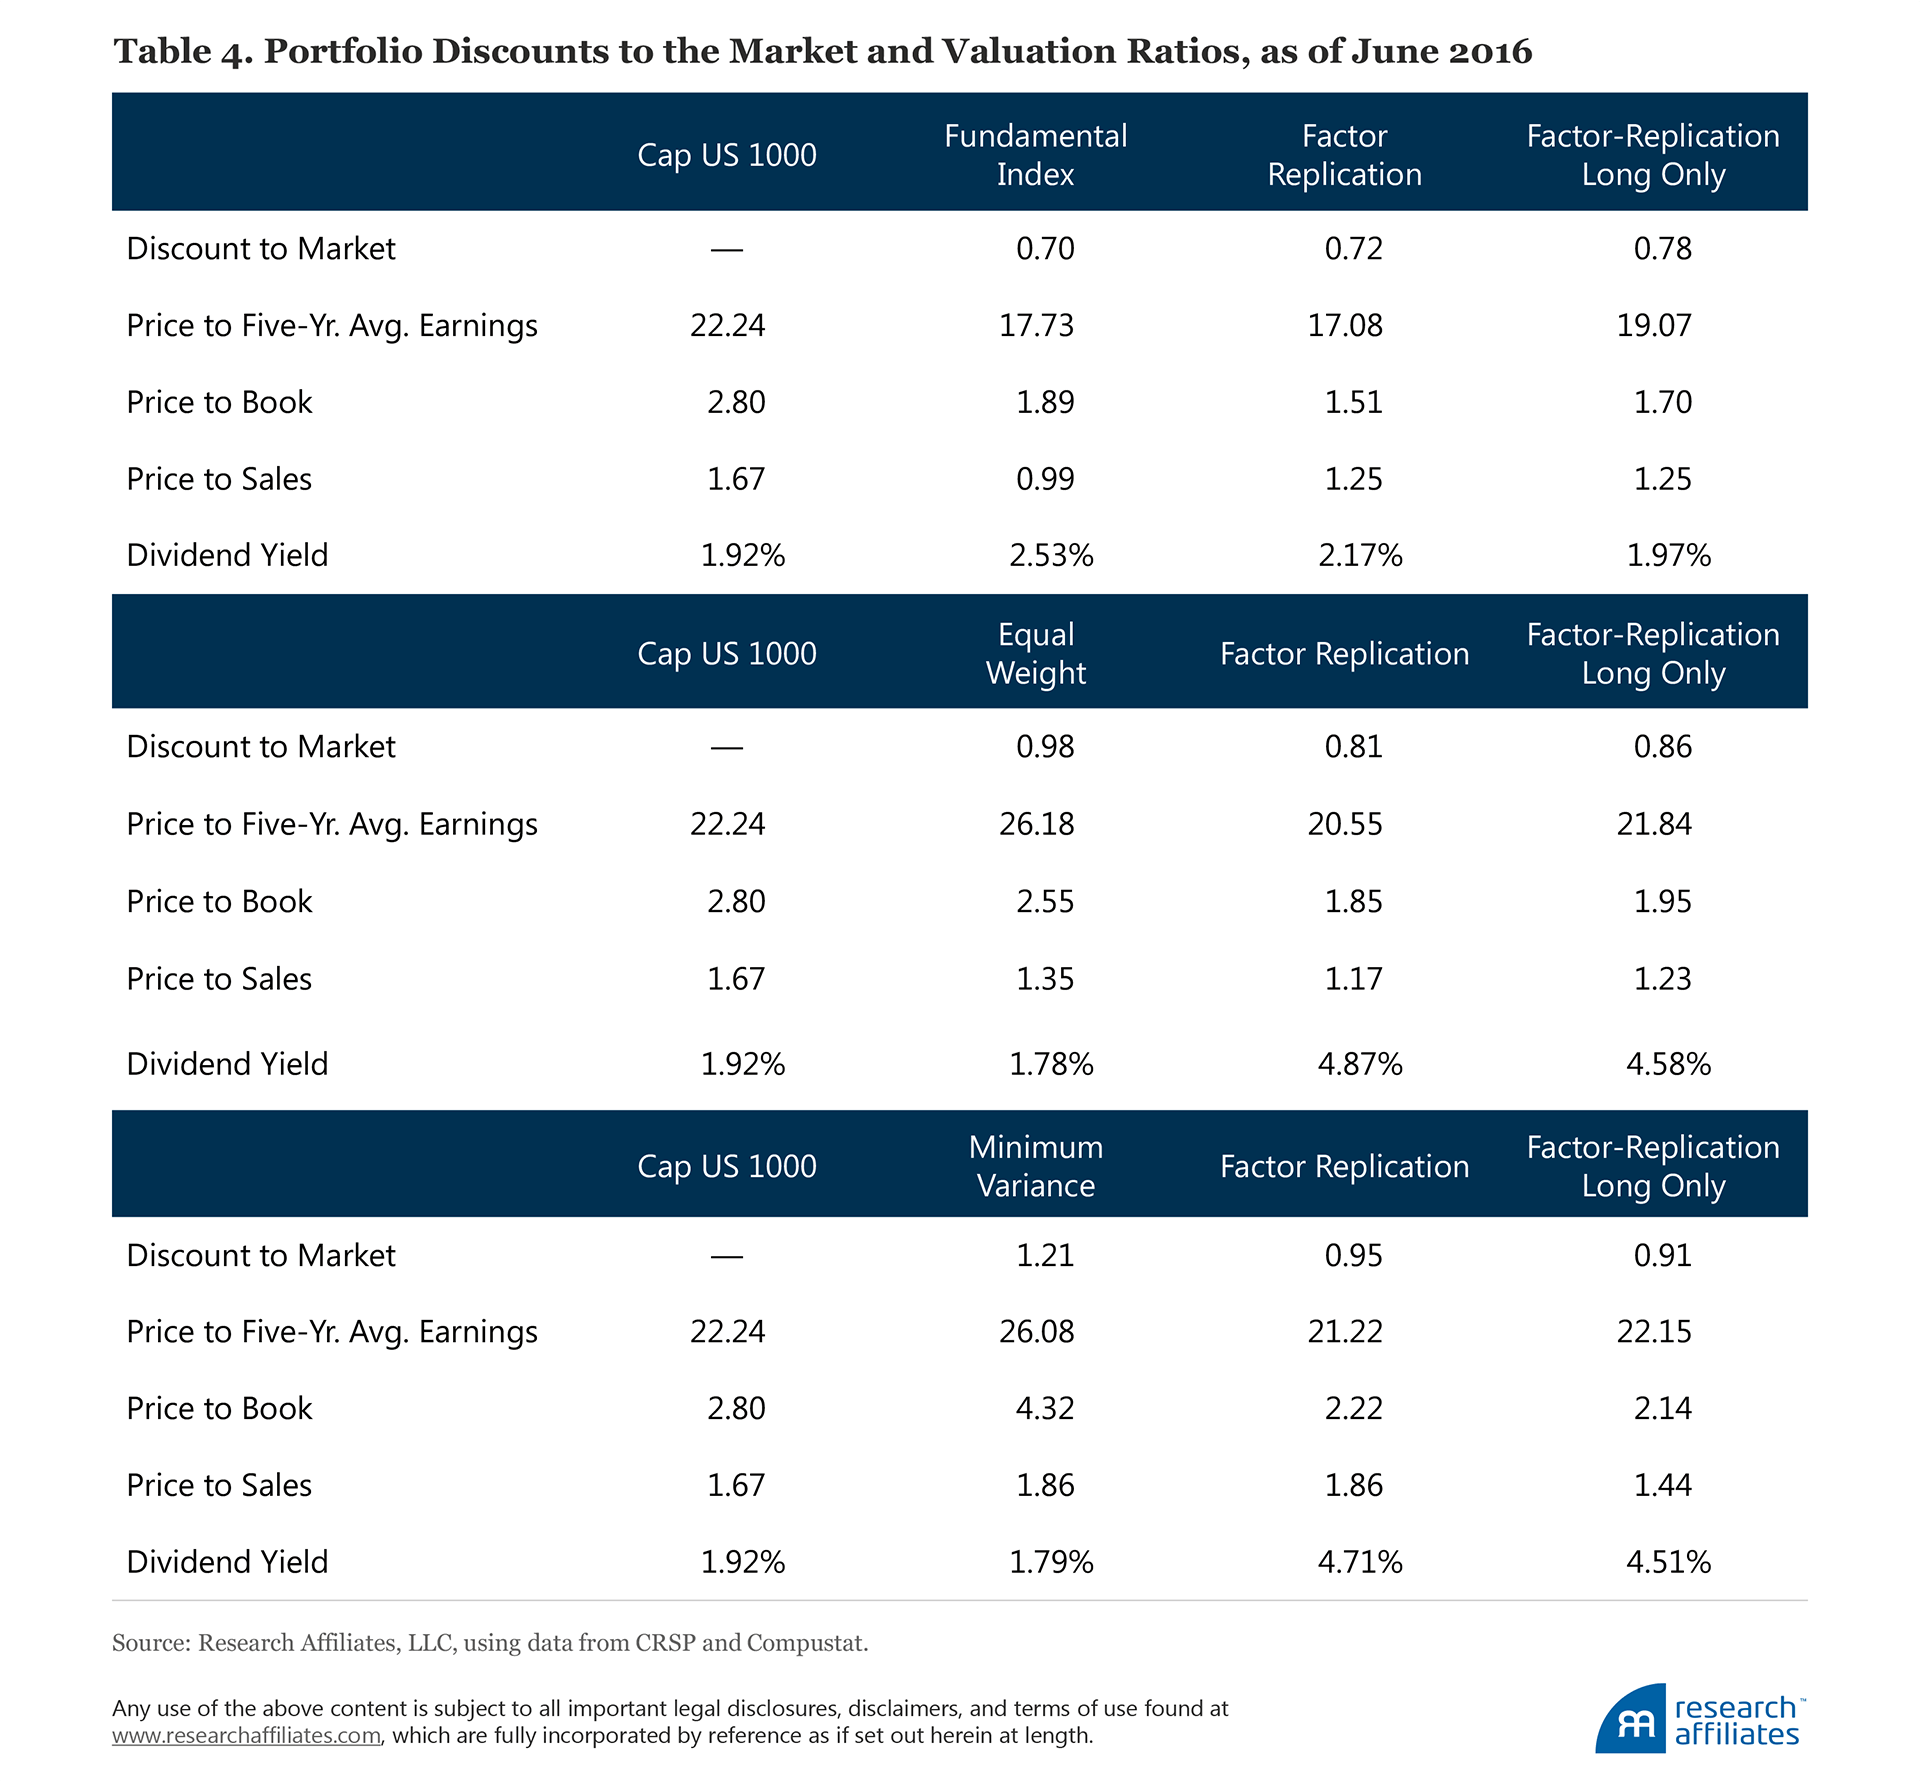
A comparison of valuation ratios, presented in Table 4, shows that the Fundamental Index trades slightly cheaper than its replicated portfolios. The replicated portfolios have a lower price-to-book ratio (due to the deep tilt toward the single value factor, which uses book-to-price as its only signal for value), while the Fundamental Index tends to select stocks with higher dividends. Equal weight and its replicated portfolios trade at a slight discount to the market with noticeable differences across valuation ratios, particularly in dividend yield. The differences across valuation ratios is the most striking in the case of minimum variance. The factor-replicated portfolios’ significant value and low-beta tilts result in a much larger market discount and tend to assign large weights to stocks whose valuations are depressed.
Comparing each portfolio’s periods of outperformance and underperformance relative to the cap-weighted benchmark, as reported in Table 5, reveals further differences. We find the factor-replicated portfolios underperform the benchmark twice as often (on a rolling five-year basis) as the Fundamental Index, with an average duration of underperformance more than twice as long, and a maximum duration of underperformance up to two years longer than the Fundamental Index. The equal-weight factor-replicated portfolios also underperform the benchmark more often, but with average and maximum durations similar to the equal-weight portfolio. In terms of drawdown, Fundamental Index and equal weight have nearly identical maximum drawdowns to their factor-replicated portfolios.
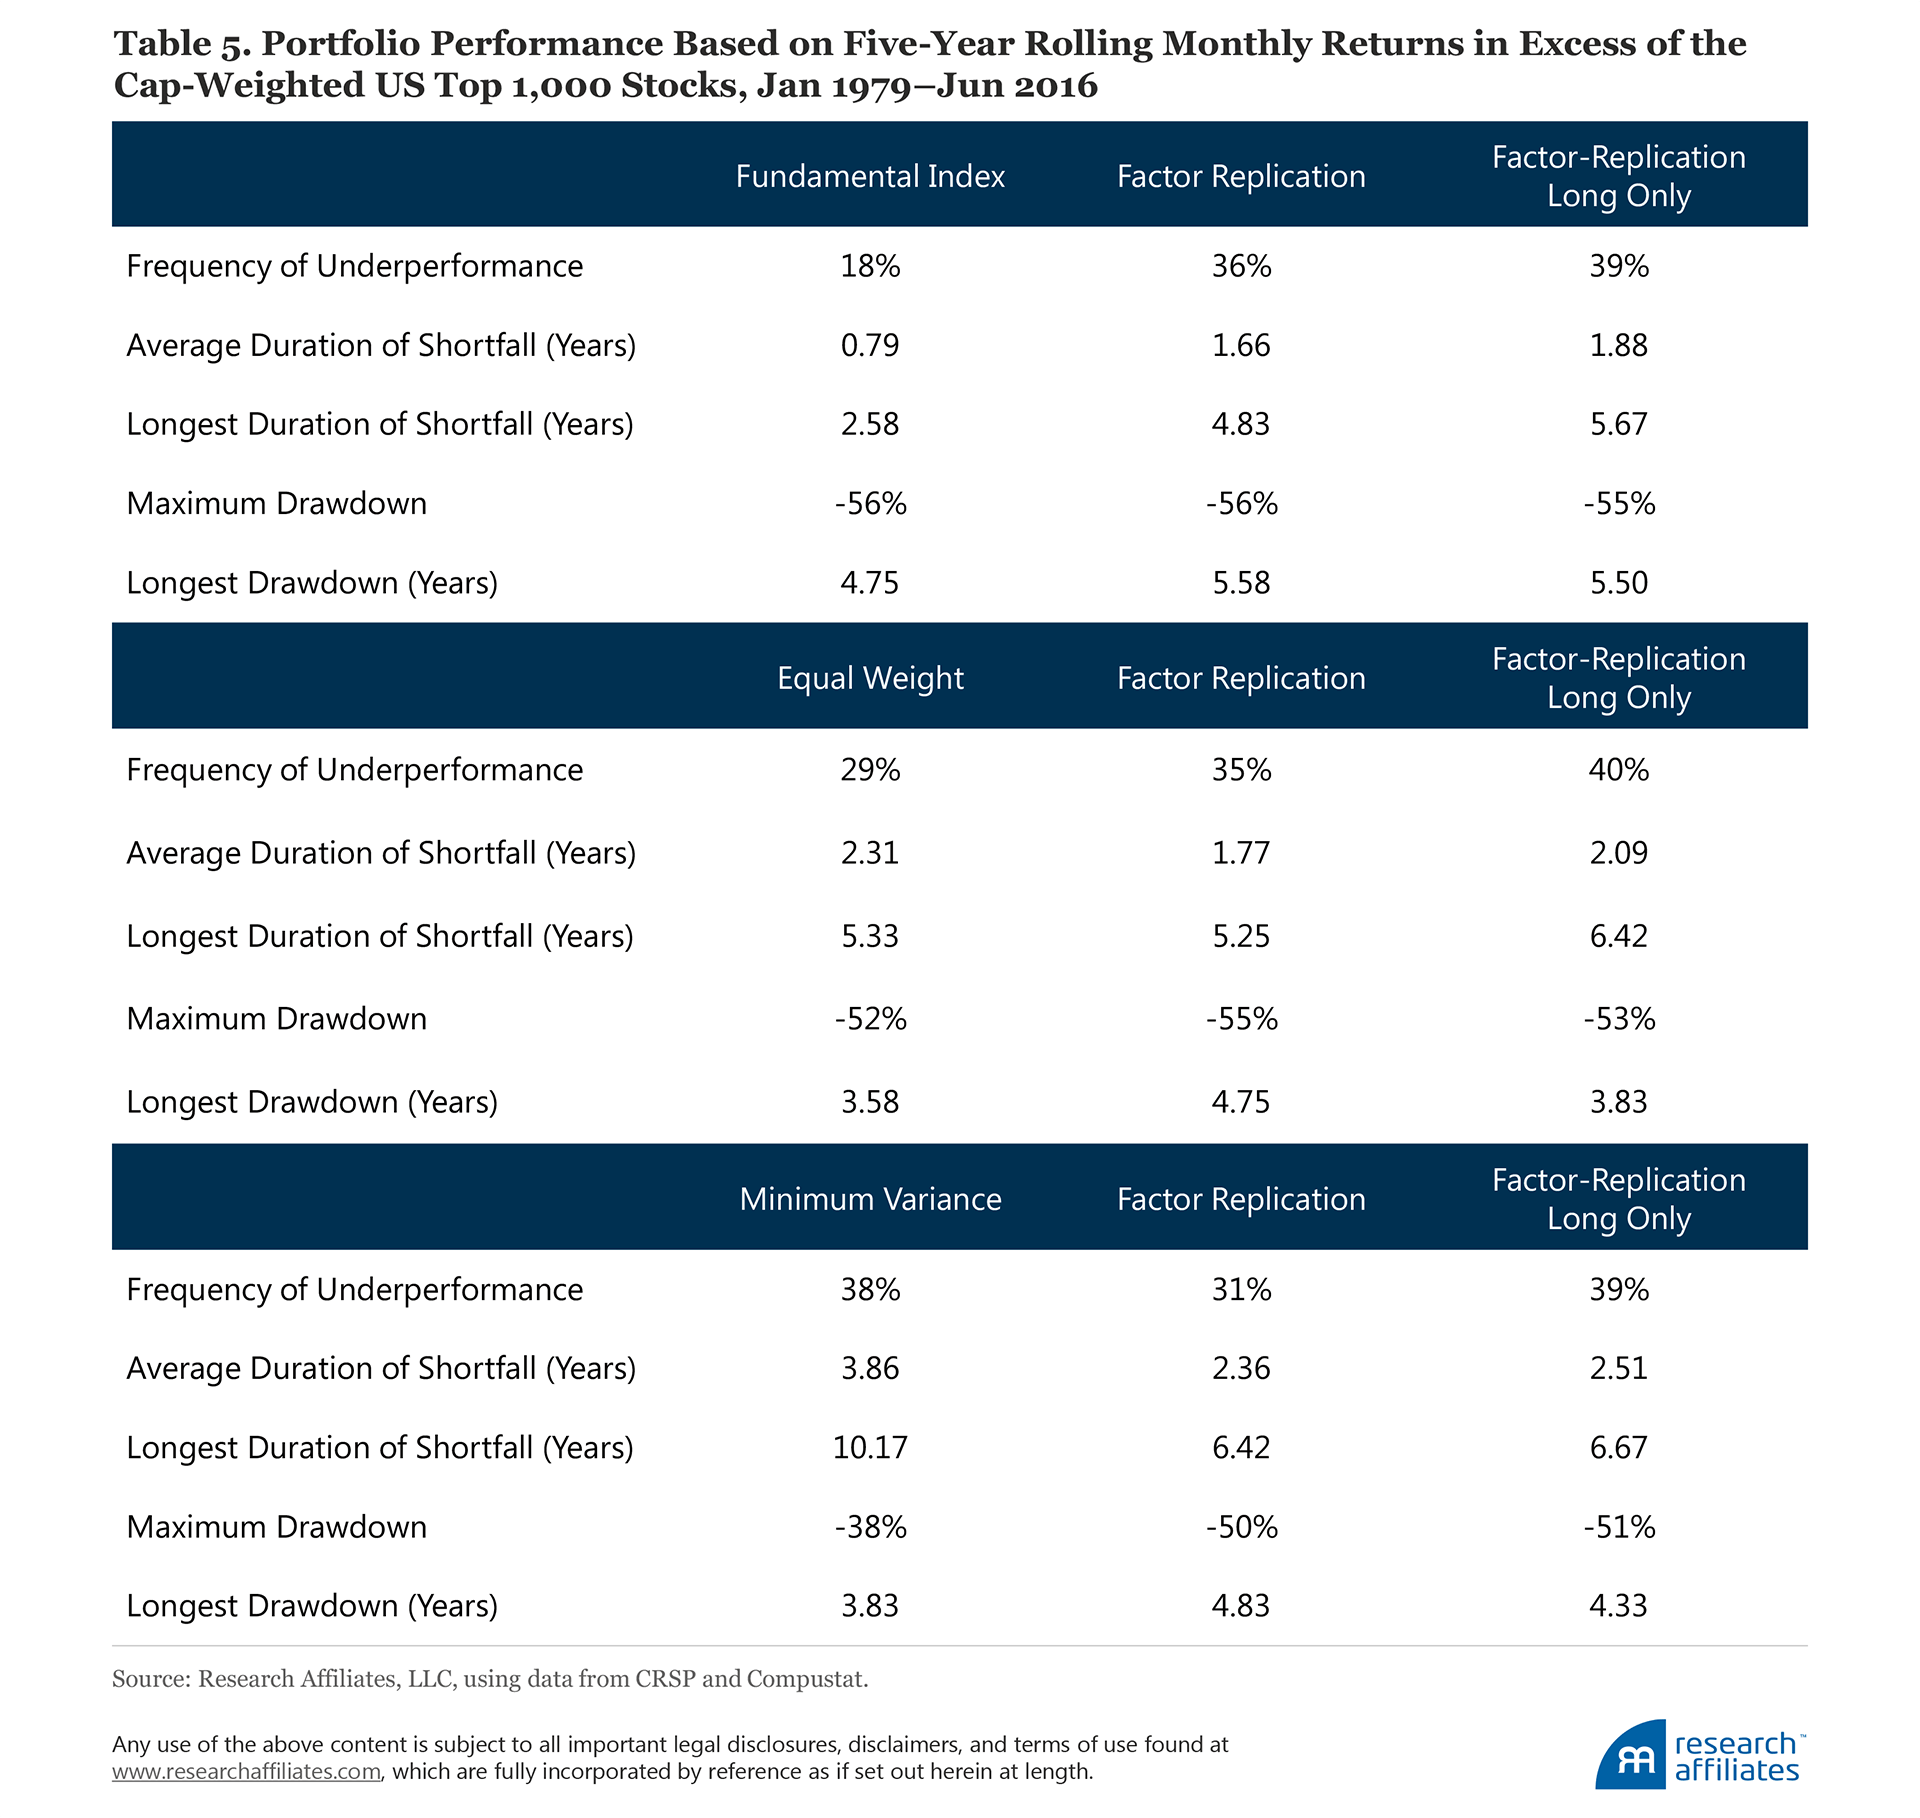
The minimum-variance factor-replicated portfolios underperform the benchmark about as frequently as the smart beta strategy, and have shorter average and maximum durations. The minimum-variance strategy has a much smaller maximum drawdown and shorter longest drawdown than its replicated portfolios; this is precisely what a minimum-variance strategy is designed to deliver. The replication strategies have a maximum drawdown of 50%, very near that of the market, forfeiting the raison d’être of minimum variance.
Certainly, an investor cares about a strategy’s return, valuation ratio, and performance relative to a benchmark, but trading costs and capacity, displayed in Table 6, are also very important. Here, a stark difference appears between the smart beta strategies and their replicated portfolios. The Fundamental Index factor-replicated portfolios are around 20–30 times more expensive to trade (assuming an AUM of $10 billion) than the Fundamental Index.8 Furthermore, annualized returns net of trading costs for the Fundamental Index factor-replicated portfolios are lower by 107–117 bps, and would only get worse with larger AUM. We see a similar pattern for the equal-weight and minimum-variance factor-replicated portfolios.9
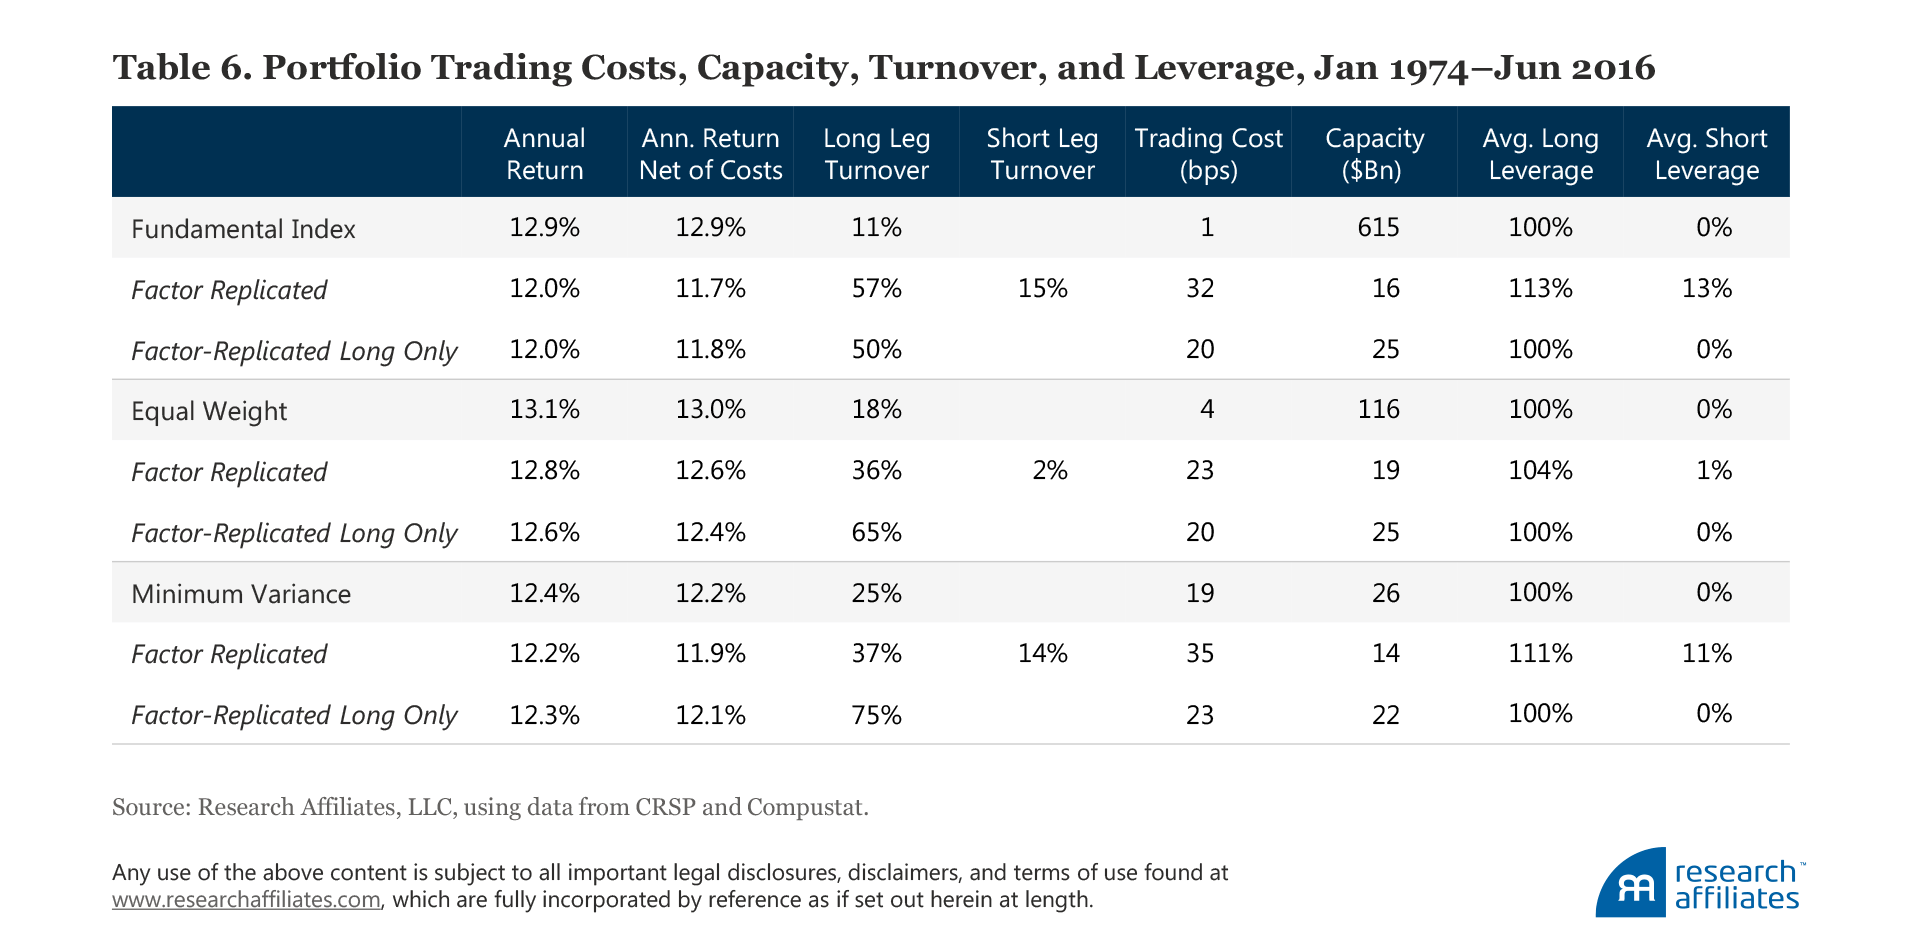
Trading costs are much higher for the replicated portfolios because they inherit a monthly rebalancing frequency from the momentum factor portfolio, whereas the Fundamental Index and equal-weight strategies are rebalanced annually and the minimum-variance strategy semi-annually. This difference becomes apparent when comparing portfolio turnover. The Fundamental Index factor-replicated portfolios have five-times higher turnover than the turnover of the Fundamental Index, while equal-weight and minimum-variance factor-replicated portfolios turn over about two to three times as much as the smart beta strategies they replicate.
When these portfolios are traded in a live setting their capacity is a very important consideration. We measure capacity as the amount of AUM that would generate an estimated 50 bps of price impact in the trading level of the portfolio.10 Again, a large difference emerges between the smart beta strategies and their factor-replicated portfolios when comparing their relative capacities. The Fundamental Index has around 25–40 times larger capacity than its factor-replicated portfolios. The replicated portfolios not only have far higher turnover, they also have many more large positions in illiquid stocks—a triumph of quant paper portfolios over practical realities. Meanwhile, equal weight has 5–6 times larger capacity, and minimum variance almost twice the capacity of its replicated portfolios. The differences between the trading costs, turnover, and capacity of these smart beta strategies versus their factor tilt–replicated portfolios are substantial and directly impact the efficacy of any factor tilt that seeks to replicate a particular smart beta strategy.
A Deeper Dive into Portfolio Holdings
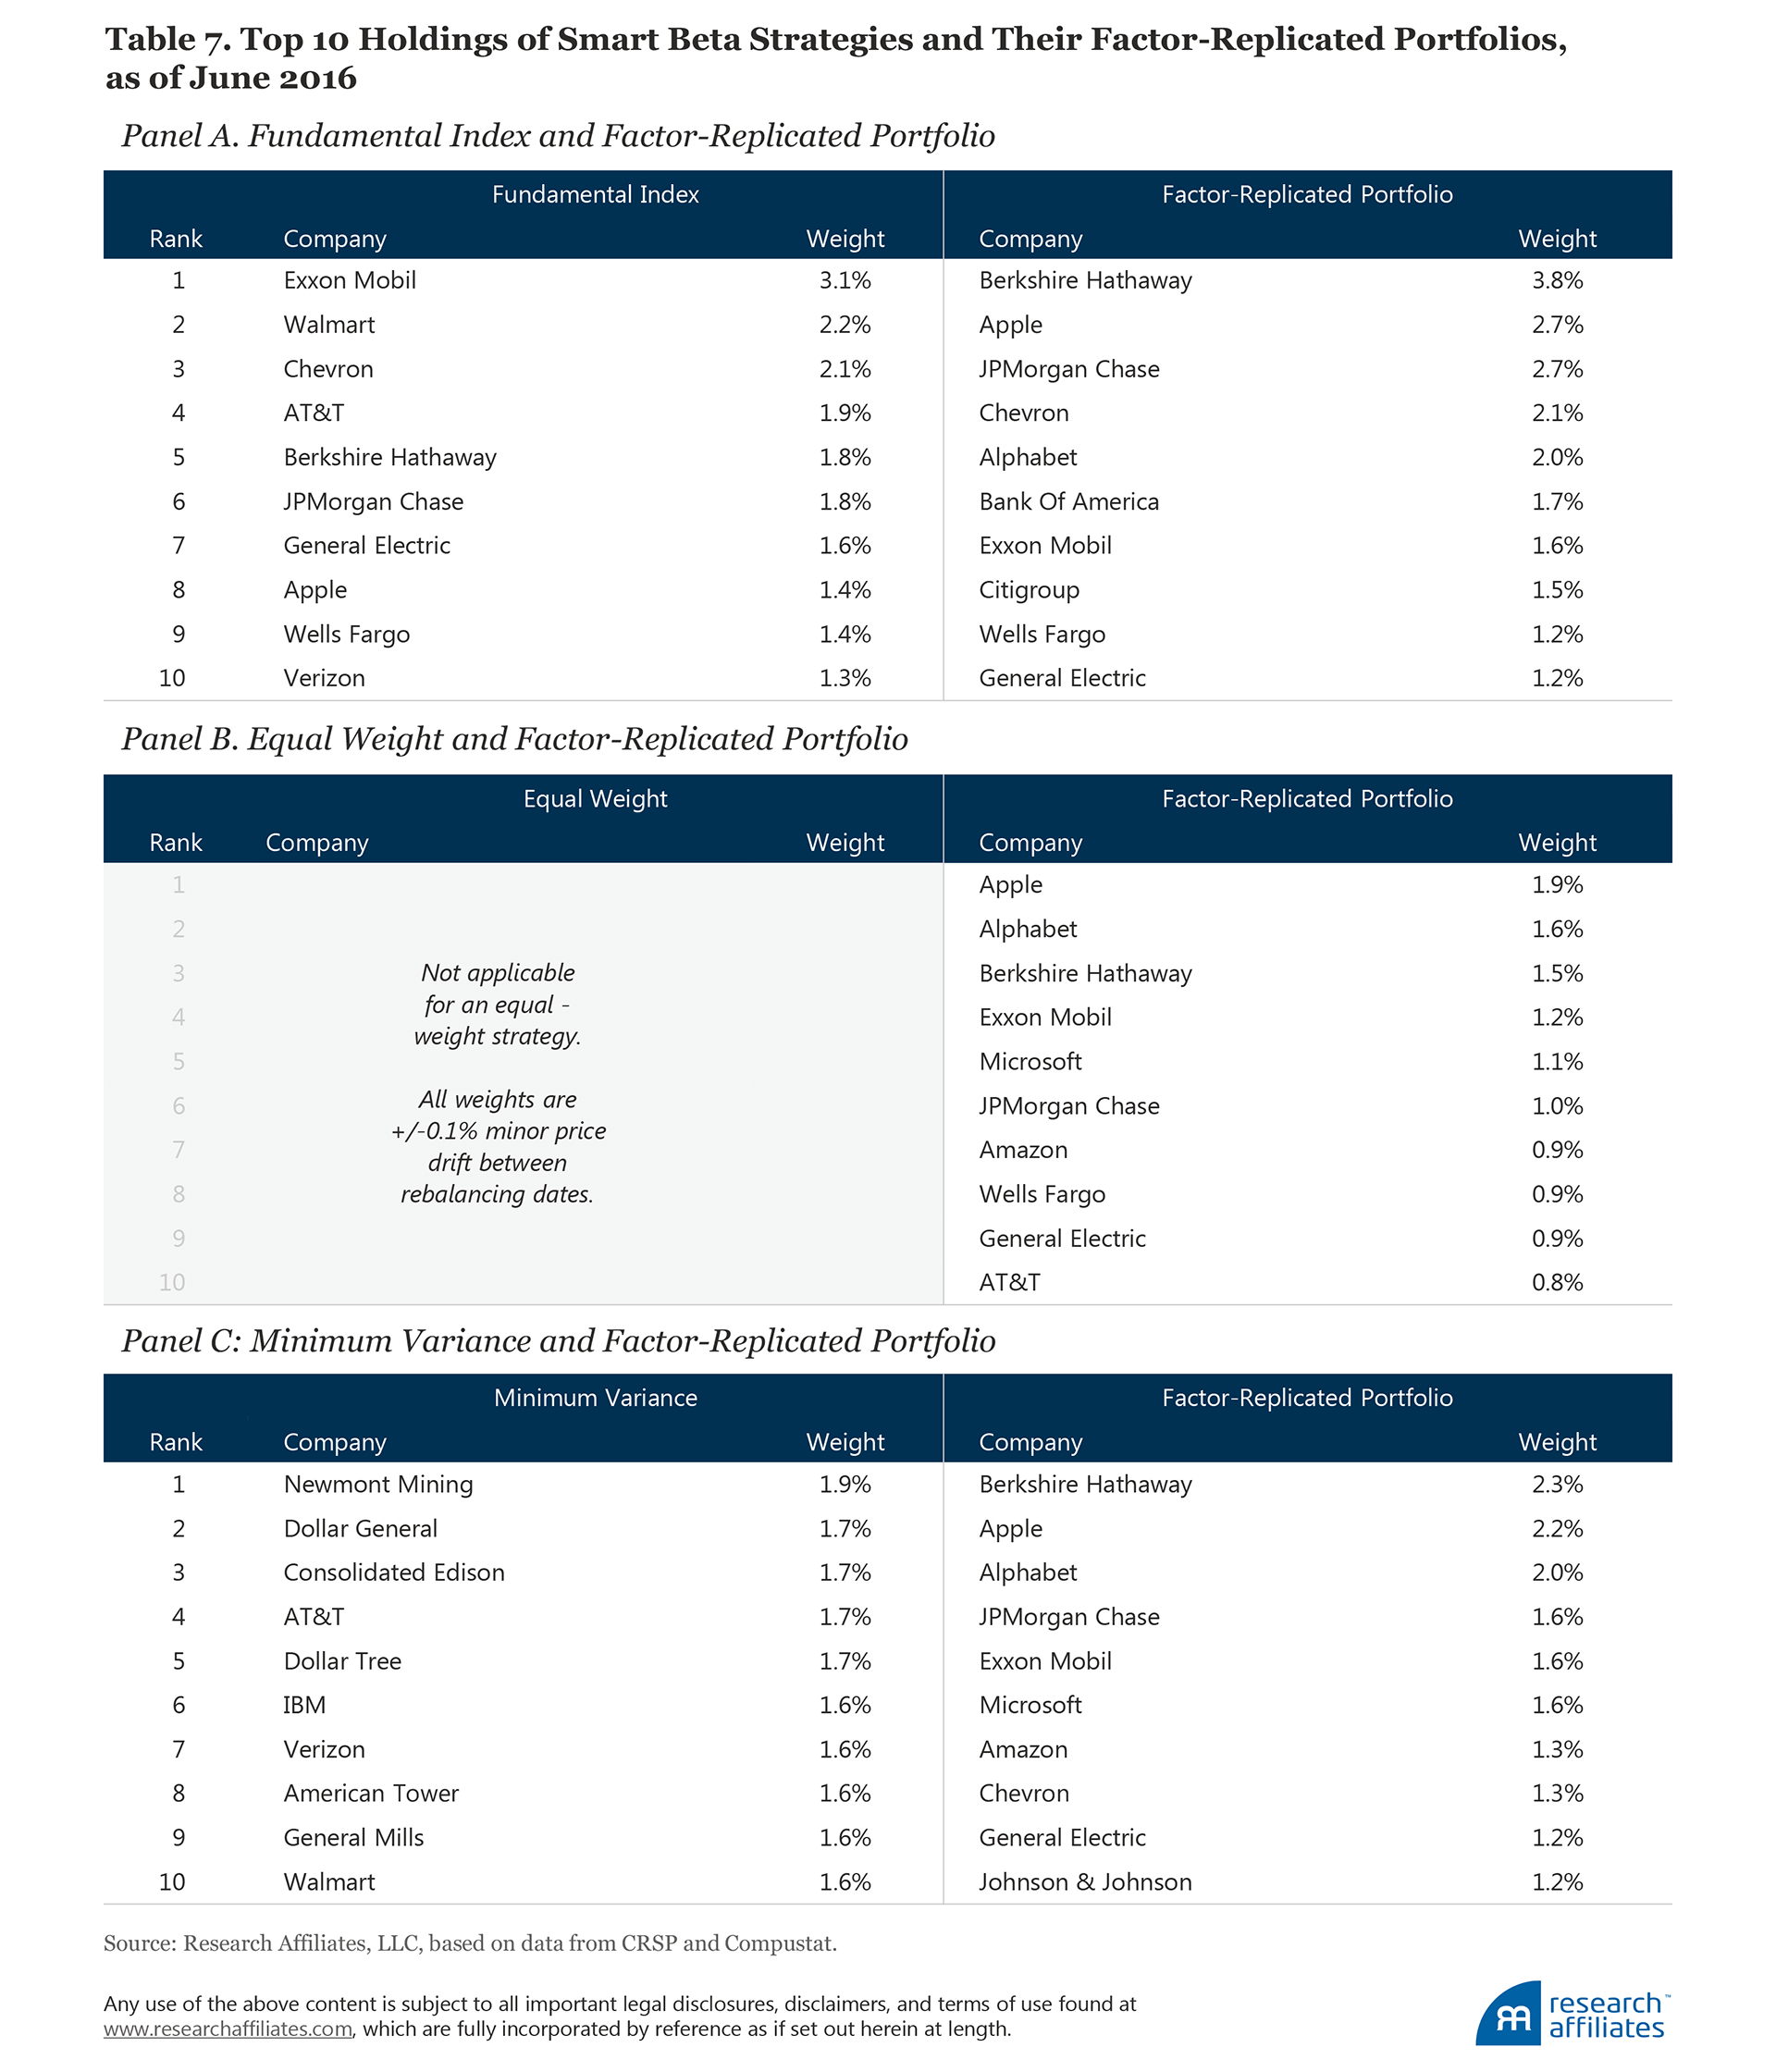
Factor exposures are just one source of risk in evaluating smart beta strategies and their factor-tilt replicated portfolios. The replicated portfolios ought to look vaguely like the portfolios they ostensibly seek to replicate. The top 10 holdings of these smart beta strategies and their replicated portfolios at the most recent rebalancing show some overlap for Fundamental Index, but the differences for the other two are astonishing.11
Let’s first look at the Fundamental Index. The Fundamental Index gives almost twice as much weight to Exxon as its replicated portfolio, and only half as much weight to Berkshire Hathaway; meanwhile, Walmart, which is the second-largest US business in the Fundamental Index, doesn’t even crack the top 10 in the replicated portfolio. The core principle of the Fundamental Index is to use the size of a business—blending sales, profits, book value, and dividends as a measure of a company’s economic footprint in the macroeconomy—as a stable, economically meaningful anchor to contra-trade against the market’s constantly changing expectations and speculations. Even though 7 of the top 10 stocks on both lists are the same, the replicating portfolios are not conforming to a guiding principle of the Fundamental Index.
For equal weight, the results are really quite shocking. The replicating portfolios are not even vaguely equally weighted. Furthermore, the names at the top of the list are generally jumbo-cap stocks. How can a portfolio that purports to replicate a strategy that equally weights 1,000 stocks have nearly 12% invested in its top 10 holdings, which are all jumbo caps? This is, of course, a natural consequence of starting with a cap-weight portfolio, and then applying factor tilts to match the factor loadings of the equal-weight portfolio.
Finally, the top 10 holdings of the minimum-variance strategy are entirely different from its replicated portfolio. In Table 7, not a single stock in the top 10 holdings of the replicating portfolio matches the minimum-variance strategy it seeks to replicate. Not one.
Conclusion
Today, smart beta strategies are attracting attention because they seek to capture systematic drivers of return in transparent, low-cost vehicles. We find that simple factor tilt strategies based on theoretical factors (although very helpful in educating investors on the systematic drivers of return) are rarely the best way to capture return premiums, particularly when taking into account transactions costs. Really smart smart beta strategies should be designed to optimally capture these return premiums and be able to deliver them to investors after trading costs. Factor tilts can be smart or stupid, expensive or cheap, but most of them are not smart beta based on the original definition that inspired Towers Watson to coin the expression.
We have also demonstrated that first-generation smart beta strategies cannot be replicated from their factor tilts. The strategy and its factor tilts are not one and the same. Whereas the factor loadings can easily be matched, the resulting factor-replicated portfolios typically have higher turnover, larger trading costs, smaller capacity, more frequent and prolonged benchmark underperformance, larger drawdowns, higher residual risk, and lower returns. Not a good result. Furthermore, as in the case of minimum variance or equal weight, a factor tilt portfolio may give us something very different from our intended portfolio. Not minimum variance. Not equal weight. Not even close!
Have we proven that factor tilts are not part of the family of smart beta strategies? Of course not. That’s a matter of mere semantics. Just as Bill Sharpe rejects the term “smart beta,” early advocates of smart beta may prefer the industry hew to a narrow definition of the term. A narrow definition limits the term to strategies that do not tie the portfolio weight to the share price, and using that narrow definition, factor tilts generally aren’t smart beta. But, we don’t control the definition.
Reciprocally, a broad definition allows just about any strategy to qualify, including factor tilts. Indeed, as many in the investment industry now define the term, almost any approach other than a full market cap–weighted index seems to qualify for the smart beta label, including cap-weighted market segments (e.g., Russell 1000 Value… or Growth), tilted cap-weight (e.g., Fama–French value), and niche strategies (currency-hedged small-cap emerging markets). If smart beta spans almost everything, the term means absolutely nothing.12
Our findings suggest that smart beta strategies cannot be replicated with simple factor tilts. If investors assume otherwise, we ignore the fact that the original smart-beta strategies generate alpha by breaking the link between price and portfolio weights. While a smart beta strategy has factor tilts, it truly offers much more because it delivers different return and portfolio characteristics from those simple factor tilts, and it delivers alpha net of the factor tilts and net of the Fama–French four- or five-factor regressions. Investors who might think smart beta is nothing more than simple factor tilts should be cautioned by the point we made earlier—although all Rolexes are watches, not all watches are Rolexes.
Endnotes
1. The Fundamental Index and equal-weight strategies are rebalanced annually at the beginning of January. The minimum-variance strategy simulation is based on the MSCI USA Minimum Volatility Index methodology to employ a constrained optimization on the US Large + Mid-Cap universe to minimize volatility. Constraints include minimum and maximum constituent, country, and sector weights, as well as turnover. The optimization is recomputed semi-annually.
2. Annualized average returns are measured using monthly returns from the Russell 1000 Value Total Return Index, S&P 500 Total Return Index, and FTSE RAFI US 1000 Index. All returns are measured over the period January 1, 2006, to February 28, 2017.
3. For example, a Fundamental Index portfolio based on book value will weight every stock by its book value, which is equivalent to weighting a stock by its price times its relative book-to-price ratio. Classic value indices simply throw out the growth stocks and capitalization weight the value stocks, as does the Fama–French value factor portfolio.
4. For more details, please refer to Brandhorst (2006) and Asness et al. (2015).
5. There are various ways to avoid look-ahead bias. This expanding regression methodology will eventually converge to estimating full-sample factor betas toward the end of our data sample. Alternatively, we could have used a rolling-window framework to better capture the fact that factor betas are time varying. Our goal is to replicate a smart beta strategy’s returns by constructing a factor tilt portfolio in each month based on the information available to investors at that point in time. Choosing between methodologies is a modeling choice. What we gain in capturing a more dynamic factor tilt from rolling-window regressions, we lose by estimating the betas less precisely on fewer observations. In unreported results, “dynamic” factor-tilt portfolios constructed from rolling regressions generate even higher turnover, because replicated portfolio weights move around more with the dynamic factor betas, resulting in even greater turnover and worse returns net of trading costs.
6. The expanding window regression methodology used to prevent look-ahead bias in the replicated portfolios will generate slightly different in-sample factor loadings for these portfolios, by construction. These factor loadings would be equal to the factor loadings of the smart beta strategies, and the market betas would be exactly equal to one, if they were instead estimated once in sample.
7. The discount is measured by taking the average of the ratios of the portfolio’s P/E, P/B, P/S, and P/D to the market’s respective valuation ratio. A value less than one means the portfolio is trading at a discount relative to the market.
8. Trading costs are calculated based on the Aked and Moroz (2015) trade cost model. The model assumes a 30 bp price impact per 10% of average daily volume consumed by the portfolio turnover. We appreciate and acknowledge the help of Alex Pickard in computing trading costs and capacity.
9. A reader could easily quibble with our methodology for calculating trading costs. It’s harder to contest the notion that the turnover is five times as high, with much heavier use of illiquid and thinly traded small stocks in the replicating portfolios than in the standard Fundamental Index. Do we reach the point where 100 bps of damage is done at $10 billion of AUM? Or is trading easier than we suggest, and the threshold for this magnitude of damage is $25 billion? Trading costs are squishy. The relative magnitude of the costs is probably about right; the threshold at which these costs are reached is arguable. The costs could also be worse and the capacity lower than we suggest. Ouch.
10. We report capacity assuming the portfolios are rebalanced quarterly. Monthly smoothing of trading (same trades spread over three months) should boost capacity by about 70%, and weekly rebalancing should double it again. Consequently, these figures all offer room for improvement.
11. For economy of space, we show only the full replication portfolios, with long–short replication. The long-only replication portfolios—at least for the top 10 holdings—look rather similar. None of the short positions is large enough to be included in the top 25 holdings, let alone the top 10.
12. In a recent and most amusing example, etfDB.com published a summary early in 2017 of the 25 largest smart beta ETFs. The two largest were the Russell 1000 Value and Russell 1000 Growth ETFs. Suppose a newcomer to the smart beta landscape decided to invest in the two largest just to get a “toe in the water.” Doing so they would be buying the Russell 1000—the market!
13. The term "factor" in this context usually has a specific meaning:the returns of a long–short portfolio. Although the Fundamental Index weight is not a value factor in this sense of the word, it captures the value premium.
14. Specifically, the book-to-price, sales-to-price, and cash-flow-to-price ratios and the dividend yield.
References
Aked, Michael, and Max Moroz. 2015. "The Market Impact of Passive Trading." Journal of Trading, vol. 10, no. 3 (August):1–8.
Arnott, Robert D., Jason Hsu, Vitali Kalesnik, and Phil Tindall. 2013. “The Surprising Alpha from Malkiel’s Monkey and Upside-Down Strategies.” Journal of Portfolio Management, vol. 39, no. 4 (Summer):91–105.
Asness, Clifford, Andrea Frazzini, Ronen Israel, and Tobias Moskowitz. 2015. “Fact, Fiction, and Value Investing.” Journal of Portfolio Management, vol. 42, No.1 (Fall):34–52.
Brandhorst, Eric. 2006. “Fundamentals-Weighted Indexing Offers New Insight on Value Investing.” State Street Global Advisors White Paper (January).
ETFdb.com. 2017. “Smart Beta ETF List.” May 10.
Frazzini, Andrea, and Lasse Heje Pedersen. 2014. “Betting Against Beta.” Journal of Financial Economics, vol. 111, no. 1 (January):1–25.
Appendix: Smart Beta Factor–Replicated Portfolios
We employ a five-factor model comprising the standard Fama–French three-factor model, which includes the market (MKT), value (HML), and size (SMB) factors augmented by the momentum (WML) factor and the Frazzini–Pedersen (2014) low beta, or BAB, factor.
Following the Fama–French model (the most commonly accepted way to define factor portfolios among both academics and practitioners), the market factor is the monthly return difference between the market capitalization–weighted portfolio of all US stocks and US Treasury bills. The size factor is a long–short portfolio capturing the monthly return difference between large- and small-cap stocks. The US large-cap equity universe consists of stocks whose market capitalizations are greater than the median market capitalization of stocks listed on the NYSE.
The value and momentum factors are also long–short portfolios of monthly returns, which select stocks for their long and short positions based on relative book-to-price ratios and trailing 12-month performance. Within both large- and small-cap groups (defined by median NYSE breakpoints), we construct the long portfolio from the top 30% of stocks in the US market with the highest price-to-book ratio (value) or largest 12-month trailing returns (positive momentum); the short portfolio consists of the bottom 30% of stocks in the US market with the lowest price-to-book ratio (growth) or smallest 12-month trailing returns (negative momentum). Stocks held in both long and short portfolios are cap-weighted.
Following Fama and French, the value and momentum factors equally blend the long and short factor portfolios between large-cap and small-cap companies in order to control for the size factor and to isolate the return premium generated by the value and momentum factors. The outcome, however, may be quite different from the intent. For many factors, the returns within the universe of large and small stocks are materially different. Typically, the factors constructed within the universe of small stocks exhibit significantly higher risk and frequently higher premia than the results for the large-stock universe. Measured by market capitalization, the small-cap universe only represents about 10–20% of the entire equity market. Equally weighting the large- and small-cap portfolios essentially increases the impact of the small-cap market segment to 50%, which increases performance of the theoretical portfolio and potentially overstates the achievable factor premia. Nevertheless, since the goal of the article is to replicate smart beta strategies using standard factor tilts, we follow the most commonly accepted definition of the factor portfolios.
The low beta (BAB) factor introduced by Frazzini and Pedersen is constructed very differently. Stocks in the US market are first ranked by their ex ante market beta and then the half of the universe with the lowest beta are allocated to the long side of the factor portfolio and the other half (high-beta stocks) are allocated to the short side. The betas for the stocks are ex ante, meaning they are estimated from historical stock prices with no look-ahead bias. The stocks in each portfolio are then weighted by their beta rank. In order to isolate the premium earned from buying low beta stocks and selling high beta stocks, the BAB factor is constructed to be ex ante beta neutral by levering up the long side of the portfolio and levering down the short side so that the low-beta and high-beta portfolios have the same beta. Unlike the Fama–French factors and the momentum factor, the BAB factor requires leverage.
We use the five-factor model to construct factor-replicated portfolios for the Fundamental Index, equal-weight, and minimum-variance strategies. The weight for each stock in the replicated portfolio is given by multiplying the strategy’s factor loadings by each stock’s weight in the relevant factor portfolio:

Notice that HML, SMB, and WML are long–short dollar-neutral portfolios. Therefore, adding the weights of all stocks for one of these factors will equal to zero. The BAB factor portfolio is beta neutral, however, so adding the weights of all stocks held in the portfolio will give the replicating portfolio the leverage needed to achieve beta neutrality. This equation will produce a leveraged portfolio with weights tilted away from each stock’s market-capitalization weights, where the tilts are dependent on the strategy’s respective factor loadings. For example, a deep-value stock will have a large market-capitalization weight in the HML portfolio ![]() . Multiplying this weight by the positive Fundamental Index HML loading
. Multiplying this weight by the positive Fundamental Index HML loading ![]() and adding this to its weight in the market portfolio
and adding this to its weight in the market portfolio ![]() will give this stock a larger weight in the replicated portfolio by tilting above the market-cap weight for that stock.
will give this stock a larger weight in the replicated portfolio by tilting above the market-cap weight for that stock.
Once we have the weights, we construct the replicated portfolio returns to determine how these portfolios perform compared with the smart beta strategies. Returns for the factor-replicating portfolio are given by the following equation:

where βLow is the beta of the portfolio of low beta stocks (long side), and βHigh is the beta of the portfolio of high beta stocks (short side). Because the BAB factor is constructed to be beta neutral, then

is the leverage required to achieve a beta-neutral long–short portfolio.
If we estimate the factor loadings in sample, it will produce look-ahead bias in the returns of our factor-replicated portfolios. To avoid this, we estimate factor loadings using expanding window regressions. We use the first 10 years of data to estimate factor loadings in constructing the weights for the subsequent month, then the first 10 years plus one month of data are used to estimate loadings to construct the subsequent month weights, and so on.
The factor-replicated portfolios are allowed to have short positions by construction, whereas the smart beta strategies are long only. Thus, we construct an additional long-only factor-replicated portfolio for each smart beta strategy that excludes the short positions. This long-only strategy excludes the short weights in the long–short factor-replicated strategy, then renormalizes the weights (including cash) to sum to 100%.
Using the factor loadings from a specific factor model to tilt away from market capitalization is just one of many ways to construct a factor tilt strategy. Other factors could be selected to construct a factor tilt that replicates a particular smart beta strategy in a way that is better or worse than the method we have used. In fact, a trivial factor tilt that replicates the Fundamental Index exactly is the one that uses the Fundamental Index weight to tilt away from market capitalization.13 This occurs because a stock’s weight in the Fundamental Index is mathematically equivalent to scaling that stock’s market-capitalization weight by a blend of market ratios relative to that stock’s fundamental ratios.14
Defining a factor on an ad hoc portfolio-specific basis makes the portfolios and factor-tilted portfolios tautologically equivalent. Our purpose is to show it is not trivial to replicate a smart beta strategy with a fixed, commonly accepted set of factor definitions; our workhorse of choice in this exercise is the standard Fama–French plus momentum and BAB five-factor models. Building a factor tilt strategy around these five factors is a natural starting point in evaluating how well a naïve factor-tilt strategy can replicate a particular smart beta strategy because of the large body of empirical research that demonstrates these factors explain a sizable portion of excess equity returns.

