
Ample high-quality research has identified three key factors operating in the global macro context—carry, momentum, and value—that can be employed in systematic global investment strategies as a diversifying alternative source of investment returns.
A portfolio of 12 individual strategies using stocks, bonds, currencies, and commodities delivers a package of carry, momentum, and value that generates strong absolute returns at moderate levels of risk and leverage.
Global macro offers the average investor an opportunity—once enjoyed by only the most sophisticated hedge funds—to benefit from alternative sources of return.
A quarter-century before Brexit came “Black Wednesday.” On Wednesday evening, September 16, 1992, the British government announced its exit from the European Exchange Rate Mechanism, prompting a dramatic devaluation of the British pound. Renowned hedge fund manager George Soros’ legendary bet against the pound in 1992 and his $1 billion profit on Black Wednesday defines for many the swashbuckling style of a global macro trader. Global macro has since become a well-established discipline, and for good reason. Handsome returns can be generated from strategies that profit from the predictable relationships between macroeconomics, politics, and monetary policy.
While forecasting market reactions to idiosyncratic macro events may seem a black art or a fool’s errand, our study of capital markets reveals recognizable patterns and the possibility of consistently profitable trading strategies. Ample high-quality research has identified three key factors operating within the global macro context: carry, momentum, and value. Today we may choose from a growing category of strategies that employ these factors to deliver alternative return premiums. These systematic global investment strategies may provide an attractive and diversifying alternative source of investment returns to the low yields and low returns offered by mainstream stocks and bonds.
From Asset Classes to Factors
The investment industry has evolved since the early 1990s, when Soros infamously battled central bankers. Global macro managers still rely on economic and political events to generate the conditions that present attractive trades across the capital markets—equities, fixed income, currencies, and commodities—but in today’s world, the strategies we use to spot attractive investment opportunities have become more systematic. The rise of machines has improved our ability to process information and identify from large datasets the patterns that can turn opportunity into profit.
Systematic strategies employ quantitative models to determine trading decisions. Models are specified upfront and (ideally) change infrequently. Indeed, if managers frequently manipulate their model parameters to generate the trades indicated by their gut, then the process remains qualitative. Beyond relying on objective evidence, systematic approaches isolate trades from the psychological biases, internal politics, and other personal and organizational stresses that too often interfere with executing sound investment strategy.
As a result, an increasing number of funds have migrated from discretionary human pattern recognition to systematic models. These quantitative strategies using modern financial technology may allow investors access to profit from global macro opportunities with much greater transparency and lower cost than the typical global macro hedge fund. At the core of systematic macro strategies lie few, if any, secret ingredients: the strategies invest across markets by relying on signals that measure well-documented return factors.1
Factors exploit patterns in capital markets to generate return premiums from long–short positions, which provide an alternative to the traditional returns offered by long-only positions in stock and bond markets. An exhaustive examination of these patterns and their resulting trading strategies is beyond the scope of this article. We will discuss, however, the most robust and well-understood factors that may produce alternative return premiums: carry, momentum, and value. These factors behave uniformly across assets and can be harvested in a consistent fashion using liquid exchange-traded instruments.
Readers interested in scholarly articles explaining the theory and evidence in support of the carry, momentum, and value factors can find what they seek on Social Science Research Network or Google Scholar.2 We explain here in layman’s terms why each provides consistent profits, and then review our results, verifying and extending earlier research on systematic global macro investing.
The Carry Trade
Carry is the staple of many global macro strategies. The carry trade refers to a long position in a relatively higher-yielding security financed by a short position in a lower-yielding security. The spread between the yields is the carry on the position. Like all profitable investment strategies, carry is not risk free. The returns from the carry trade are, however, too large and consistent relative to traditional stock and bond market return premiums to be fully explained by their risk. Supply and demand imbalances created by structural rigidities likely explain the excess returns of carry trades.
Mrs. Watanabe, the proverbial Japanese housewife, is the world’s most famous carry trader. For decades, she has been astutely exploiting official policy in Japan to boost the returns on her savings as she sells yen to buy higher-yielding securities denominated in foreign currencies. Why is this persistently profitable carry trade available to Mrs. Watanabe?
Mrs. Watanabe understands that interest and exchange rates are not set by a free market for capital assets. The Japanese Ministry of Finance, in cahoots with the Bank of Japan, has for many decades regulated local financial markets to depress the cost of capital to benefit Japan’s exporters by restricting local investment choices for Japanese savers. This intentionally depressed cost of capital has resulted in persistently low and even negative interest rates for local Japanese savers. The policy to manipulate prices to pursue policy goals creates the opportunity for Mrs. Watanabe to sell persistently low-yielding yen to purchase securities denominated in other higher-yielding currencies.3
Trend Following
“Trend following” is the common term for investing using price momentum. Going long securities whose prices have been rising over recent months and going short securities whose prices have been falling has provided consistent profits. This strategy is so popular that an entire investment style called “managed futures” is dedicated to nothing more than straightforward trend following.
The persistent profits from long–short trend following may create a conundrum for believers in efficient markets, but few actual participants in financial markets can fail to notice the reality of price trends. New information immediately moves the price of a security or group of related securities. While the direction of the move may be obvious, the correct magnitude of price change consistent with the news is much less certain. Press attention to both the news and the following price reactions in the market creates feedback that reinforces the initial price moves, thereby creating trends.
Trends may begin with moving the prices of securities toward a changed perception of value resulting from fundamental news, but often persist far beyond any reasonable estimate of fair value. Investors often seem to jump on a trend without much regard for the connection of prices to fundamentals. History is replete with such self-reinforcing trends divorced from valuations: the tulip craze in 1630s Holland, the South Sea Bubble of 1720, railway manias of the mid-1800s, the roaring bull market of the 1920s, Nifty Fifty stocks in the 1960s, Japan’s asset price bubble of the 1980s, and the late 1990s tech bubble, to name just a few. Momentum has proven to be robust across the financial markets, including currencies, commodities, equities, and fixed income.
Value Investing
The trouble with trend following is getting off the train before it changes direction, often after a violent crash. The mirror image of trend following is value investing. The basic tenets of value investing have been known at least since Graham and Dodd wrote Security Analysis in the 1930s. To understand why value investing does not prevent trends from proceeding beyond fair value, but remains a persistently profitable discipline, we need only consider the profound discomfort required to hold the contrarian positions revealed by valuation information.
The recent tale of Michael Burry, the eccentric physician and value investor portrayed by Christian Bale in the movie based on Michael Lewis’ book The Big Short, provides a particularly poignant example. Spotting the housing bubble and mispricing of mortgage-backed securities was not sufficient to correct prices in the US housing market. Michael Burry had to negotiate for the creation of credit default swaps on subprime mortgages, battle disgruntled fund investors demanding the liquidation of his positions and the return of their capital, and generally display conviction and strength of character few of us could match—all while waiting to see if his solvency could outlast the markets’ irrationality. Uncomfortable indeed.
The Evidence
To explore the potential for systematic global macro investing, we empirically investigate the performance of carry, momentum, and value factors across equity, bond, currency, and commodity markets. We have examined many different definitions for the three factors in these markets. Our discussion of empirical results centers on the following factor definitions:
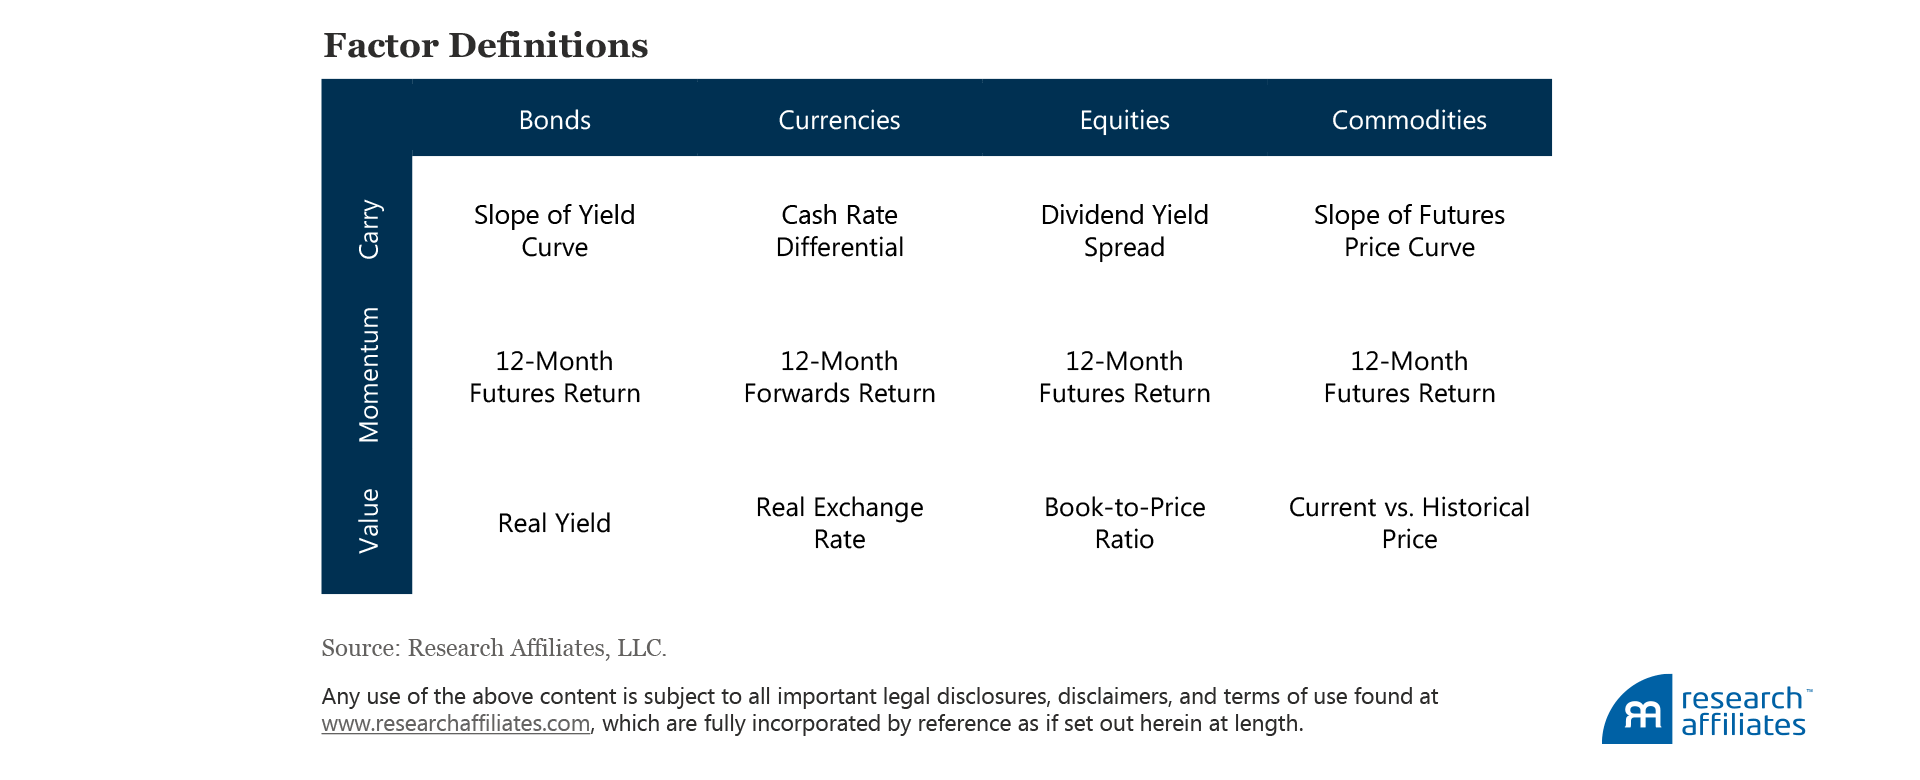
We choose these definitions for their robustness and implementation characteristics, rather than following the tempting practice of cherry-picking the best-performing factors over our sample period from January 1989 to June 2016.4
We begin our analysis in 1989, the earliest date for which all required data are available across all asset classes. Our strategies invest in futures and forward contracts associated with eight developed-market 10-year government bonds, 10 developed-market currencies, 12 developed-market equity indices, and 24 commodities.
The carry and value portfolios use cross-sectional strategies. These portfolios take equally weighted long positions in the top third of derivatives contracts ranked by our signals and equally weighted short positions in the bottom third of contracts. This cross-sectional process hedges out the market exposure. The momentum portfolios use a time-series formation in which each contract is compared with its own history. The strategy goes long contracts with positive momentum and shorts contracts with negative momentum. The time-series process can lead to net long or net short positions at any point in time, although those exposures mostly average out over time.
At 100% gross exposure to each strategy, we compute the excess returns, volatilities, and Sharpe ratios of the three factors:
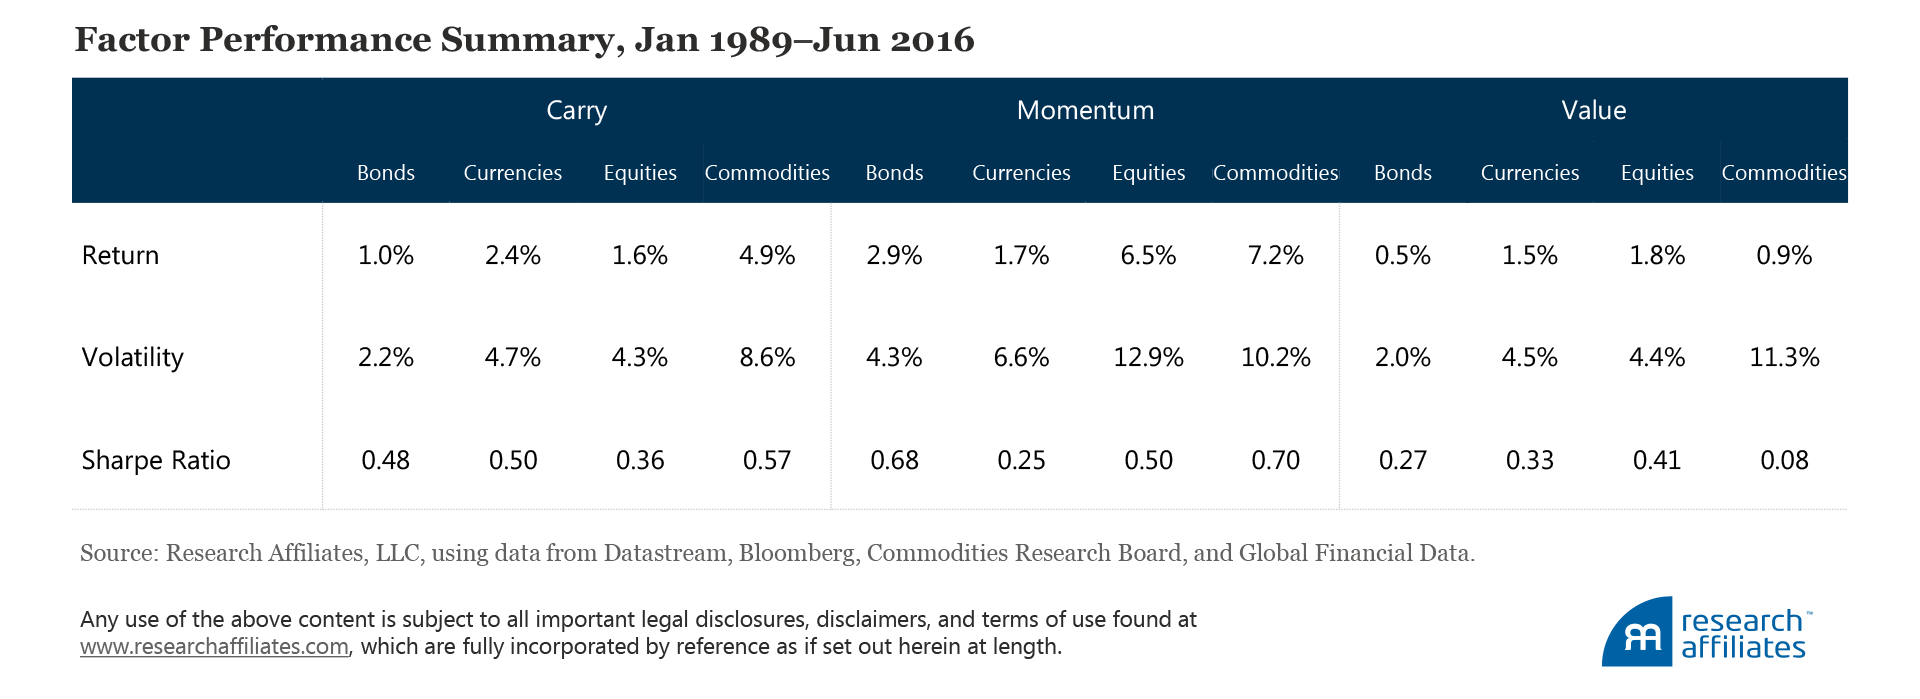
The historical return opportunities have been quite compelling, with Sharpe ratios as high as 0.70 and an average Sharpe ratio of 0.43. For comparison, the S&P 500 Index achieved a 0.41 Sharpe ratio over the same period. The returns themselves (an average of 2.7%) suggest the need for higher degrees of portfolio leverage to reach satisfactory returns, and the volatilities (an average of 6.4%) allow room for judicious use of leverage.
Of course, evaluating these strategies on a stand-alone basis ignores the powerful benefits of diversification. Carry, momentum, and value have naturally low or negative correlation to one another. We believe carry strategies provide a return primarily to compensate for exposure to risk. Investors earn the carry as their return if spot prices do not change, and risk manifests through changing spot prices.5 Momentum and value, in contrast, aim to take advantage of those changes in spot prices—momentum over the short run, and value over longer horizons. Thus, these three strategies complement each other well, and value in particular helps insulate carry portfolios against crash risk.
The average pairwise correlation of 0.03, as shown in the following correlation matrix, confirms the strong diversification potential of combining these three strategies:
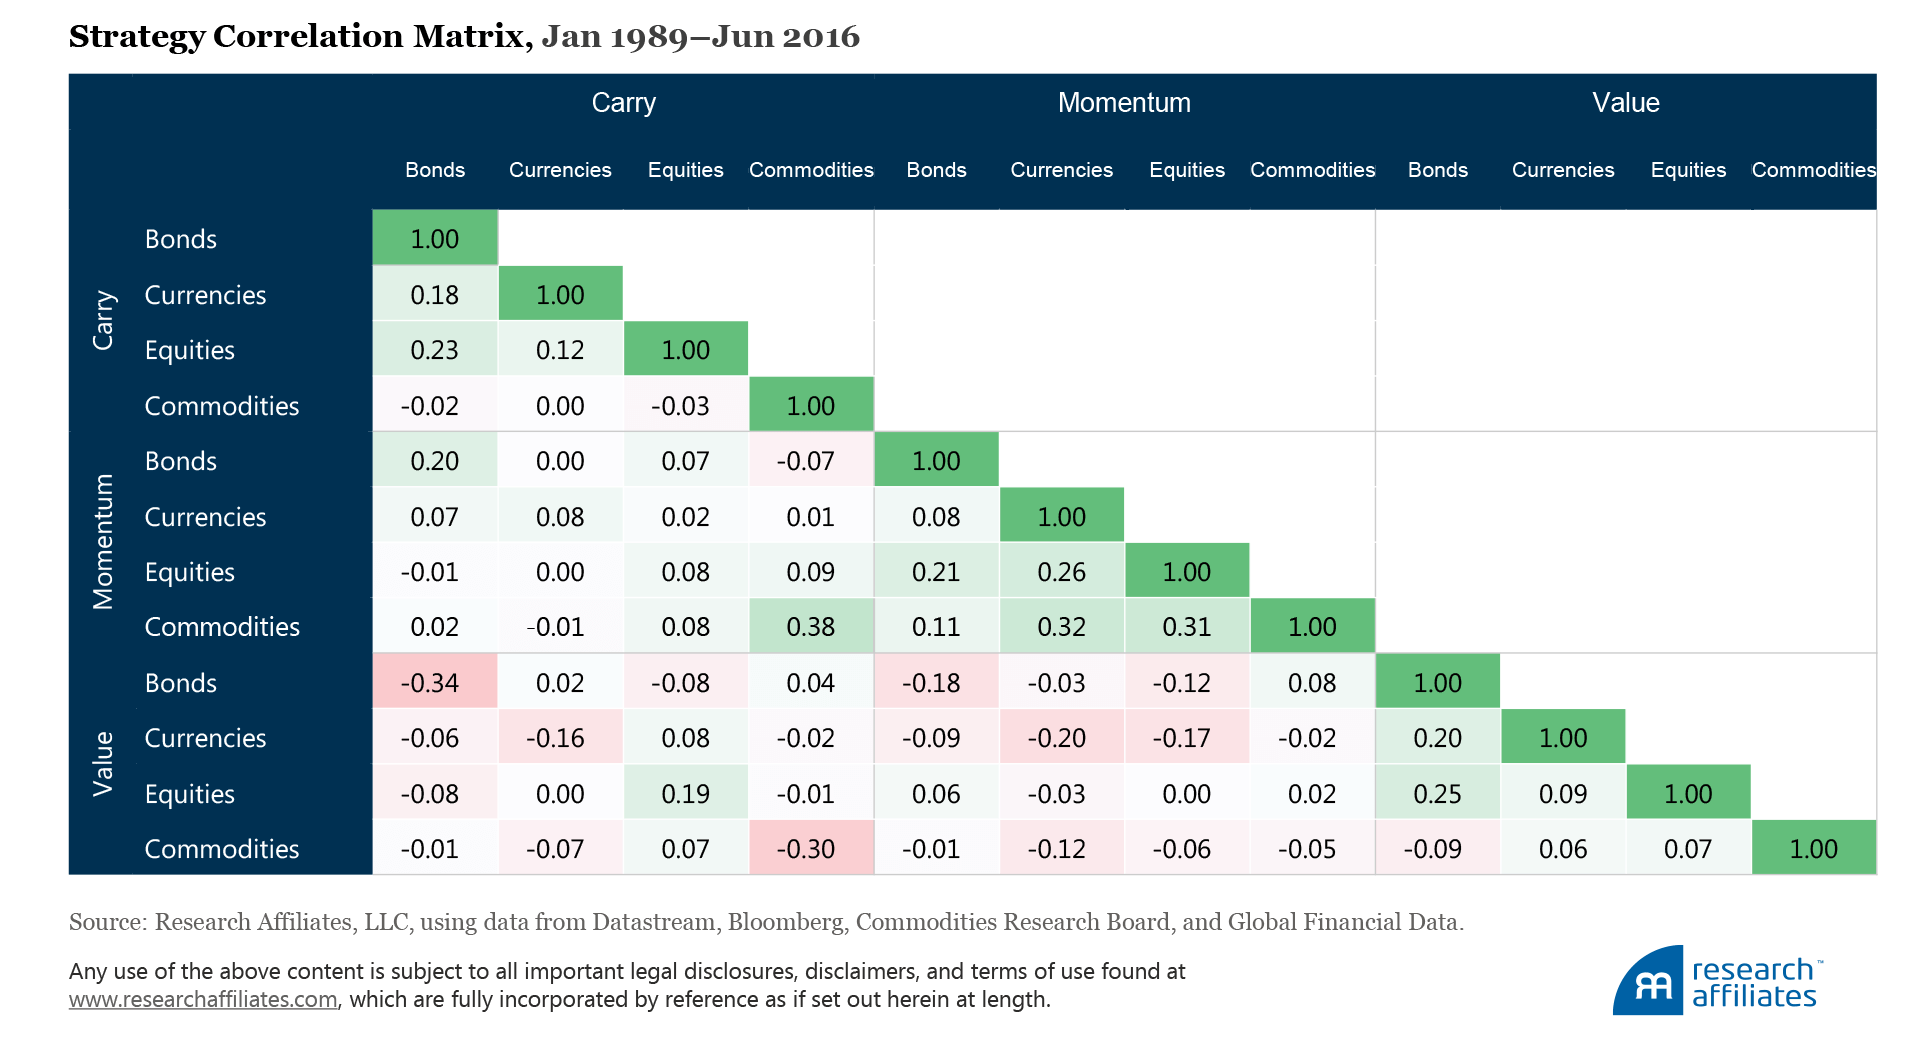
We see pockets of significant correlation. For example, the momentum portfolios exhibit positive correlation across asset classes, suggesting that strategies focused on momentum alone (a path followed by many managed futures funds) forgo the opportunity to significantly improve results through allocating to complementary strategies. Value, especially, provides strong diversification, exhibiting negative correlation to momentum and carry within asset classes, while momentum and carry are positively correlated within asset classes. The importance of even marginal return strategies, such as value in commodities, is clear; although the Sharpe ratio for the stand-alone strategy is not significantly different from zero, the powerful diversification properties it brings to the portfolio greatly reduce drawdowns and improve the risk–return trade-off for a combined commodities portfolio.
Putting the 12 individual strategies together in a single portfolio6 delivers a package of carry, momentum, and value that provides the potential for strong absolute returns at moderate levels of risk and leverage. The historical annual excess return over the 25½-year period of our analysis averages 14.7% at 10.1% volatility, an impressive 1.5 Sharpe ratio—double even the best Sharpe ratio of the individual strategies.7
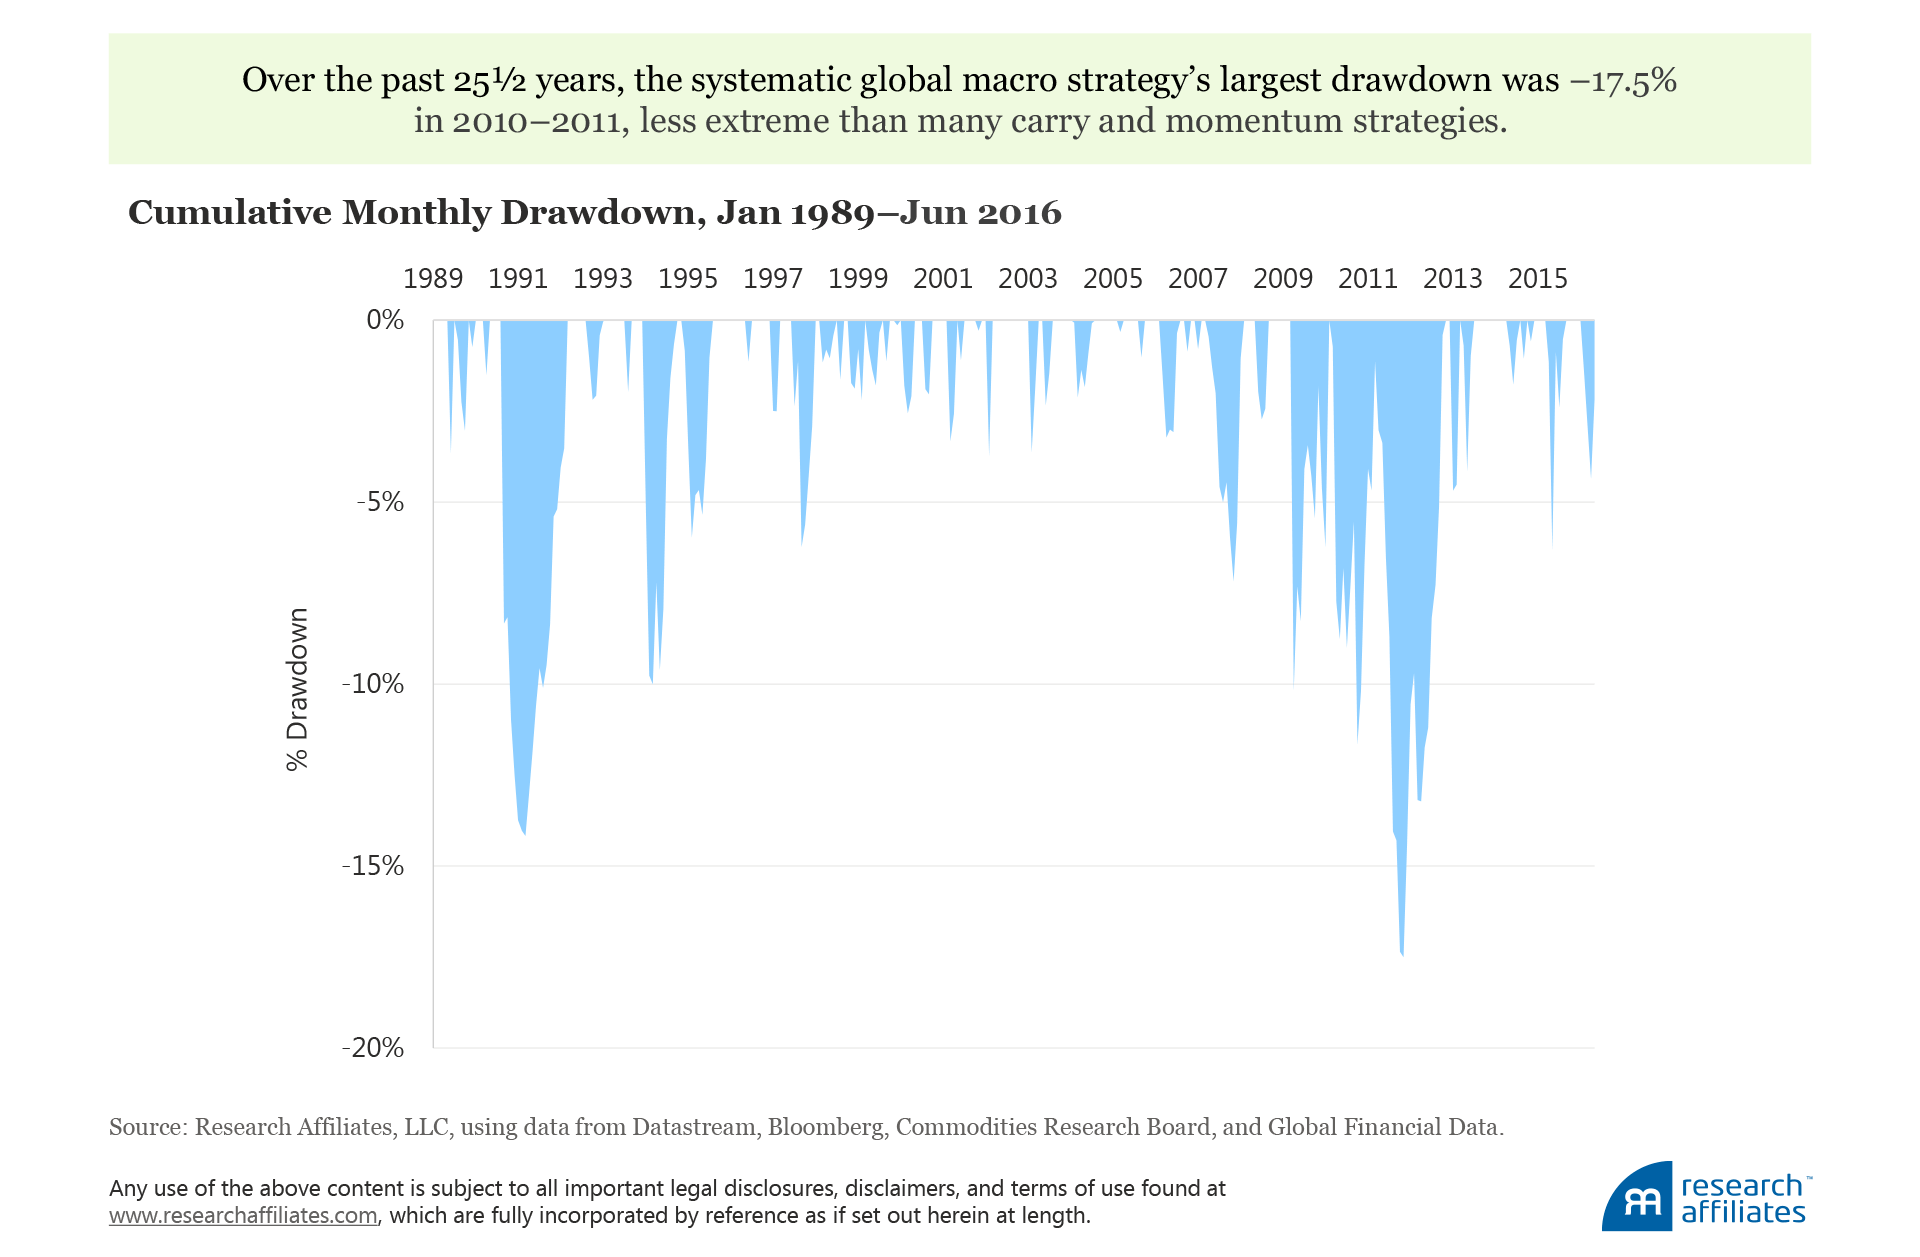
Additionally, these impressive Sharpe ratios come with low risk when measured by other means than standard deviation of returns. In the last 25½ years, the portfolio was not subject to the extreme crash risk faced by many carry and momentum strategies. The portfolio’s largest drawdown occurred in 2010–2011, peaking at −17.5%, and fully recovering within 12 months. In fact, the portfolio exhibits positive skew, rather than the negative skew associated with crash risk.
Neither does the portfolio require dangerously high use of leverage. We examine the gross leverage in the portfolio, adding together the total long exposure across all strategies to the absolute value of total short exposure. Since January 1989, the degree of portfolio leverage required peaked at 479% and averaged 357%. Given the high liquidity of the derivatives contracts and offsetting asset class positions in the portfolio, this degree of leverage is associated with very conservative levels of posted collateral (estimated at less than 20%), and greatly reduces the potential danger of forced selling during times of stress due to insufficient collateral.
Not only do these combined systematic global macro absolute returns show excellent stand-alone characteristics, they are also very useful diversifiers in portfolios. Because of their hedged construction, the carry, momentum, and value factors have very little correlation with most exposures to asset classes and traditional risk factors. The long-only benchmark indices—the S&P 500, Barclays Aggregate, long USD index, and Bloomberg Commodities index—all show near-zero correlation to the systematic global macro (SGM) portfolio.
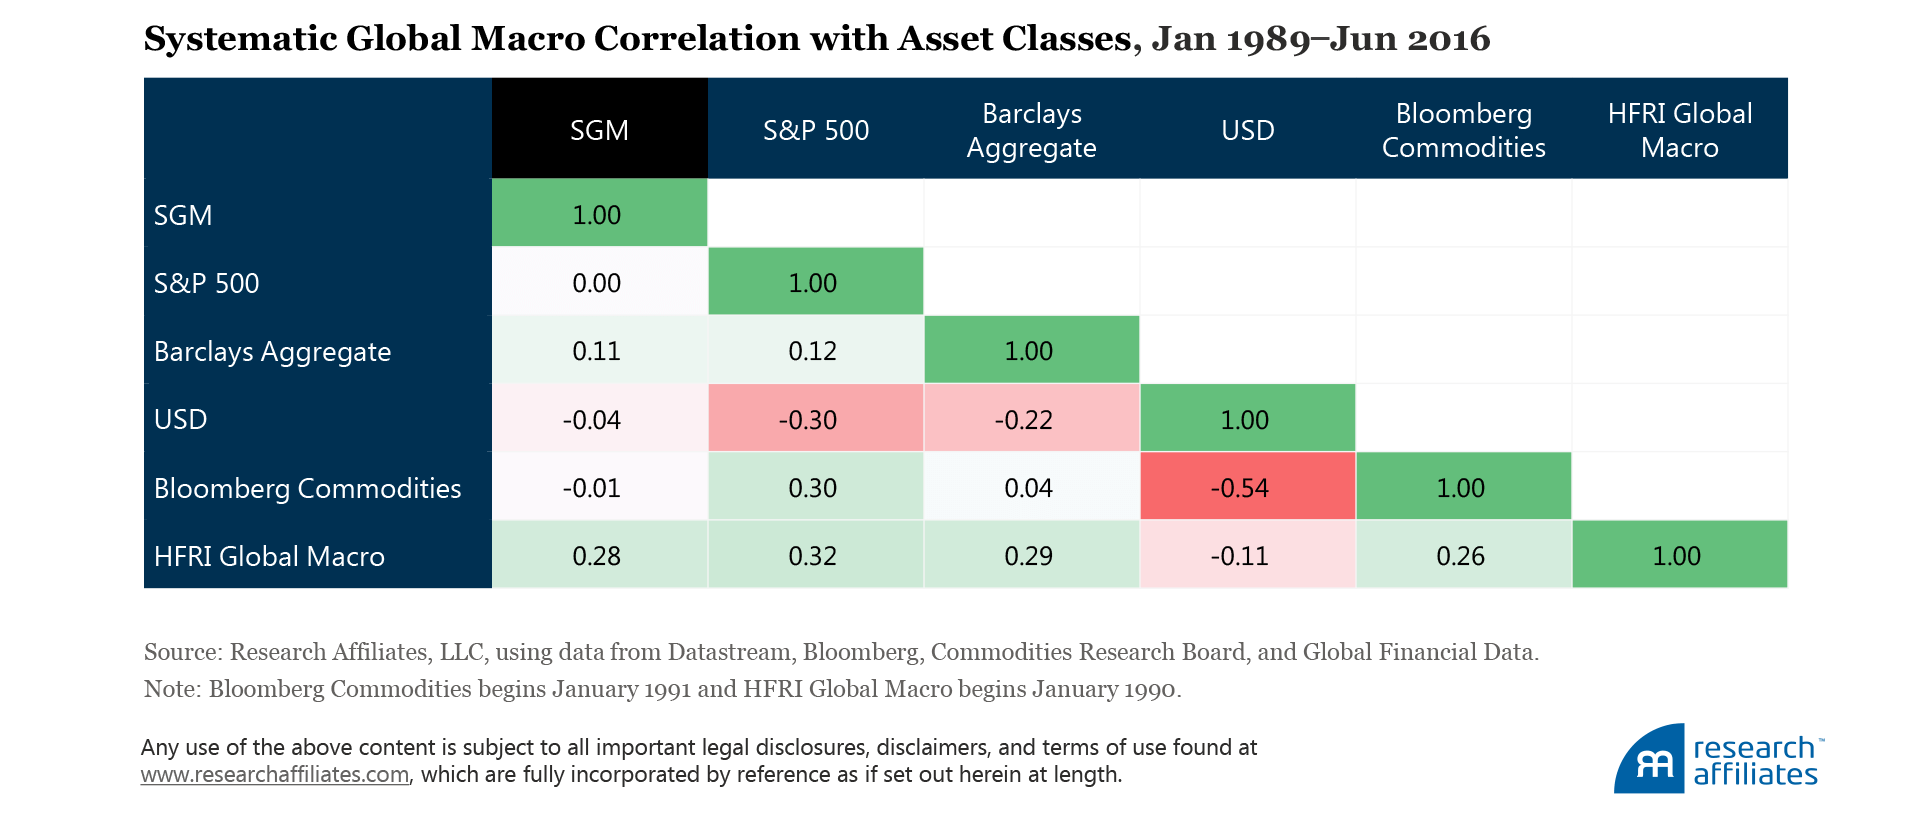
Even the HFRI Global Macro index, a collection of self-reported global macro hedge funds, shows a relatively low 0.28 correlation to the systematic global macro portfolio. The carry, momentum, and value exposures appear to provide the potential for truly diversifying return streams that cannot be easily captured through traditional means.
Even a relatively small exposure to the uncorrelated returns can dramatically impact a portfolio. We compare the return and higher-moment characteristics for the traditional 60% S&P 500/40% Barclays Aggregate portfolio to portfolios that allocate 10%, 20%, or 30% to the systematic global macro strategy:
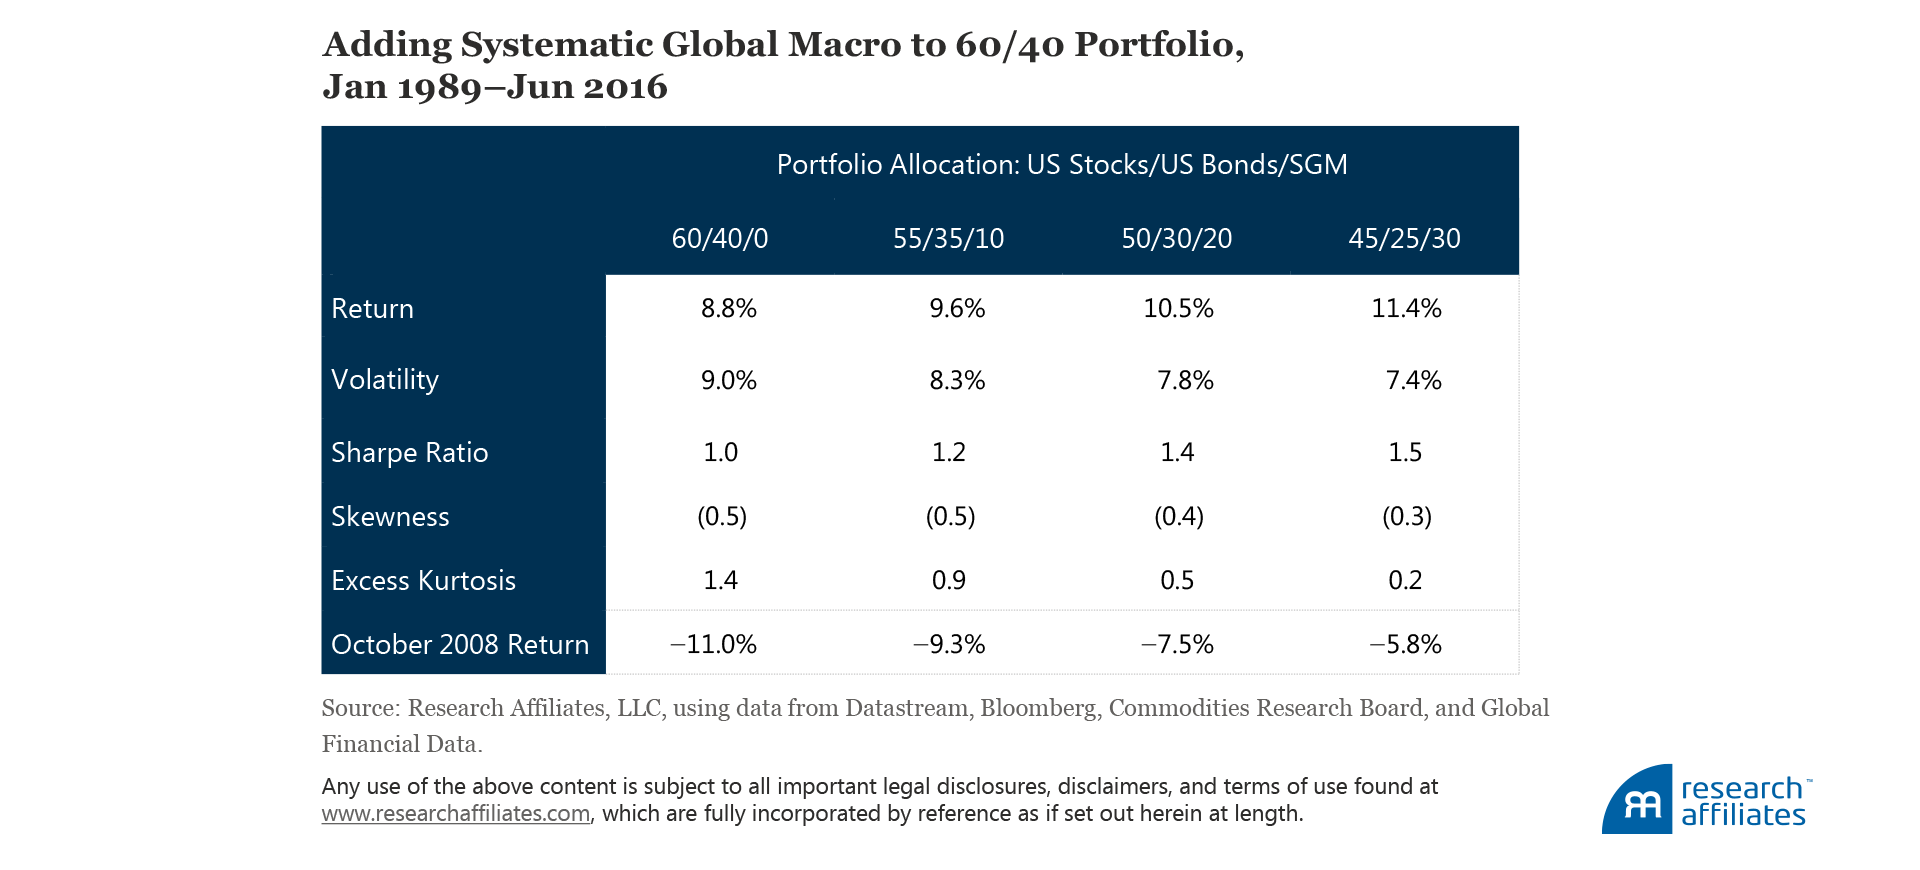
Placing 10% of the portfolio in the systematic global macro strategy would have improved the Sharpe ratio from 1.0 to 1.2. Moving to a sizable 30% allocation would have improved the total portfolio Sharpe ratio to 1.5, identical to the historical global macro Sharpe ratio. The advantage comes from both higher return and lower volatility—exactly what the “free lunch” of diversification promises.
Importantly, tail risk—measured by negative skewness and excess kurtosis, statistical representations of the “fat tail” events equity investors know experientially—also trends toward zero with larger allocations to the global macro portfolio. Standard allocations to bonds have traditionally helped to lower crash risk, but incorporating the systematic global macro strategy would have gone even further; for example, when the S&P 500 was down 16.8% in October 2008, a 60/40 portfolio would have reduced total portfolio loss to 11.0%, but a portfolio holding 30% in systematic global macro would have experienced only a 5.8% loss in that month. Uncorrelated returns can indeed offer strong protection in turbulent times.
Future Expectations
While these historical results appear quite impressive, we should be cautious when applying them to expectations of future performance. Backtested returns are rife with caveats for good reason. We have been judicious to avoid errors that would lead to magnified upward biases between historical returns and future results.8 Even so, common sense dictates a sensible reduction for forward-looking returns. Harvey and Liu (2015) discuss a general rule to haircut backtested Sharpe ratios by 50%, and recommend that weaker Sharpe ratios receive more aggressive haircuts and higher Sharpe ratios be cut by less, in order to form realistic forward-looking expectations. Factors impacting real-world returns include transaction costs, signal banding to reduce turnover, applying a fund management fee, and adjusting for tail winds provided by secular decline in global interest rates. Taking these factors into account also argues for a significantly lower forward-looking Sharpe ratio.
Fortunately, given the exceedingly strong historical data, this systematic global macro strategy remains quite compelling even with aggressive discounting of expected returns. Run at a 10% volatility, a 0.8 Sharpe ratio generates excess returns of 8% annualized—far above our expectations for any traditional asset class or risk premia. And given the excellent diversification provided by the uncorrelated returns, this combination of carry, momentum, and value premia could be one of the most compelling investment opportunities available in today’s markets.
Conclusion
A fair-minded consideration of today’s markets shows muted potential from investing in traditional assets. Low yields, high valuations, and anemic global growth have pushed down expected returns. Given these starting conditions, the likelihood of achieving anything close to a 5% real return seems quite slim,9 creating a considerable need for alternative solutions. We see the alternative factor premia of carry, momentum, and value as powerful additions to suitable investors’ portfolios. These systematic global investment strategies provide an attractive and diversifying alternative source of investment returns. They are empirically robust, theoretically sound, and we believe positioned to continue to drive strong absolute returns in today’s macro environment. As we stated earlier, global macro has become a well-established discipline for good reason, offering the average investor an opportunity—once enjoyed by only the most sophisticated hedge funds—to benefit from these alternative sources of return.
More information on Systematic Alternative Risk Premia.

Endnotes
- Much research has documented the carry, momentum, and value factors in individual asset classes as well as across the global landscape. The fact that these strategies are robust, and that their returns have persisted even after discovery, gives us confidence they should continue to provide positive return premiums going forward. The literature also documents theoretically sound bases for their persistence, including risk-based premia, behavioral biases, and persistent institutional frictions.
- Asness, Moskowitz, and Pedersen (2013) provides an overview.
- Low or negative interest rates are typically associated with appreciating currencies. These currencies on average, however, do not appreciate by enough to offset their yield disadvantage, thus creating the forward premium puzzle reviewed by Fama (1984). This premium appears to be time varying, and recent research such as by Lustig Roussanov, and Verdelhan (2014) ties the returns to sources of macroeconomic risk.
- Examining multiple definitions of each factor leads us to conclude these factors are robust drivers of returns. By selecting factors based on implementation characteristics rather than historical returns, we believe these definitions should mitigate (although not eliminate) the backtesting bias discussed by Harvey, Liu, and Zhu (2016) and McLean and Pontiff (forthcoming), as well as result in portfolios with greater liquidity and lower trading costs, leading to higher net returns flowing through to investors.
- A sizable body of literature discusses the risks associated with carry strategies and the failure of spot prices to converge, such as the failure of uncovered interest rate parity in currency markets beginning with Fama (1984) and Hodrick (1987); the failure of the expectations hypothesis in bond markets (Fama and Bliss, 1987); and the persistence of contango and backwardation in commodity markets, as far back as Keynes (1930).
- Many possible methods exist to formulate a combined portfolio. Overly complex methods are not necessary to achieve impressive results; here we simply weight each strategy by the inverse of its inception-to-date volatility.
- These returns are excess (without collateral) and do not include expenses or fees. Readers could reasonably deduct 1% for management fees (via a systematic implementation rather than expensive hedge fund) and another 1% for conservatively estimated transaction costs.
- For example, we use our analysis of multiple signals to help establish robustness rather than search for “optimal” results. We do not simply select the highest Sharpe ratios from those signals, but rather select based upon low costs of implementation and consistency. We also focus on signals that hold up well to commonsense rules such as turnover banding.
- West and Masturzo (2016) encourage readers to take the 5% challenge!
References
Asness, Clifford S., Tobias J. Moskowitz, and Lasse H. Pedersen. 2013. “Value and Momentum Everywhere.” Journal of Finance, vol. 68, no. 3 (June):929–985.
Fama, Eugene F. 1984. “Forward and Spot Exchange Rates.” Journal of Monetary Economics, vol. 14, no. 3 (November):319–338.
Fama, Eugene F., and Robert R. Bliss. 1987. “The Information in Long-Maturity Forward Rates.” American Economic Review, vol. 77, no. 4 (September):680–692.
Graham, Benjamin, and David L. Dodd. 1934. Security Analysis. New York, NY: The McGraw-Hill Companies, Inc.
Harvey, Campbell R., and Yan Liu. 2015. “Backtesting.” Journal of Portfolio Management, vol. 42, no. 1 (Fall):13–28.
Harvey, Campbell R., Yan Liu, and Heqing Zhu. 2016. “… and the Cross-Section of Expected Stock Returns.” Review of Financial Studies, vol. 29, no. 1 (January):5–68.
Hodrick, Robert J. 1987. The Empirical Evidence on the Efficiency of Forward and Futures Foreign Exchange Markets. New York, NY: Harwood Academic Publishers.
Keynes, John M. 1930. A Treatise on Money: The Pure Theory of Money.
Lustig, Hanno, Nikolai Roussanov, and Adrien Verdelhan. 2014. “Countercyclical Currency Risk Premia.” Journal of Financial Economics, vol. 111, no. 3 (March):527–553.
McLean, David R., and Jeffrey Pontiff. “Does Academic Research Destroy Stock Return Predictability?” Journal of Finance, forthcoming.
West, John, and Jim Masturzo. 2016. “Take the 5% Challenge! (or The 'Lloyd Christmas' Lesson).” Research Affiliates (October).
