
Portfolios dominated by mainstream asset classes have a very low probability of earning a 5% annualized real return over the next decade, but most investors are blithely overlooking this reality.
A comparison of the most popular investing strategies used to build retirement nest eggs suggests the chances of any producing a 5% annualized real return for investors over the next decade is quite slim. Portfolio alpha and/or alternatives allocations are unlikely to change this conclusion.
Now’s the time to get real. Now’s the time, in a world of paltry bond yields and meager dividends, to make an honest assessment of your portfolio’s long-term expected return. We encourage you to take the 5% Challenge by visiting our website where you can create a portfolio using our interactive portfolio builder to replicate your current allocation or a contemplated allocation. What are the odds your portfolio will earn an annualized real return of 5% over the next decade?
A Lesson from Lloyd
In a fast-paced life, John and his wife often enjoy some mindless entertainment downtime. No suspense. No sophisticated plot. No worldly foreign-language subtitles. Just…mindless. And it would be hard to get much more mindless than the Farrelly brothers whose signature movie Dumb and Dumber always seems to be on cable during the downtime hour. In this 1994 comedy, two nitwits—Lloyd Christmas and Harry Dunne, played by Jim Carrey and Jeff Daniels, respectively—follow beautiful Mary Swanson (Lauren Holly) to Aspen after limo-driver Lloyd falls in love with her on an airport drop-off.
After the requisite road trip hi-jinks, Lloyd finally catches up to Mary in Colorado and gets the nerve to ask her his chances. The conversation goes like this:
Lloyd Christmas (Jim Carrey): What do you think the chances are of a guy like you and a girl like me…ending up together?
Mary Swanson (Lauren Holly): Not good.
Lloyd: You mean, not good like one out of a hundred?
Mary: I’d say more like one out of a million.
Lloyd: So you’re telling me there’s a chance.1
Now that’s truly looking at life through rose-colored glasses!
We have to say we see a lot of similarities between Lloyd’s unfounded optimism and that of many investors in believing their mainstream portfolios will hit their targeted long-term return—for many, a real 5%. As Mary Swanson clearly told Lloyd, chances of reaching that return are “not good.” Instead of taking action, most investors ignore this seemingly straightforward conclusion. Like Lloyd Christmas, they don’t care if the probability of failure is high. A miniscule chance is good enough. Worse yet, many investors attempt to close the gap by making alpha bets, exposing their portfolios to the return-eroding performance chasing that so often goes hand-in-hand in such a pursuit.
What Are Your Odds of Dating Mary?
In 2014, we began publishing our 10-year expected risk and return forecasts for a broad spectrum of equities, bonds, commodities, currencies, and REITs. Our objective was to provide investors our best thinking on long-term return forecasts. A year later we released a portfolio builder, available on our website, that allows investors to build and compare the 10-year expected risk and return of customizable, diversified portfolios.
In an industry dominated by promises of higher return, investors need to ask higher than what? The question we should be asking about our long-term portfolio management goals is not simply what return are we likely to earn over the next decade, but is the return likely to cover our spending needs when the decade comes to an end. What are our odds of eclipsing the hurdle rate necessary to accomplish our goals, or in Lloyd-speak, what are the odds of getting a date with Mary?
To uncover the hurdle rate most investors are banking on to meet their financial needs in retirement, we surveyed the default returns embedded in 11 retirement calculators, robo-advisors, and institutional investor surveys built on hundreds of underlying participants.2 The average and median annualized long-term expected returns were 6.2% and 6.0%, respectively. We can translate these nominal forecasts into real, or after-inflation, returns by subtracting a market forecast of inflation; we use the yield difference between 10-year US Treasuries and 10-year US TIPS, better known as breakeven inflation (BEI). The appendix to this article discusses real and nominal returns.
As of September 30, 2016, 10-year BEI was 1.6%. Reducing the nominal 10-year average and median returns of 6.2% and 6.0%, respectively, by 1.6%, we find the real average and median targeted returns from our retirement survey to be 4.6% and 4.4%, respectively. Rounding up, we arrive at 5.0%. If investors are counting on earning a 5% real return, what are the odds they will be able to do it?
Before we apply our expected return forecasts to test the reality of this hurdle, allow us a quick caveat. Perfect foresight eludes us. But we do know a good forecast includes a component that attempts to model unexpected return. To capture the variability in our expected return over the next 10 years, we create a forecast based not on a single point estimate, but on a full distribution of possible future outcomes. The expected return is simply the mean of that distribution. Where a 5% real return lands on this distribution allows us to derive the odds of achieving, or improving on, this level of return.
The classic 60/40 portfolio. Let’s start with perhaps the most comfortable portfolio to own, the good ole 60/40 blend of US stocks and bonds. It’s had a remarkable run. The Vanguard Balanced Index Fund, which aims to replicate a 60% US stock index and 40% US bond index, has delivered a 10-year return as of September 30, 2016, that places it in the top decile of balanced mutual funds. But from today’s vantage point with US bond yields exceptionally low and equity P/E ratios (determined using the Shiller P/E multiple) in the top decile of a 100-year history, future returns are likely to be extremely muted.3 How muted? We estimate the ubiquitous 60/40 US portfolio has a 0% probability of achieving a 5% or greater annualized real return over the next decade. Yep, you heard us correctly. Zero. Well, that’s not entirely accurate. If we extend to another decimal, the rounded 0% becomes 0.2%. So you’re saying there’s a chance!
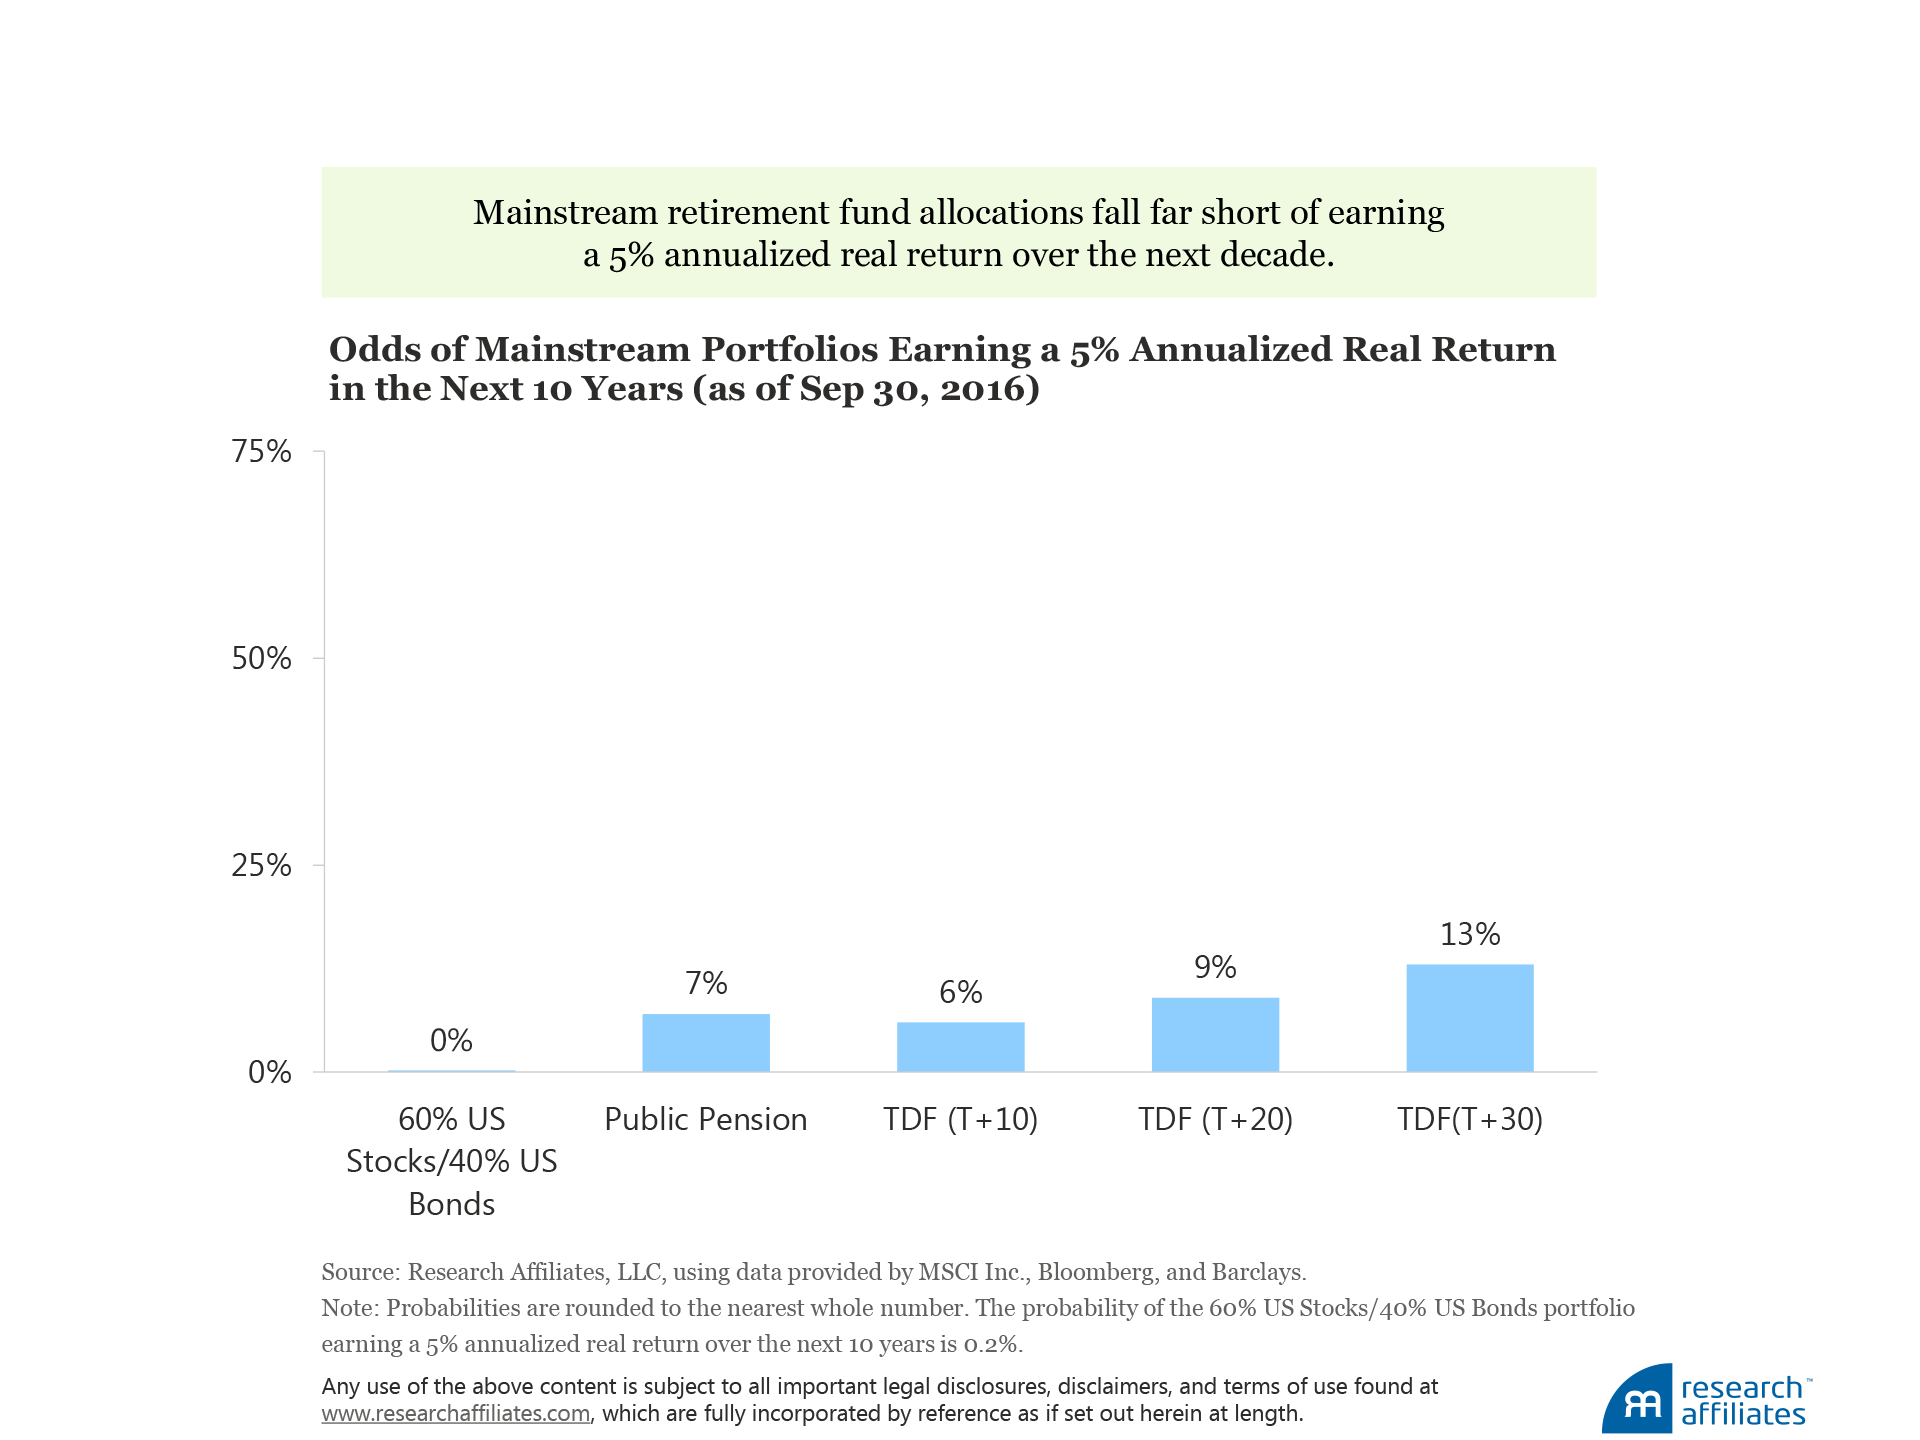
A more diversified portfolio. Perhaps the odds are better with a more diversified mix. After all, hardly anyone today is invested 100% in US mainstream assets. Even though diversification has been on life support in the last few years, it still has a pulse with investors holding some subdued nonmainstream allocations. A typical public pension plan with 24% in non-US assets and a small dash, 6%, of diversifying strategies has only a 7% chance of achieving a 5% real return over the next 10 years.4 With $3.6 trillion in total US pension plan assets (ICI, 2016), that’s an awful lot riding on single-digit odds.
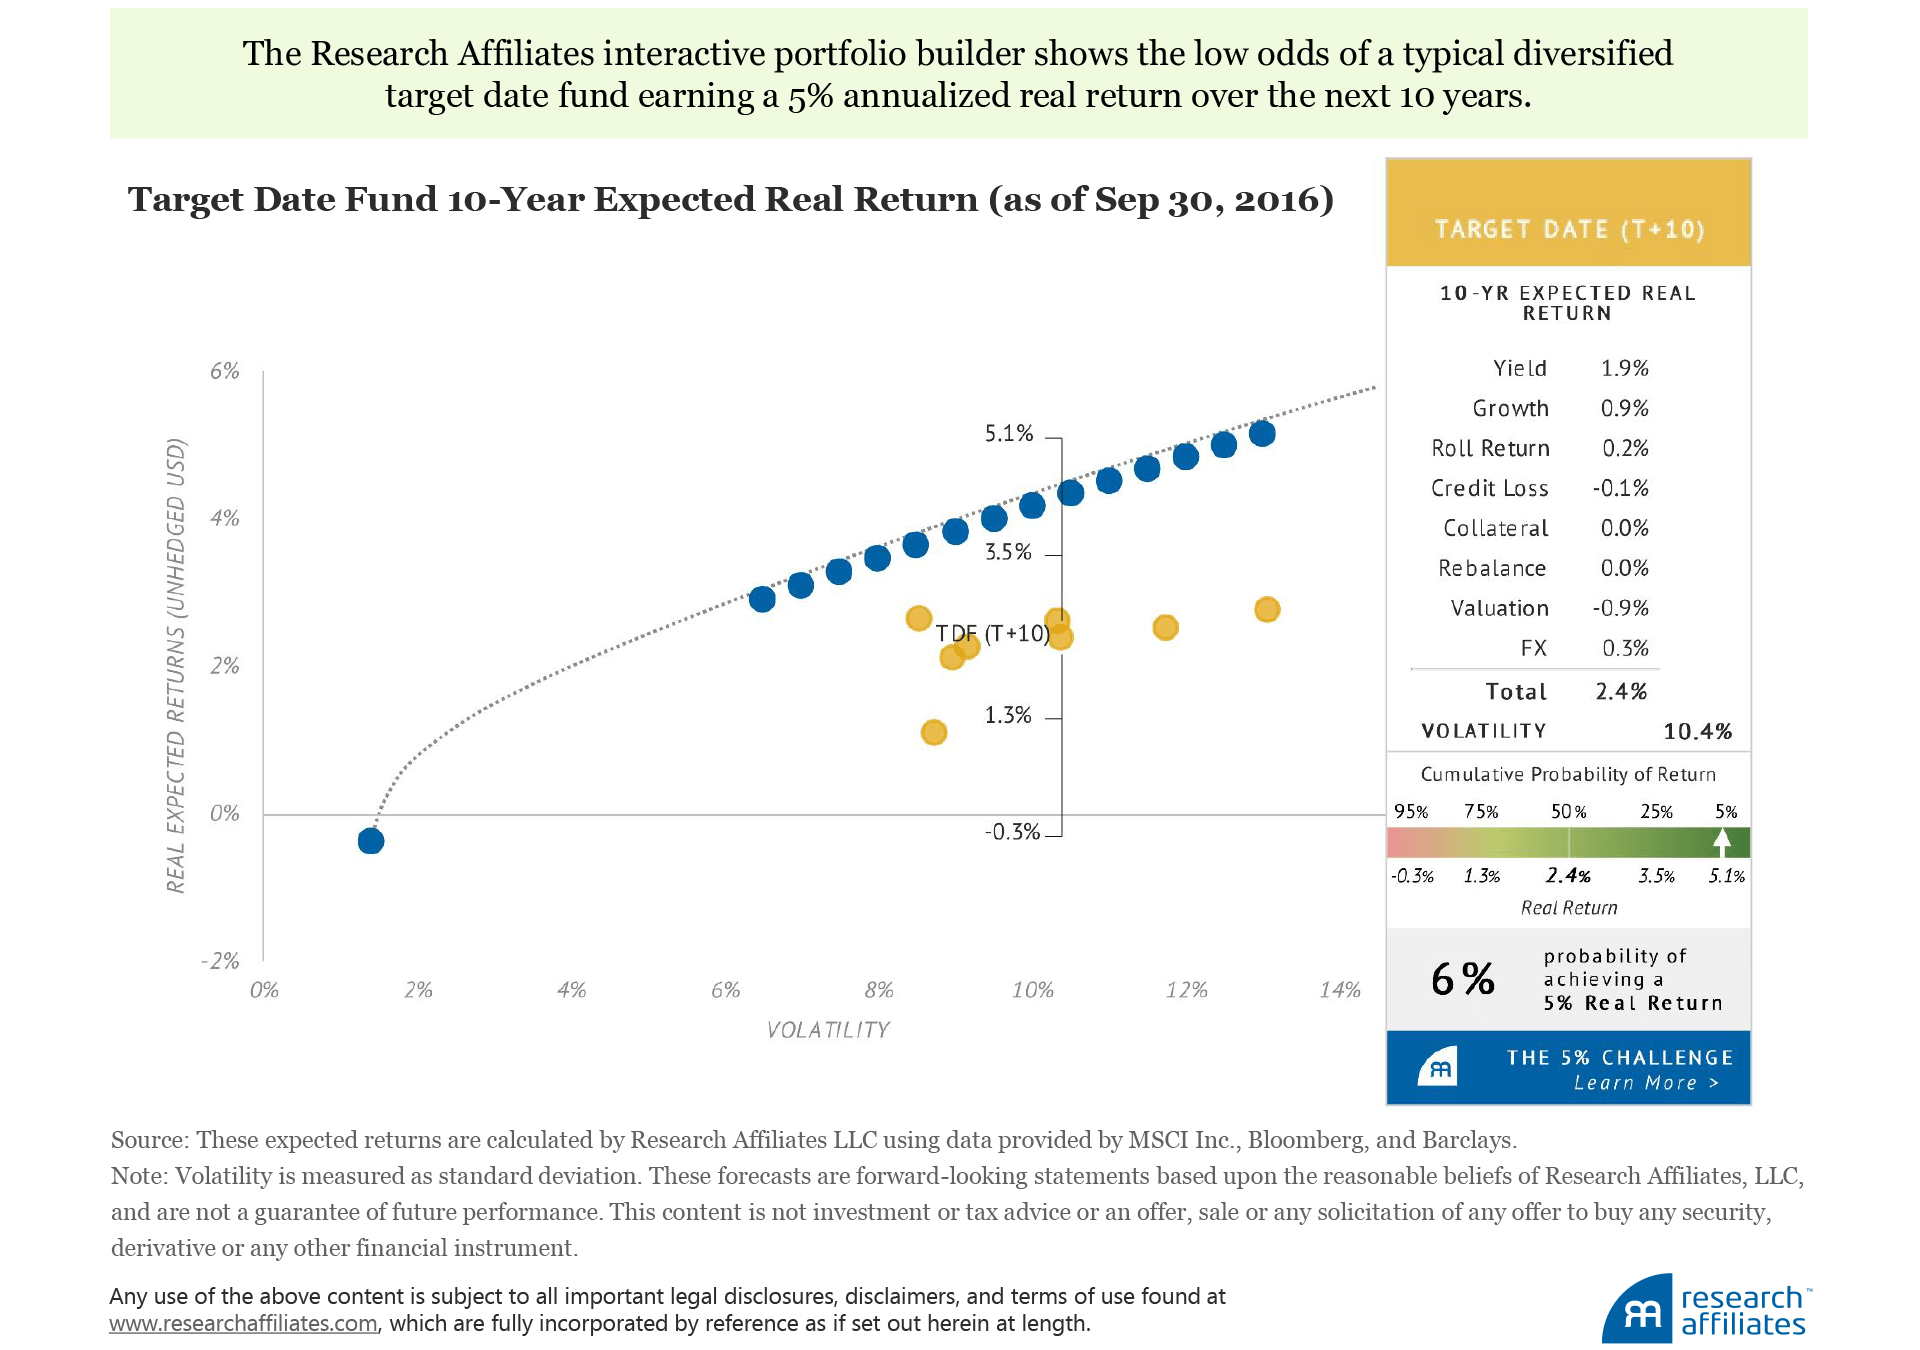
Target date fund. Increasingly, the go-to default option for the $6.7 trillion defined contribution market (as of yearend 2015)—the vast majority being 401(k) plans—faces similarly abysmal odds. A TDF+10 corresponds to an investor’s retirement horizon being 10 years from the current date. Today, this TDF-horizon glide path achieves a real return of 5% in only 6% of our range of returns. The figure on the next page is from our website and shows the very low probability of a target date fund achieving the 5% hurdle. So close to retirement, perhaps the strategy isn’t designed to make such an aggressive hurdle rate. Fine. But what about funds with longer target-date horizons? Not much better odds for them either. The TDF+20 and TDF+30 have 9% and 13% probabilities, respectively, of making a 5% annualized real return based on their glide paths over the next 10 years. According to Morningstar, as of August 31, 2016, including both active and passive target-date funds with horizons from 10 (target date 2025) to 30 (target date 2045) years, nearly $539 billion in assets is exposed to this expectations gap. Not good.
Odds Aren’t Looking Good…
Such dismal probabilities are sure to be met with skepticism by the “yeah, but…” crowd. But before we address some of their expected critiques, allow us to observe that these estimates may be, in fact, too optimistic. Each mix assumes 100% passive cap-weighted implementation with no management fees or trading costs.5 Granted, cap-weighted implementation tends to be (but is not always) fairly efficient on these fronts. To be conservative, clients may wish to lower their ranges by 10–30 basis points (bps) depending on their implementation choices.
The average portfolios we discuss in the previous section are not precise replicas of each category average. They differ in two primary ways, each worthy of discussion to better understand the influence the differences have on the rather daunting probabilities of reaching a 5% real return by the end of the next decade.
First, our assumptions are for cap-weighted market proxies, which means they include no excess returns from skilled active management. Active management, while under siege, still dominates the implementation of nearly every asset class. Might diligent fund selection bridge the gap between expected and targeted returns? Not likely.
We tack onto the cap-weighted market proxies the top quartile net-of-fee alpha over the last 10 years for each sleeve of the representative mixes used in typical retirement plans such as public pension funds and TDFs. The returns creep up by 60–90 bps. This more-positive result assumes investors can find skilled managers in the first place, and then hold on to them for the entire 10 years—which, as West and Ko (2014) and Hsu and Viswanathan (2015) explain, may prove quite difficult. Only under the most heroic, and in our opinion, completely implausible, assumptions can manager alpha make a meaningfully sufficient dent to profoundly change the conclusion.
Not unsurprisingly, we have high hopes for smart beta being able to close a portion—but not all—of the gap through lower management fees, lower trading costs, and reduced governance requirements. But we are hopeful only if, and it’s a big if, the smart beta program is employed to minimize performance chasing, or better yet, is executed in a disciplined, contrarian manner as discussed by Arnott, Beck, and Kalesnik (2016).
Second, the Research Affiliates 10-year forecasts do not (yet) cover illiquid or alternative strategies, such as hedge funds, private equity, and real estate. Recent studies conducted by Milliman (Wadia et al., 2016) and the National Association of State Retirement Administrators show that as of fiscal yearends 2015 and 2014, respectively, between 20% and 23% of private and public pension plans were invested in the alternatives categories, leaving 77–80% in the baseline liquid asset classes we model.6
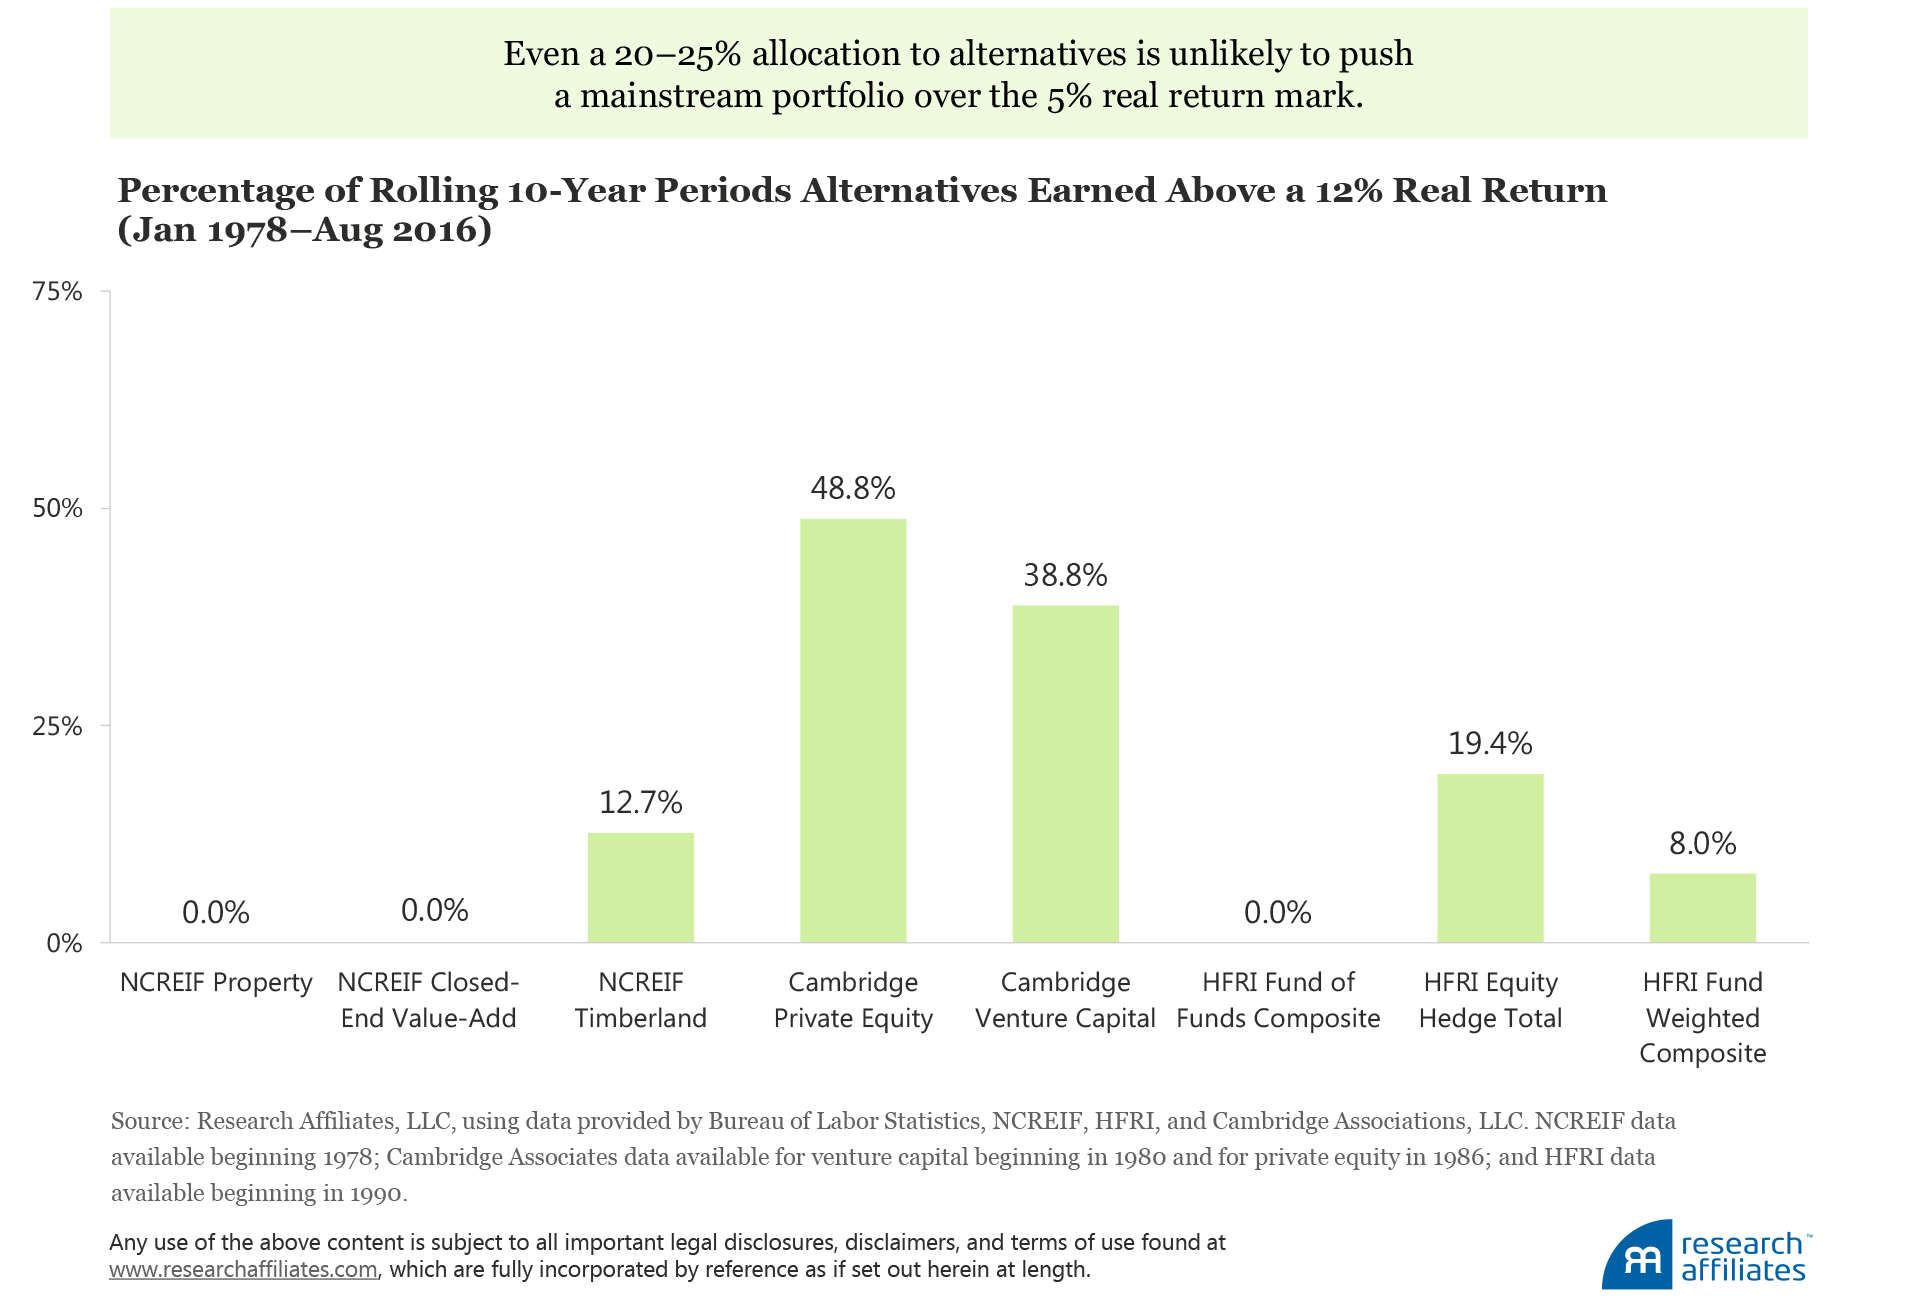
If the vast majority of the portfolio is expected to produce a 2.5% real return, then the pie slice of alternatives has to earn closer to a 12.0% real return after all fees and expenses in order for the entirety of the plan to generate a 5% real return.
A look at eight well-known alternatives benchmarks—the NCREIF Property, Closed-End Value-Add, and Timberland indices; the Cambridge Private Equity and Venture Capital indices; and the Hedge Fund Research Index (HFRI) Fund of Funds Composite, Equity Hedge Total, and Fund Weighted Composite indices—shows that three (two real estate indices and the fund-of-funds composite) never earned a real return of 12% or higher over a 10-year period within the last three decades, and none hit that mark more frequently than in half of the 10-year periods.
Today, given the current starting cocktail of low-cap rates and high public-equity valuations in the United States and the substantial capital flowing into these markets, we are hard pressed to imagine an outcome in which a 20–24% alternatives allocation could push a portfolio over the 5% real hurdle. Although we’re certainly skeptical of the gap-closing potential of alpha and alternatives for most investors, a select handful will skillfully and/or luckily help them over the 5% hurdle rate. But planning on most investors netting such results seems a foolish assumption.
Improve Your Odds of “Dating Mary”
Like Lloyd’s chances with Mary, investors in traditional asset mixes face extraordinarily long odds of meeting targeted returns. Of course, individual results may vary. Not everyone who owns the Vanguard Balanced Index Fund is a pure 60/40 investor; they likely own other asset classes. Not every public pension fund invests in the underlying portfolio we model. The target date mixes are a rough approximation of dozens of bundled providers’ glide paths.
But these caveats shouldn’t stop us from asking ourselves about the odds of our own portfolio mix achieving a 5% annualized real return over the next decade.
With the Research Affiliates portfolio builder, you as advisor, consultant, individual investor, or institutional asset owner can find an answer to this question with an approximate 60-second investment of time. We also outline several alternative mixes forecast to dramatically improve your odds, especially if you are able to embrace substantial “maverick risk” as discussed by Brightman (2016). And with a further 60-second time commitment you can create your profile and save your portfolio(s) for later reference.
Our portfolios aren’t really baskets of asset classes and underlying securities. They are bundles of future financial hopes and dreams, some grandiose and some basic. Even Harry and Lloyd were saving to open a specialty worm-farm store called “I Got Worms.” Everyone is saving for something. And we in the investment management industry owe—and our beneficiaries should demand—a reasonable assessment of whether that something, be it a secure retirement or a worm store, is likely to be attained. A one-in-a-million chance may be good enough for Lloyd Christmas, but trillions of retirement assets deserve better. We encourage you to check out your portfolio’s odds and take the 5% Challenge at Asset Allocation Interactive.

Appendix: Real and Nominal Returns
We prefer to discuss the expected investment return after inflation, or the real return, because this is the return that affects an investor’s future spending potential. Although real and nominal (before netting out the impact of inflation) returns are simply two sides of the same coin, a focus on the nominal return can often be misleading. For example, an investment expected to earn a 50% nominal return this year sounds like a great deal unless the investor lives in Venezuela where inflation is expected to be in the triple digits, possibly as high as 500%. That glorious 50% investment return results in the investor having less buying power at the end of the year than at the start of the year.
A properly constructed hurdle rate includes the return needed to pay for future purchases at today’s prices plus the expected change in the prices of those goods. For example, if the need is simply to pay off the balance of a fixed-rate mortgage, the expected change in the value of the liability is zero. The hurdle rate is simply the return capable of paying all remaining monthly payments.
If, however, the future spending need is to purchase a vacation home with an ocean view, the expected change in the value of that real estate from today until the purchase is made should be accounted for. The general inflation rate is usually not a sufficient measure. Real estate values in highly sought after neighborhoods with ocean views usually rise much faster than the general inflation rate.
Nominal Investment Return
> Return to Meet Current Liability Value
+ Liability Inflation Rate
Real Investment Return
> Return to Meet Current Liability Value
+ ( Liability Inflation Rate
- General Inflation Rate )
Endnotes
- Farrelly and Farrelly (1994).
- The embedded hurdle rates identified in these studies range from a nominal 5% to 8% with pensions and endowments having among the highest return assumptions of 7% to 8%. Milliman surveyed the largest 100 corporate pension funds, NASRA surveyed 126 public funds, and NACUBO-Commonfund surveyed 812 endowments. For the retirement calculators, expected returns are either the assumed rate (typically stated in the disclosures) or the default rate (e.g., if the site provides a range, we use the middle of the range, and if the site provides three options, similar to the Kiplinger site of 6%, 8%, and 10%, we use 8%).
- The cyclically adjusted price-to-earnings ratio, also known as CAPE or Shiller P/E, popularized by Yale professor Robert Shiller, is the cornerstone of our equity valuation work. The Shiller P/E arose from the observation that one-year earnings are 1) highly volatile, 2) affected by short-run considerations, and 3) likely mean reverting. Shiller states that the idea of the CAPE ratio was conceived many decades before he adopted it. As long ago as 1934 in the textbook Security Analysis, Benjamin Graham and David Dodd wrote that for the purpose of examining such ratios, one should use an average of earnings of “not less than five years” and preferably “seven or ten years” (Shiller, 1996).
- We are “singling out” public pension plans because of the greater availability of data on their holdings that we can use to create an “average mix.” Similarly allocated corporate pension funds would face long odds of the same proportion.
- The indices we model for our expected returns may well differ from others’ preferred cap-weighted proxies. For example, the index we rely on for commodities exposure, the Bloomberg Commodity Index, uses liquidity and production data to determine weights between various commodity types. Small differences between traditional index construction methods are worthy of exploration, but do not explain much more than a few basis points of return difference.
- The Milliman study reports 20.5% allocated to “Other” and the NASRA survey finds a 6% allocation to real estate and a 17% allocation to alternatives.
References
Arnott, Robert D., Noah Beck, and Vitali Kalesnik. 2016. “Timing ‘Smart Beta’ Strategies? Of Course! Buy Low, Sell High!” Research Affiliates (September).
Brightman, Chris. 2016. “Negative Rates Are Dangerous to Your Wealth.” Research Affiliates (April).
Farrelly, Peter, and Bobby Farrelly. 1994. Dumb and Dumber. New Line Cinema (December 16).
Hsu, Jason, and Vivek Viswanathan. 2015. “Woe Betide the Value Investor.” Research Affiliates(February).
Investment Company Institute. 2016. 2016 Investment Company Fact Book, 56th ed.
McDonald, Michael, and Kate Smith. 2016. “Harvard Looks to Columbia’s Investing Chief for Turnaround Touch.” Bloomberg (September 29).
National Association of College and University Business Officers and The Common Fund. 2016. 2015 NACUBO-Commonfund Study of Endowments (NCSE). NACUBO and The Common Fund.
National Association of State Retirement Administrators (NASRA). 2016. “The Public Fund Survey.” NASRA (March).
Shiller, Robert J. 1996. “Price–Earnings Ratios as Forecasts of Returns: The Stock Market Outlook in 1996.” Robert J. Shiller’s website (July 21).
Wadia, Zorast, John W. Ehrhardt, Alan H. Perry, and Charles J. Clark. 2016. “Milliman 2016 Pension Funding Study.” Milliman, Inc. (April).
West, John, and Amie Ko. 2014. “Hiring Good Managers Is Hard? Ha! Try Keeping Them.” Research Affiliates (November).
