
Revisiting Tesla’s Addition to the S&P 500: What’s the Cost, Before and After?
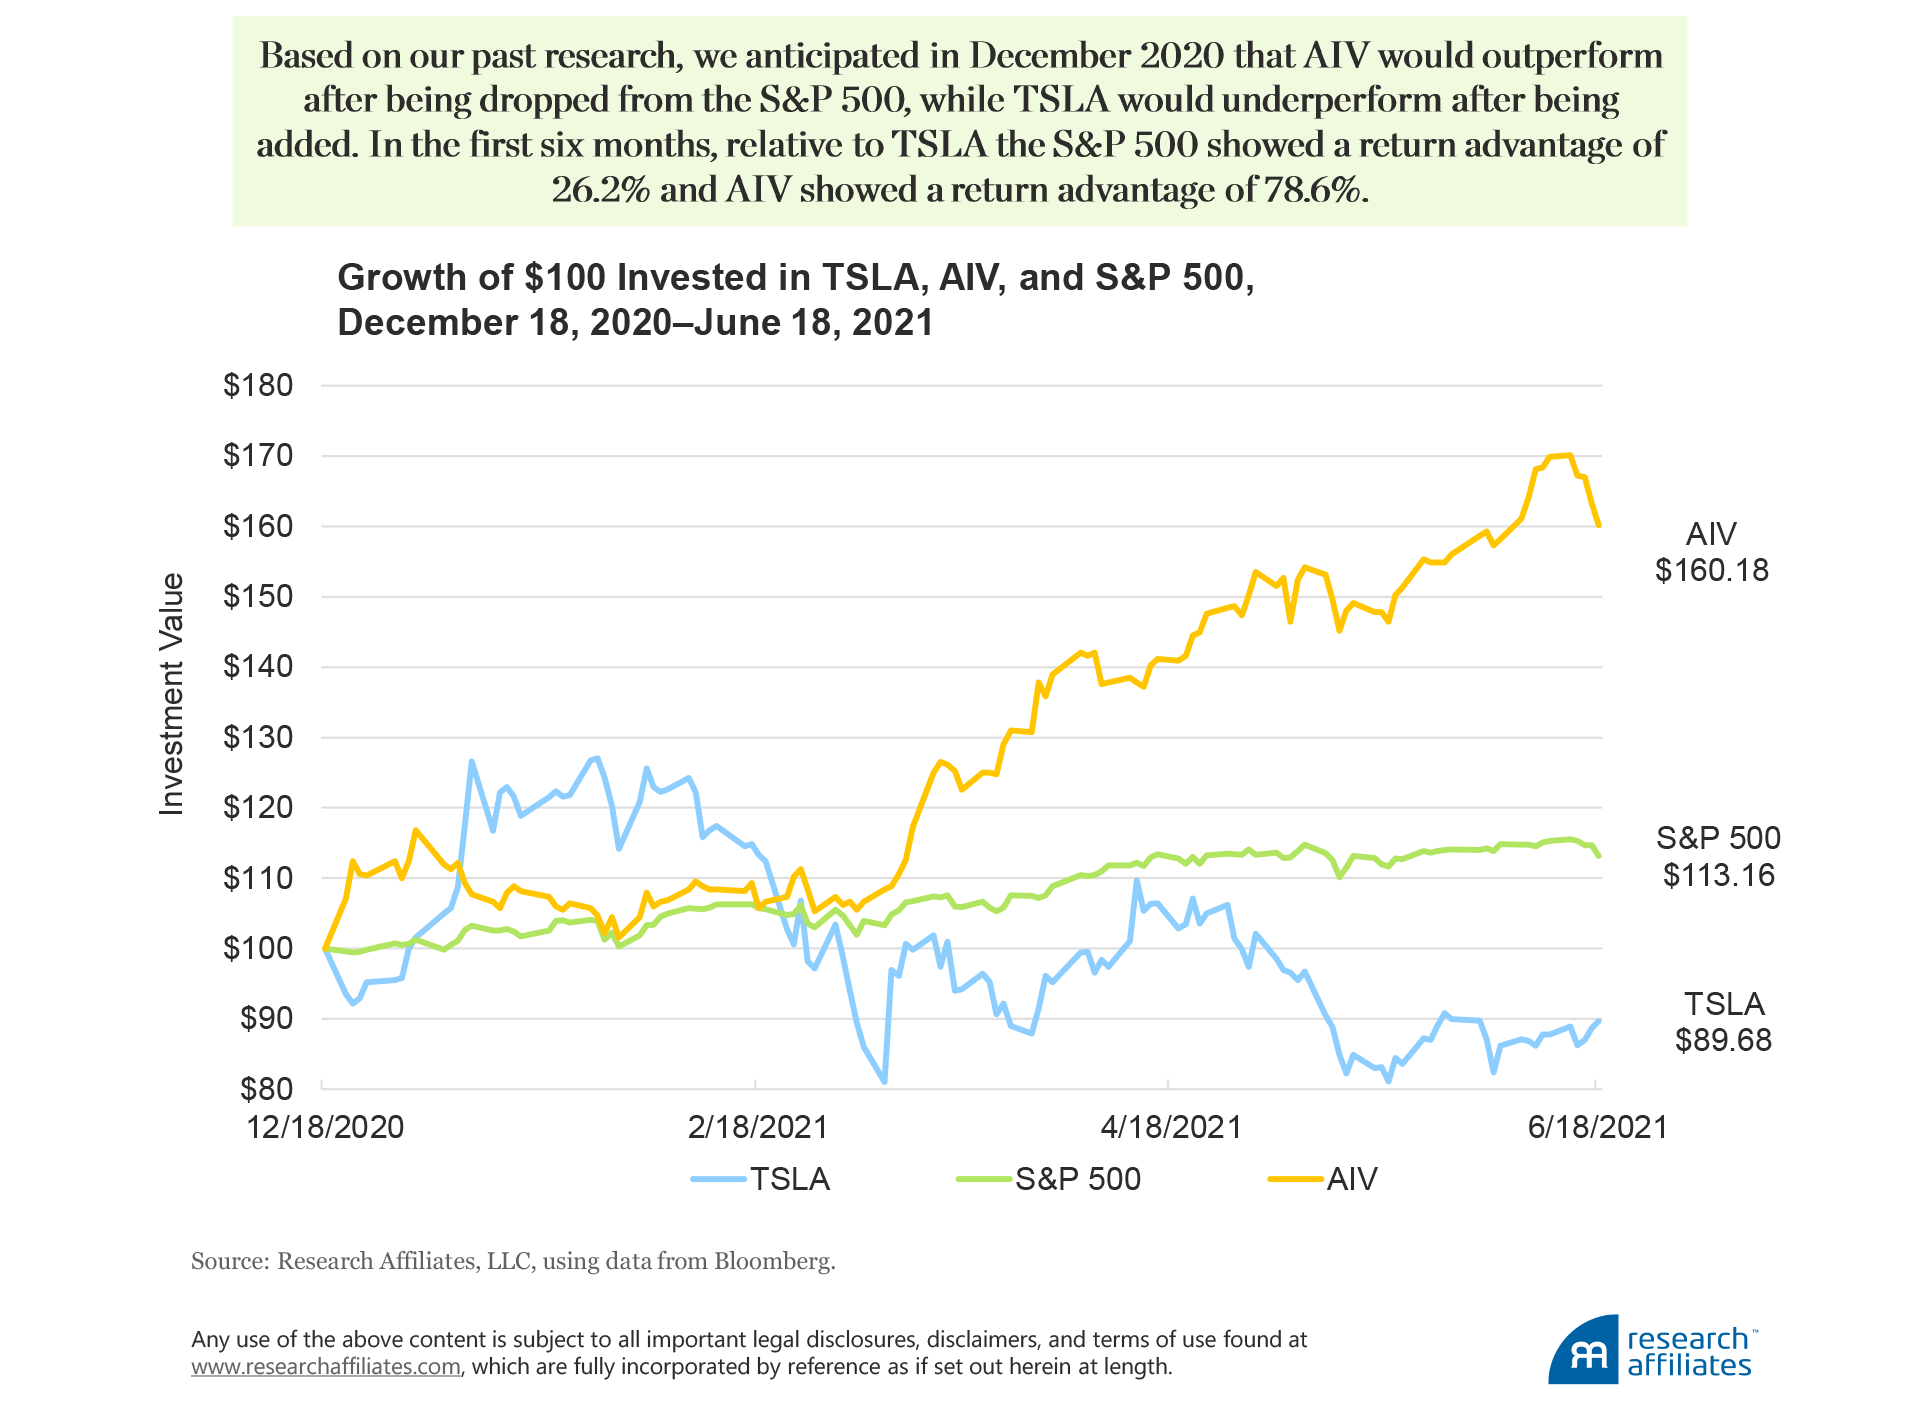
We have observed that additions and deletions to the S&P 500 Index follow a dependable pattern: additions underperform and deletions overperform over the subsequent 12-month period. The December 2020 rebalance out of AIV and into TSLA lived up to this pattern rather spectacularly—at the six-month mark, AIV has a relative return advantage over TSLA of 78%!
Traditional cap-weighted indices routinely buy high and sell low when the index rebalances resulting in substantial hidden costs to investors who track the index. The December 2020 S&P 500 rebalance out of AIV and into TSLA cost investors 41 bps in the first six months, and the cost may go higher. Smarter index design and more-efficient implementation could help investors’ tracking traditional indices avoid these hidden costs.
We and others have often observed a pattern in additions and deletions to the S&P 500 Index: typically additions underperform and deletions outperform the index in the subsequent year. The larger the addition to the S&P 500, the larger the average gap in subsequent relative performance. It has happened yet again with the addition of Tesla (TSLA) and the deletion of Apartment Investment and Management (AIV). In early December 2020, in our article “Tesla, the Largest-Cap Stock Ever to Enter S&P 500: A Buy Signal or a Bubble?,” we made the additional point that Tesla already sported bubble-level valuations, priced at more than 120 times when compared to the traditional automakers on a per car basis. Historically, companies at bubble valuations significantly underperform the market… eventually.1 Taking these two observations together, we predicted that AIV would outperform TSLA, perhaps by a stupendous margin because of Tesla’s scale and valuation levels.
Tesla entered the S&P 500 on December 21, 2020. Six months after the fact, what has happened? AIV outperformed TSLA by a stupendous margin.
Index Fund Rebalancing: Buy High, Sell Low
Index funds are often thought to be passive. Not entirely—stocks are added and dropped, and rebalancing trades are made as company float changes. Although turnover is low, that turnover follows a consistent pattern: index funds systematically buy high and sell low. The recent addition of Tesla to the S&P 500 near its highest-yet valuation levels is a striking confirmation of this pattern. As the following chart vividly shows, our expectation of underperformance by TSLA and outperformance by AIV, as we stated six months ago, was right on target. As of the close on June 18, 2021, AIV has delivered 60 cents on a dollar invested compared to TSLA’s loss of 10 cents on a dollar invested, a relative return advantage for AIV of 78.6%.2
How much did the S&P 500 rebalance into TSLA cost investors? If a hypothetical investor did not rebalance into TSLA and held the S&P 500 at the pre-rebalance allocation, the investor would have been 41 basis points (bps) ahead of the rebalanced S&P 500 in the first six months after the rebalance, and likely that return advantage is not the end of the story.3 A pensioner with a $100,000 allocation to the S&P 500 is about $410 poorer as the result of the December 21 index rebalance. Unfortunately, this cost is totally unnoticed by investors because it is baked into the index’s performance. Ironically, the competition in the indexing space runs for these fractions of basis points. The cheapest funds offer the index’s portfolio allocation for an expense ratio of zero (!) bps.4 Yet, many investors totally ignore the hidden costs associated with indexing, which can easily exceed the expense ratio!
Traditional indices embody built-in performance-dragging inefficiencies. Cap-weighted indices allocate capital proportional to a company’s capitalization. For example, the S&P 500 holds approximately 500 of the largest US companies by market capitalization (corporate actions cause drift above and below 500 names) and weights them in proportion to their float-adjusted market values. It is self-evident that if a company’s stock is overpriced relative to long-term future fundamentals (hence destined to eventually underperform), it will be overweighted in the index relative to its eventual fair-value weighting. Conversely, an undervalued stock (destined to outperform) will be underweighted in the index. This observation is not a criticism of the people or the products at S&P. It is simply inherent to price- or capitalization-weighting.
Indexers cheerfully admit this truism, while noting that no one can know which companies are over- or undervalued (although recent examples of valuation extremes, such as GameStop and Nikola, certainly bring the whole notion of market efficiency into question, yet again). But, knowing which stocks are cheap and which are dear turns out to be irrelevant.
On average, company valuation multiples mean revert toward market and sector norms. In an efficient market, this reversion to the mean happens as fundamentals catch up with price: expensive and cheap stocks sport exactly the premium or discount, respectively, that they deserve. In an inefficient market, at least some of this mean reversion happens through the opposite dynamic as price reverts toward fundamentals. This higgledy-piggledy tendency toward mean reversion produces a return drag on a capitalization-weighted portfolio relative to any strategy that does not link weight to price or to market capitalization (Treynor, 2005).5
The buy-high, sell-low dynamic is particularly evident when we analyze the additions and deletions to the S&P 500. On average, over the last 20 years, 23 stocks have left and 23 have entered the index each year. About 58% of the deletions result from a corporate action such as a merger, acquisition, or bankruptcy, leaving the Index Committee little choice but to delete them. The stocks that then entered the index typically had recently experienced significant price appreciation relative to the rest of the market, ranking on average in the top 330 names by market capitalization. If corporate actions do not trigger a deletion, the Index Committee will choose a discretionary deletion, typically removing smaller companies that have recently fallen in price. We might oversimplify by suggesting that additions are typically stocks the committee wishes it had included sooner, and deletions are stocks the committee is embarrassed not to have dropped sooner.
For the six months after the December 2020 S&P 500 rebalance, AIV’s relative return advantage versus Tesla is 78.6%.
”Our 2018 article “Buy High and Sell Low with Index Funds!” suggests several ways index funds could add a modest excess return in most years. The industry, however, has trained clients to view any tracking error relative to the published index (including positive tracking error!) as evidence of inferior, sloppy risk management. Index fund managers who seek to take advantage of these inefficiencies lose business because their positive tracking error is taken to be evidence of sloppiness. The saving grace for indexers is that the stocks added at too high a price and sold at too low a price represent only about 2–4% of annual turnover. Even with an avoidable 1,000 bp performance drag from the buy-high, sell-low behavior, the annual cost to clients is roughly 20–40 bps, which the clients typically do not notice because the published index itself suffers from the same drag!
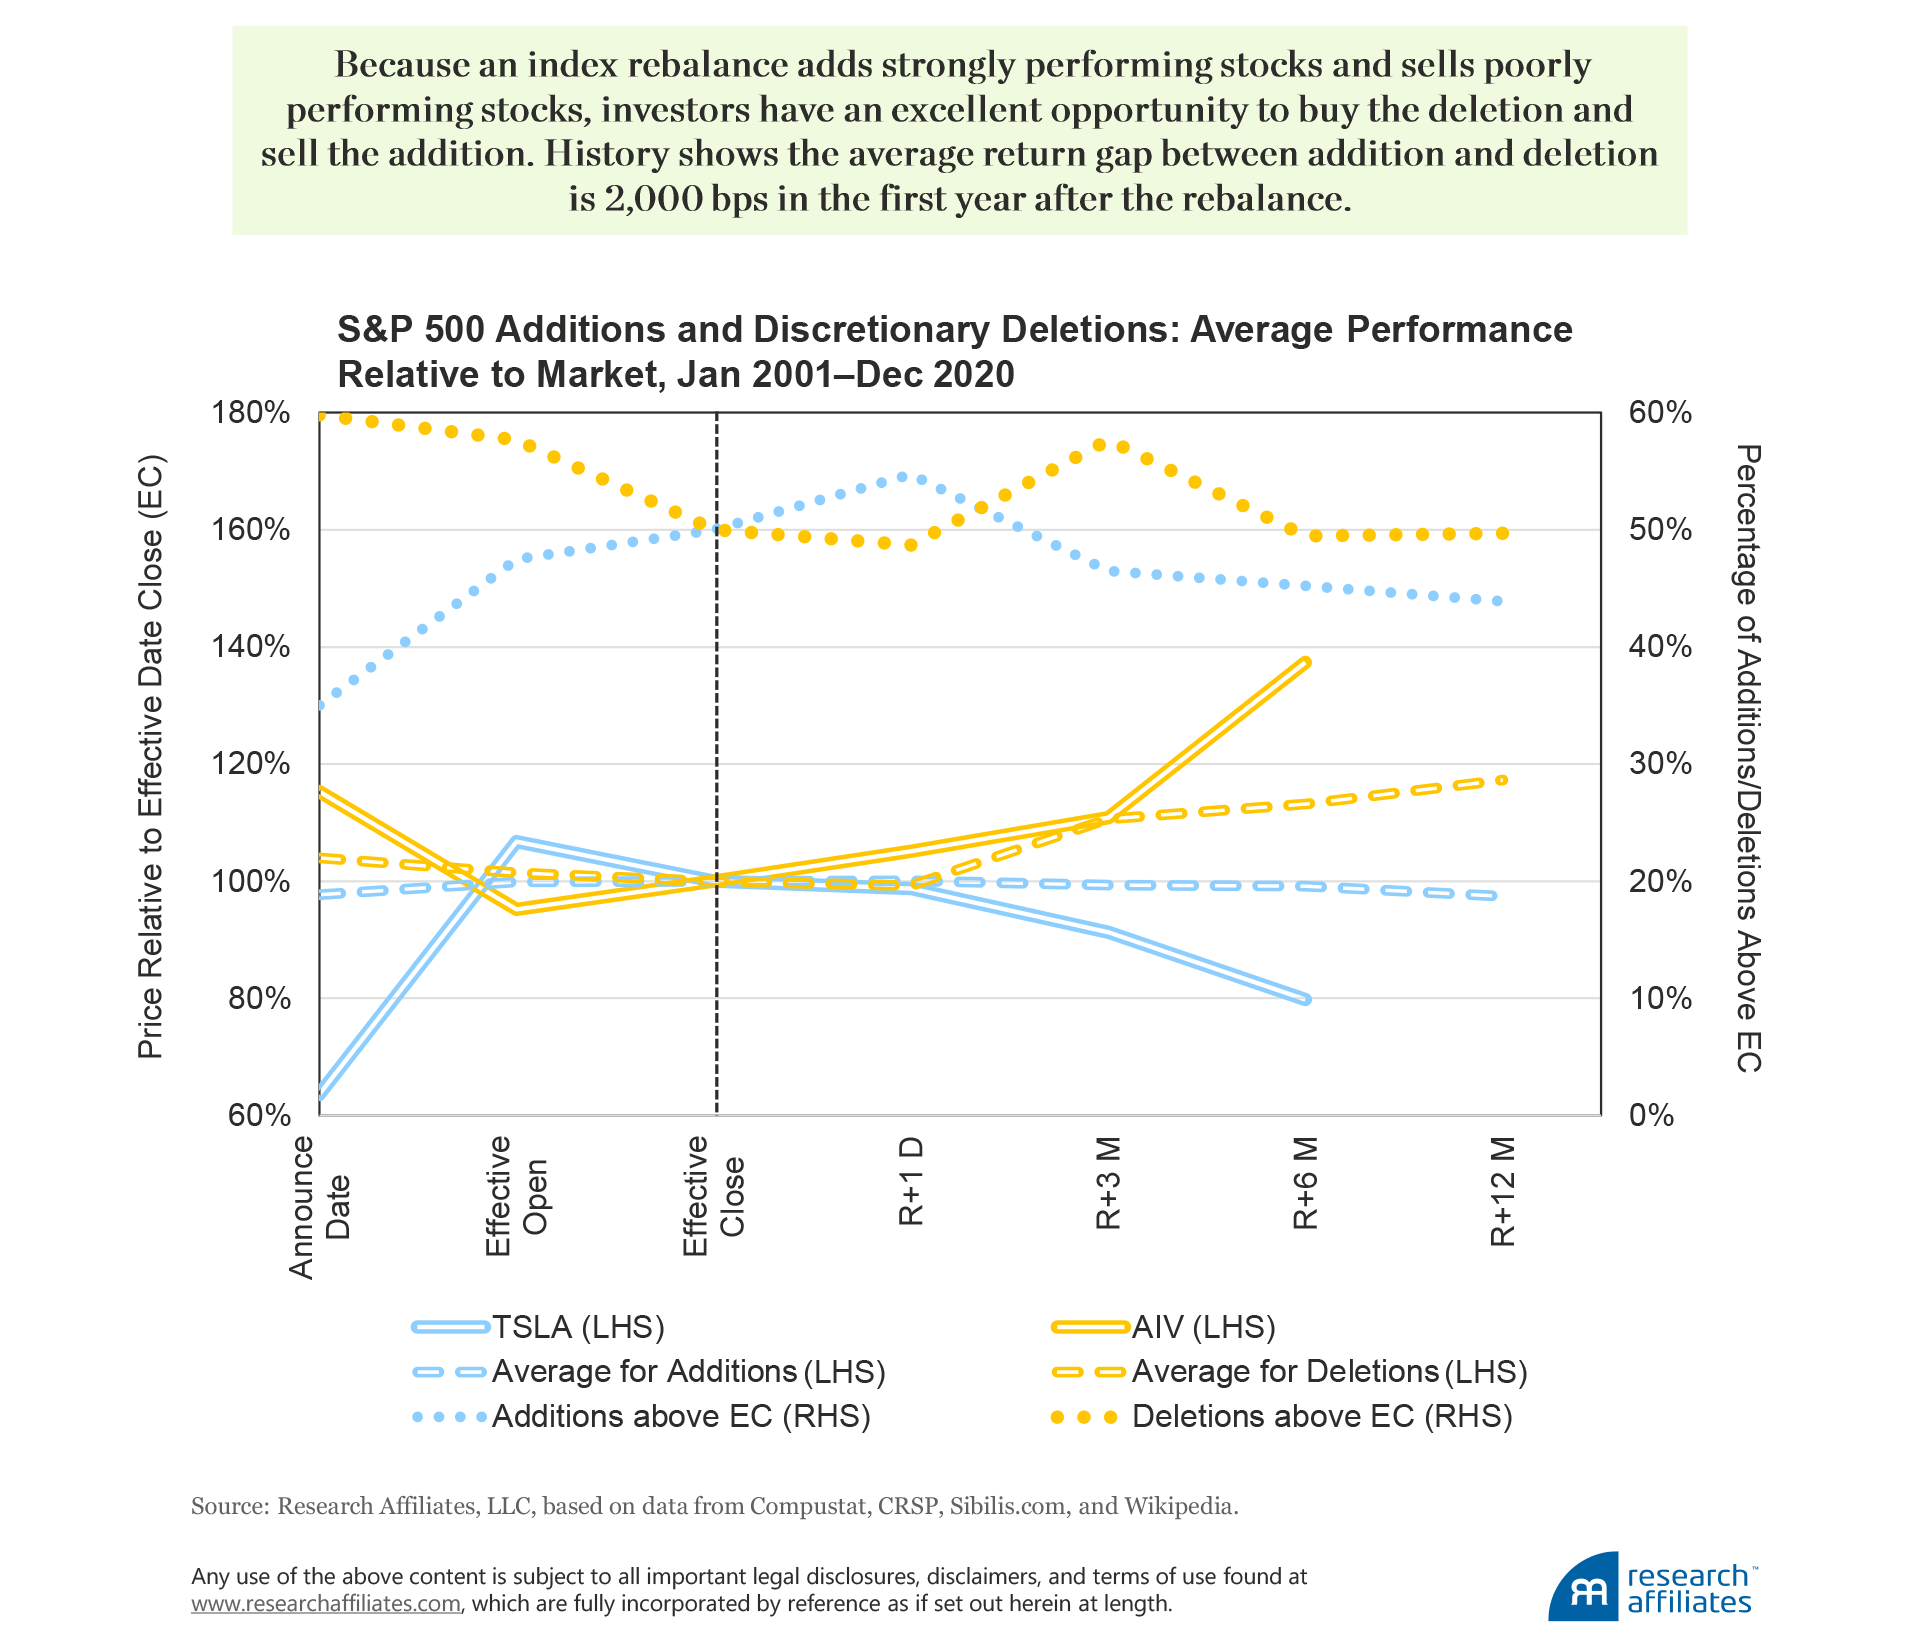
As of year-end 2019, approximately $4.6 trillion of investment capital was directly tracking the S&P 500 and another $6.6 trillion was benchmarked to the index. When the composition of the index changes, the resulting trades drive up the price of the addition and pull down the price of the deletion. Only 35% of additions to the index will have a higher share price on the day the Index Committee announces the stock will be added than the effective closing price on the day they are actually added. The prices of the remaining 65% of added stocks rally between announcement date and effective date of the addition. Reciprocally, at the open on the announcement date, 60% of discretionary deletions are above the effective closing price on the day they are removed from the index. Thus, the share price of 60% of discretionary deletions falls between announcement and effective date. Over the last two decades, on average the deletions underperformed the additions by 6.2%, from the market open on the announcement date to the market close on the rebalance date.6
Typically, an additional 1.0% of underperformance follows on the first day after the addition is made as some index trackers play catch-up on trades they did not complete on the effective date. This additional 1.0% is primarily due to buying pressure from the liquidity providers who traded the stocks ahead of the rebalance as well as from trading activity on the rebalance date. Most index-tracking strategies trade en masse at the exact closing price the day before the addition officially occurs.
Following the rebalance event, prices of the two stocks that were added and deleted will start to move in the opposite direction. Over the 12 months following the rebalance, our research shows only 43% of additions finished ahead of their effective closing price relative to the market. Because stock prices can rise much more than they fall, this translates to only an average 1% loss relative to the market in the 12 months following the rebalance. Reciprocally, fully half of discretionary deletions finish the subsequent 12-month period ahead of their effective closing price relative to the market. Because the gains tend to be significantly larger than the losses, the discretionary deletions beat the market by nearly 20% over the next 12 months, on average. As a result, in the first six months following the rebalance, the additions tend to lag the deletions by 14%, and by month 12, the additions lag by 20%.
The index rebalance is a great opportunity… to do the opposite of what the index does: buy the deletion and sell the addition. Providing index investors liquidity and benefitting from the mean reversion of the price changes has historically proven to be an excellent investment idea.7
Tesla Before and After the December 2020 S&P 500 Rebalance
On November 17, 2020, the S&P’s US Index Committee announced that Tesla would be added to the S&P 500 Index. Tesla’s entry was remarkable on multiple dimensions:
- On the day Telsa entered the S&P 500 it was the sixth largest US company by market capitalization. Tesla was the largest addition to the S&P 500, both by market capitalization and rank, in the index’s history.
- As we noted in December 2020, Tesla was already valued at bubble valuation levels (Arnott, Kalesnik, and Wu, 2020). Comparing valuations on a per-car-produced-and-sold basis, Tesla was more than 120 times more expensive than the traditional automakers. Tesla's valuation was so large it equaled the total market-cap of the nine largest automakers by sales volume: Toyota, Volkswagen, General Motors, Honda, SAIC, Hyundai-Kia, Ford, Fiat Chrysler, and Renault-Nissan. These nine companies were jointly responsible for 94% of global auto market sales in 2020.
- Index funds, ETFs, and other index strategies that track the S&P 500 needed to buy at least $78 billion of Tesla shares at the rebalance-date valuation.8 Closet indexers likely needed to buy a similar, if not larger, amount. From the announcement on November 17, 2020, of Tesla’s addition to the index through the market close on December 18, 2020, one day before the rebalance date, TSLA soared 57%. Meanwhile, AIV tumbled 17%.
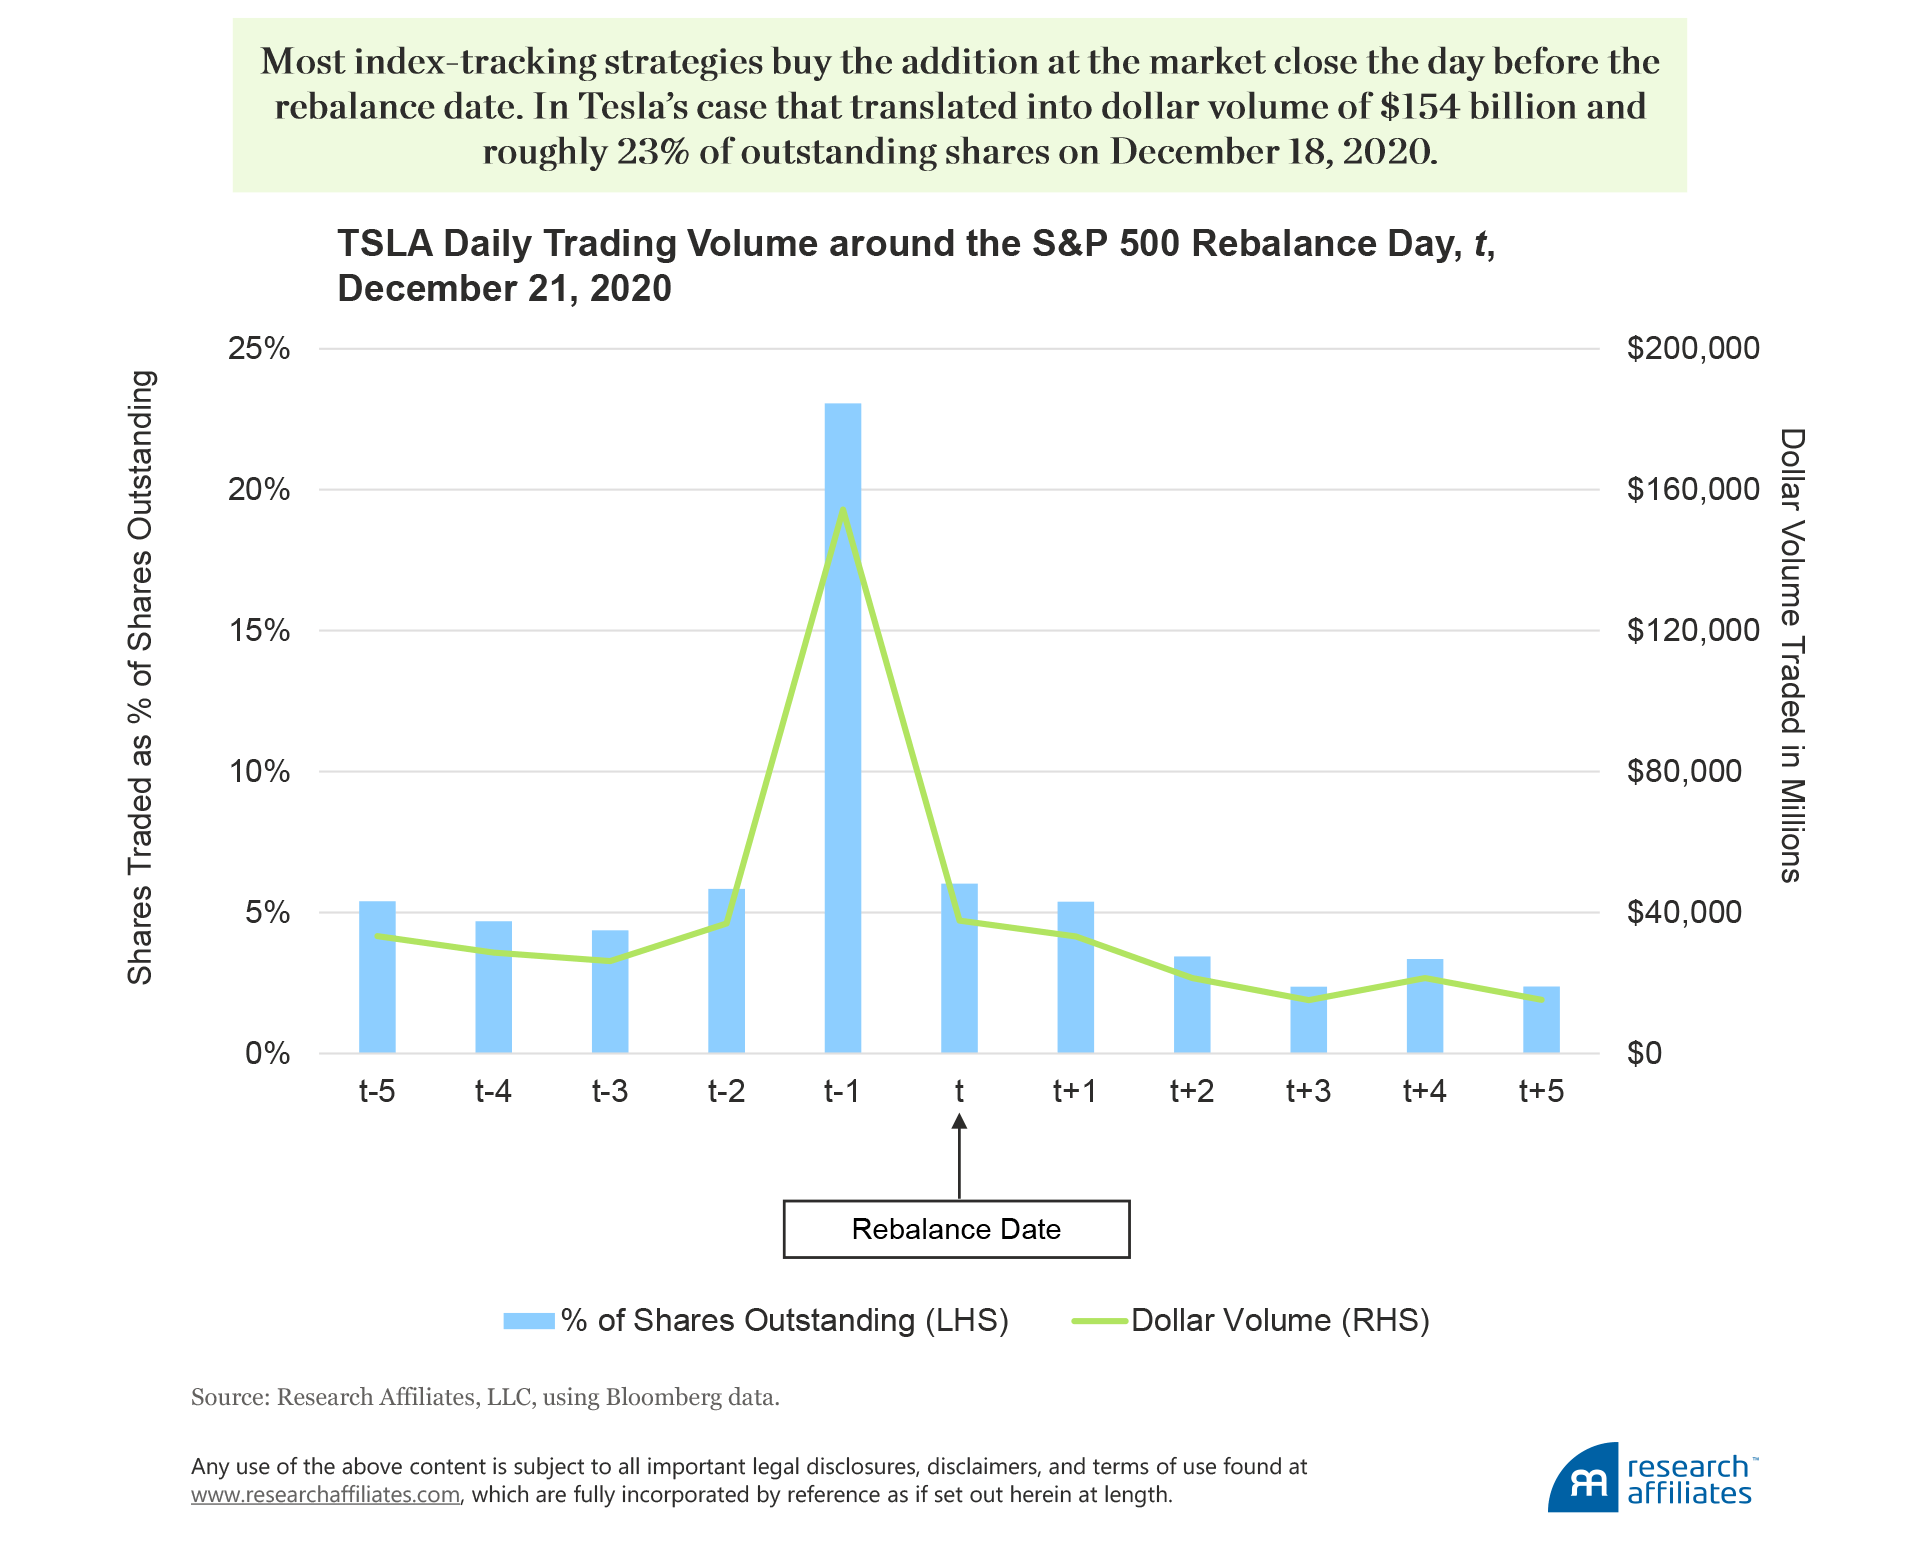
Tesla entered the index in a single shot at the market open on Monday, December 21, 2020. To track the index, investors needed to trade TSLA on the preceding trading day, Friday, December 18. Over the 10 trading days prior to December 18 (excluding the December 18 value), the average dollar-volume traded was $33 billion. On December 18, the dollar-volume traded spiked to $154 billion, the equivalent of 23% of total Tesla shares outstanding. Because the bulk of strategies that track the S&P 500 purchased Tesla on December 18, typically at the closing price, for much of the subsequent analysis we use TSLA’s market close on December 18 as the reference price.
On May 1, 2020, months before Tesla’s addition to the S&P 500, following a 282% year-over-year price appreciation, Elon Musk tweeted “Tesla stock price is too high imo.” Tesla’s market close that day was $140 a share—much lower than its price on entering the index.9 From May 1, 2020, to November 16, 2020, the day before the S&P Index Committee’s announcement that they were adding Tesla to the index, the share price rose another 190% to $408 a share. From November 17 until the market close on December 18, TSLA appreciated another 57%. This massive price appreciation can be partly attributed to the growing importance of the Electric Vehicle (EV) market, the possibility of renewed government subsidies to EV companies, and in recognition that Tesla was profitable for the first time in 2020. We believe the larger contribution to Tesla’s price appreciation, however, is the global EV craze and the price pressure from the long-anticipated S&P 500 rebalance itself.
As Usual, Deleted Stock Wins, Added Stock Loses
Six months ago we suggested that investors could benefit by buying long the S&P 500 deletion, AIV, and by selling the addition, TSLA. We based our support for this investment idea on the bubble-level valuations of TSLA, strong price appreciation after the announcement of its inclusion in the S&P 500, and the general pattern we have observed of S&P 500 deletions’ outperforming S&P 500 additions.
At the six-month mark after the December 18 market close, when the majority of index trackers executed the rebalance trade, a comparison of the growth of $100 invested in TSLA, AIV, and the S&P 500 Index shows a remarkable result: $100 invested in the S&P 500 appreciated to $113.20; for AIV, a $100 investment grew to $160.20; and for TSLA, a $100 investment depreciated to $89.70.
The hidden costs associated with index rebalances could be easily avoided with smarter index design and more-efficient implementation.
”This outcome results from the built-in inefficiencies of an S&P 500 Index rebalance: our research shows that on average in the first six months, discretionary deletions outperformed additions by 14%, and by month 12, the outperformance increased to 20%. When the addition ranks in the top 100 from the date of rebalancing the index, the performance spread is 12% by month 6 and widens to 24% by month 12 (Arnott, Kalesnik, and Wu, 2020). Given the size of its market-cap and the hype around the company, Tesla’s addition to the S&P 500 in December 2020 was the mother of all S&P 500 rebalances. In just the first six months after the rebalance date, an investor who chose to buy AIV and to sell TSLA on December 18 at the market close would today be enjoying a 78.6% relative return advantage—and likely the return advantage does not end here.
Traditional cap-weighted indices routinely buy high and sell low during an index rebalance. Six months after the rebalance into TSLA, we calculate the rebalance cost to S&P 500-tracking investors is 41 bps. Investors, as well as advisors and investment consultants, focus on the expense ratio of funds yet seem to ignore the flaws in the index process that easily cost them 10 times the stated fees. These “hidden” costs could be easily avoided with smarter index design and a more efficient approach to implementation.
Please read our disclosures concurrent with this publication: https://www.researchaffiliates.com/legal/disclosures#investment-adviser-disclosure-and-disclaimers.

Endnotes
- Arnott, Shepherd, and Cornell (2018) offer an actionable definition of a bubble as being a stock or industry (or even country) for which an investor would need to make implausible—though not impossible—growth assumptions to justify its current valuation and—very importantly—for which the marginal buyer does not care about valuation multiples. The authors also caution that bubbles can persist longer and expand more than any skeptic might expect, sometimes outlasting the solvency of those bold enough to short the bubble asset.
- From December 18, 2020, to June 18, 2021, $100 invested in AIV grew to $160.20 and $100 invested in TSLA fell to $89.70. The relative return advantage is calculated as 160.20/89.70 = 78.6%.
- TSLA entered the S&P 500 Index with a weight of 1.69% and AIV exited the index with an estimated weight of 0.012%. Over the period December 18, 2020, to June 18, 2021, the S&P 500 returned 13.16%. In contrast, a hypothetical portfolio that did not rebalance out of AIV and into TSLA would have earned 13.57% over the same period, outperforming the actual index by 41 bps.
- Obviously, these funds are not operating on a charitable basis. They often profit from securities lending and using the stock holdings of passive funds to aid in the trade executions of their active funds. These profits are not transparent to investors.
- The fact that cap-weighting inflicts a performance drag on cap-weighted indices relative to valuation-indifferent indices does not mean that active managers can collectively win. They do not (and cannot) win relative to the aggregate market, because they collectively must own the market portfolio net of whatever the indexers own. If the indexers own the market portfolio, as they approximately do, then active managers will collectively own the same portfolio (Sharpe, 1991).
- Before 1989, the announcement date and the effective date were one and the same. The S&P's Index Committee would announce after the market close that stock A was added and stock B removed, both as of the previous market close. Therefore, the 6.7% underperformance over the last 20 years would have shown up as a trading cost of the index fund. Under intense lobbying from the indexing community, S&P and other index providers began to preannounce index changes. As a result, index funds can claim their trades did not move share prices—because hedge funds and other liquidity providers had already done so!
- In Arnott, Kalesnik, and Wu (2018), we estimate that even an index strategy can use this information to beat the benchmark index. The strategy can simply postpone the rebalance trade by a year. Trading away from the other liquidity demanders and not losing on the mean reversion translates, on average, to 13–25 bps a year of additional performance.
- Tesla enters the S&P 500 with a weight of 1.69%. Passive funds—mutual funds and ETFs—held about $4.6 trillion in AUM that directly tracked the S&P 500. These funds needed to buy about $94 billion TSLA ($4.6 trillion × 1.69% = $78 billion). Tesla’s trading volume spiked on December 18, 2020, at about 222 million shares. That day’s closing price of $662 a share implies the actual trading by market participants was equal to about $147 billion. Many large institutional investors own the S&P 500 in separately managed accounts, which accounts for the difference.
- On August 31, 2020, TSLA split 1 to 5. We quote TSLA on the split-adjusted basis.
References
Arnott, Rob, Vitali Kalesnik, and Lillian Wu. 2018. “Buy High and Sell Low with Index Funds!” Research Affiliates Publications (June).
———. 2020. “Tesla, the Largest-Cap Stock Ever to Enter S&P 500: A Buy Signal or a Bubble?” Research Affiliates Publications (December).
Arnott, Rob, Shane Shepherd, and Bradford Cornell. 2018. “Yes. It’s a Bubble. So What?” Research Affiliates Publications (April).
Sharpe William F. 1991 “The Arithmetic of Active Management.” Financial Analysts Journal, vol. 47, no.1 (January/February):7–9.
Treynor, Jack. 2005. “Why Market-Valuation-Indifferent Indexing Works.” Financial Analysts Journal, vol 61, no.5 (January): 5–69.
