
How COVID-19 Vaccines and Brexit Create the Trade of the 2020s
Around the globe, value is trading at extremely deep discounts relative to growth. The discounts are wide no matter how we measure valuation.
While we still like our last named trade of the decade, emerging markets value stocks, the UK equity market, and UK value stocks in particular, are now even cheaper.
With the final Brexit deal done and the rapid COVID vaccination rate in the United Kingdom, the outlook for UK value is extremely promising, enough for a “trade of the decade.”
In mid-January 2016, when emerging markets (EM) value stocks were extraordinarily cheap, Research Affiliates identified this segment of the market as “the trade of the decade.”1 In the first two years after the low of January 21, 2016, EM value earned 80%. RAFI EM, with a value tilt, fared even better with a gain of 85%.2 In the depths of the COVID-19 crash in March 2020, EM value again settled back to bargain-basement prices, offering investors another bite of the apple.
In late 2020, a new kid emerged on the bargain-of-the-decade block. As Brexit negotiations broke down again and again, and a more virulent form of COVID emerged in the United Kingdom, UK stocks, and notably UK value, reached implausibly cheap levels relative to justifiably "fair" values of stocks in other developed economies. We began describing UK value as a new trade of the decade. Even today, UK value remains at remarkably low valuations relative to most of its fundamentals, while enjoying a few fundamental tailwinds.
When the Going Gets Tough…
Most investors are transfixed by current events, but surprisingly few will ask: “Will these events matter much in five years?” Neither Brexit nor the COVID-19 pandemic is likely to have near as much impact in 2026 as in 2020–2021. Therefore, the market shocks induced by these events represent opportunities now.
The COVID-19 pandemic continues to have an enormous impact on the global economy. Although still too early to tally the numbers, many indicators place the current recession—and in many countries, a double-dip recession—among the worst shocks the world economy has experienced over the last century. According to the International Labour Organization (ILO) (2021), the pandemic caused an 8.8% decline in global working hours in calendar-year 2020, the equivalent of 255 million jobs lost. The ILO measures the impact as about five times as large as the 2009 labor losses arising from the global financial crisis. The 2020 losses disproportionately afflicted the working poor, most of whom do not have the luxury of working from home.
The COVID-19 pandemic is tamping down both the supply and the demand sides of the economy. For example, a survey by the Institute for Supply Chain Management found that “nearly 75 percent of companies reported supply chain disruptions… due to coronavirus-related transportation activities” (Sengupta, 2020). The demand side is being impacted as government-imposed restrictions limit customers’ access to goods and services. Notably, few if any of the people making these lockdown decisions are in any risk of losing their job or in need of reinventing their lives for a new economy. In response to both supply and demand shocks, companies continue to cut jobs, further hurting demand as laid-off workers stop spending because their income is reduced.
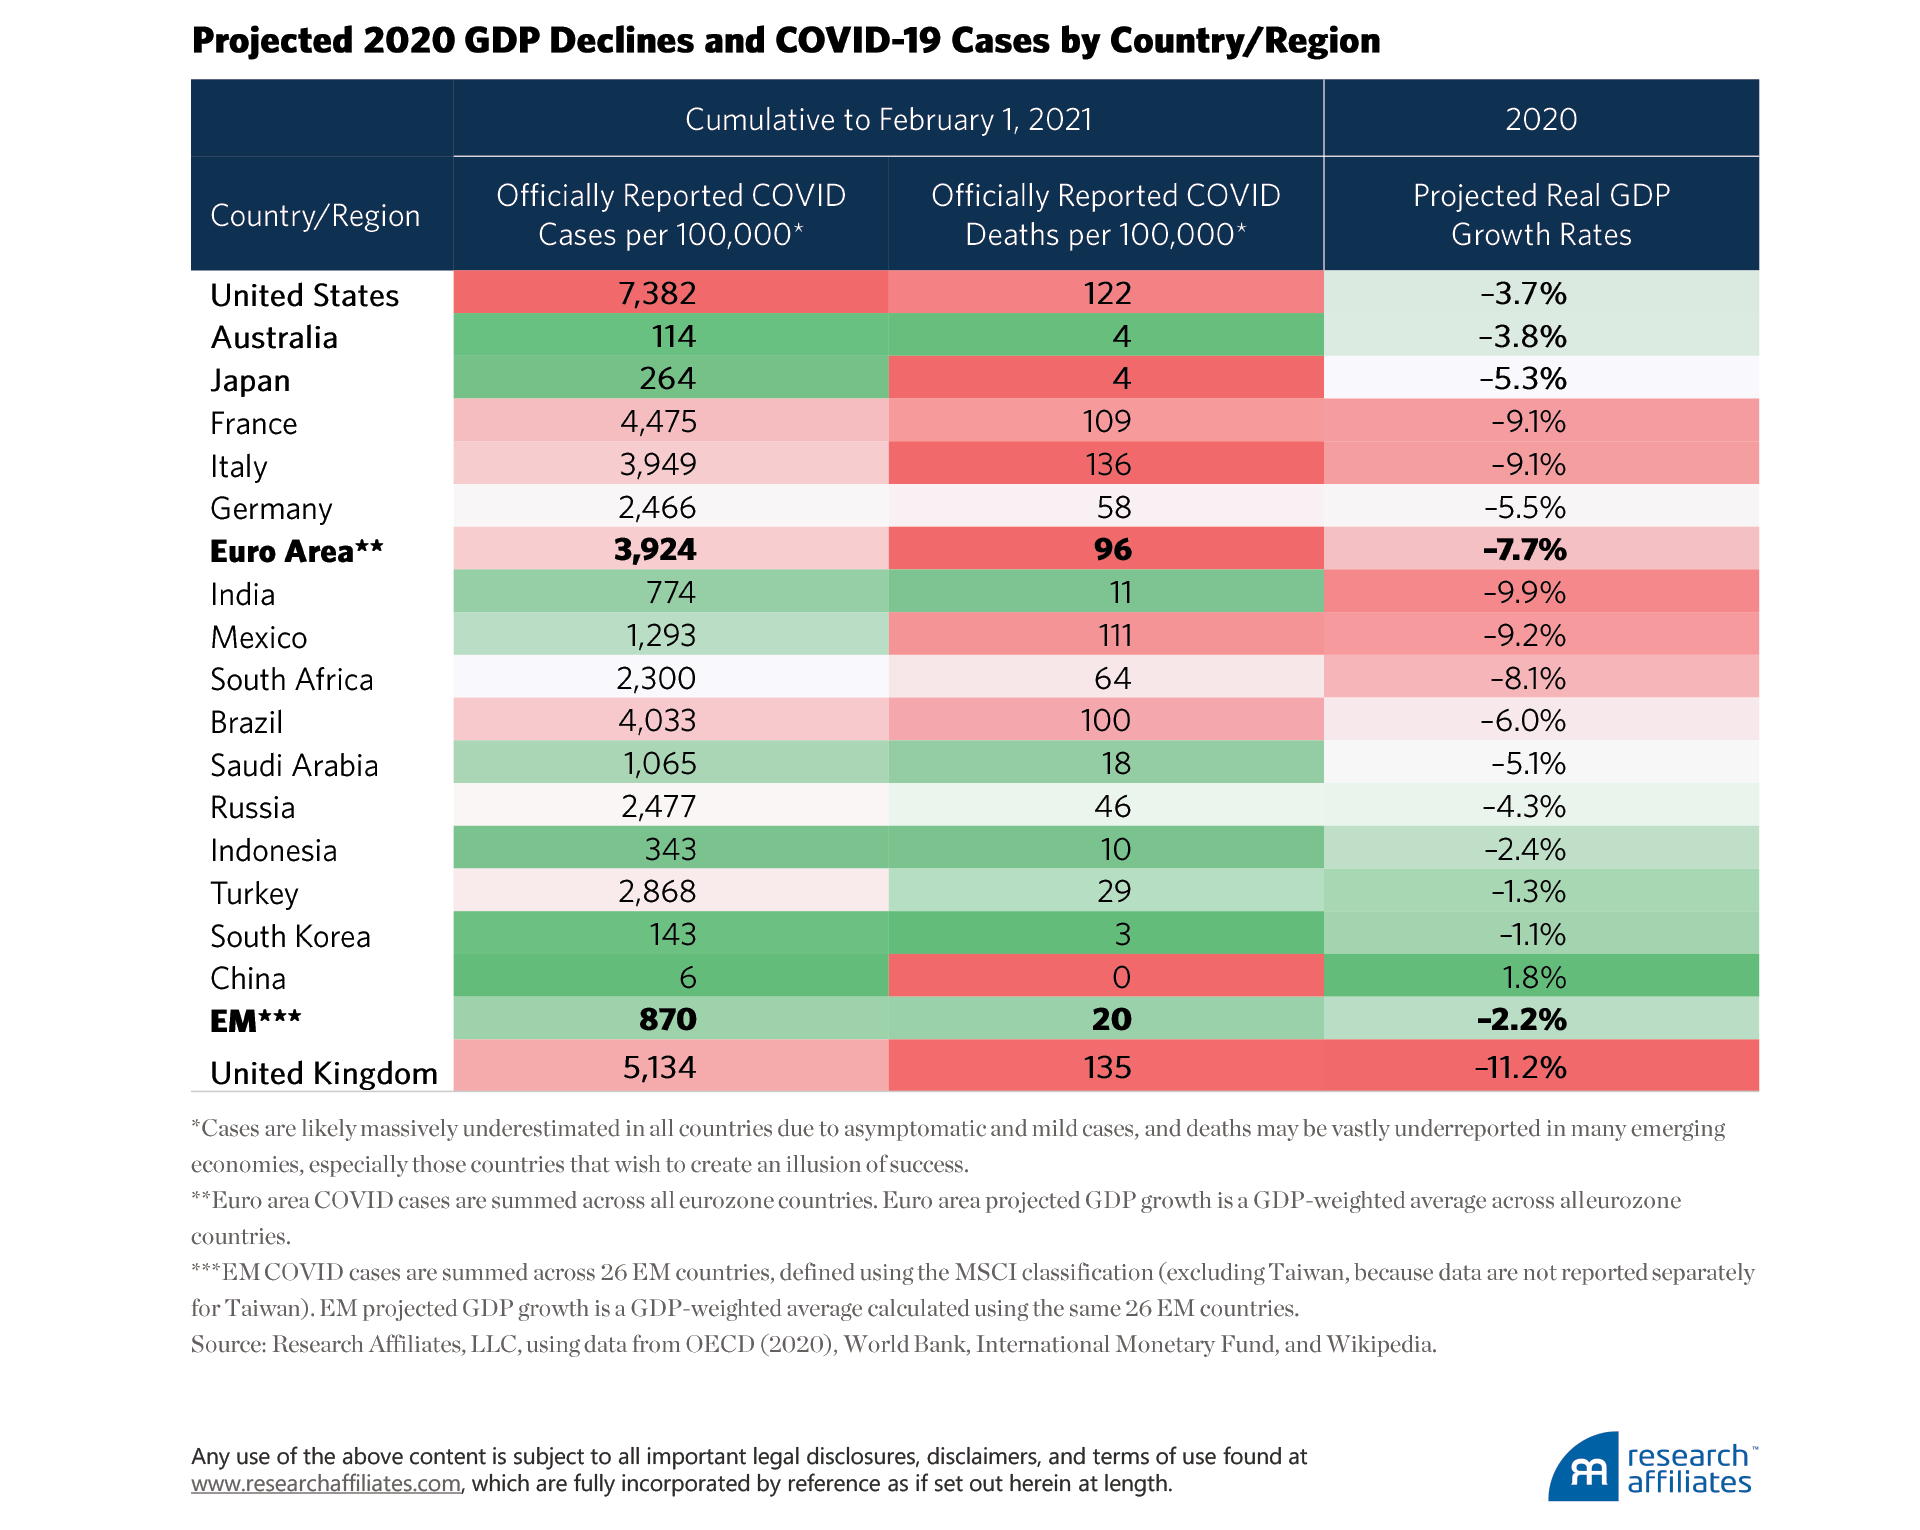
The spread of COVID-19, the resulting lockdowns, and the ultimate impact on national and regional economies have been far from evenly experienced around the world. The developed nations of Italy, the United States, and the United Kingdom and the EM nations of Mexico, Brazil, and South Africa suffered some of the most devastating personal and economic tolls of COVID-19.
Consistent with intuition, the GDP declines are typically worse among the countries hardest hit by COVID. For example, 2020 GDP is expected to decline by 9.1% in Italy and 9.2% in Mexico, and the United Kingdom is likely to face one of the deepest GDP declines, currently estimated at 11.2%. The United Kingdom’s poor growth outlook reflects the double whammy of Brexit and COVID-19, magnified by Britain’s correspondingly severe lockdowns.
Governments of most major countries acted with unprecedented effort to resurrect their economies and to prevent their financial markets from collapsing. The economic stimulus packages used to provide economic support came in all shapes and forms and included direct payments to companies and individuals, tax deferral, loans, guarantees, and equity investments.
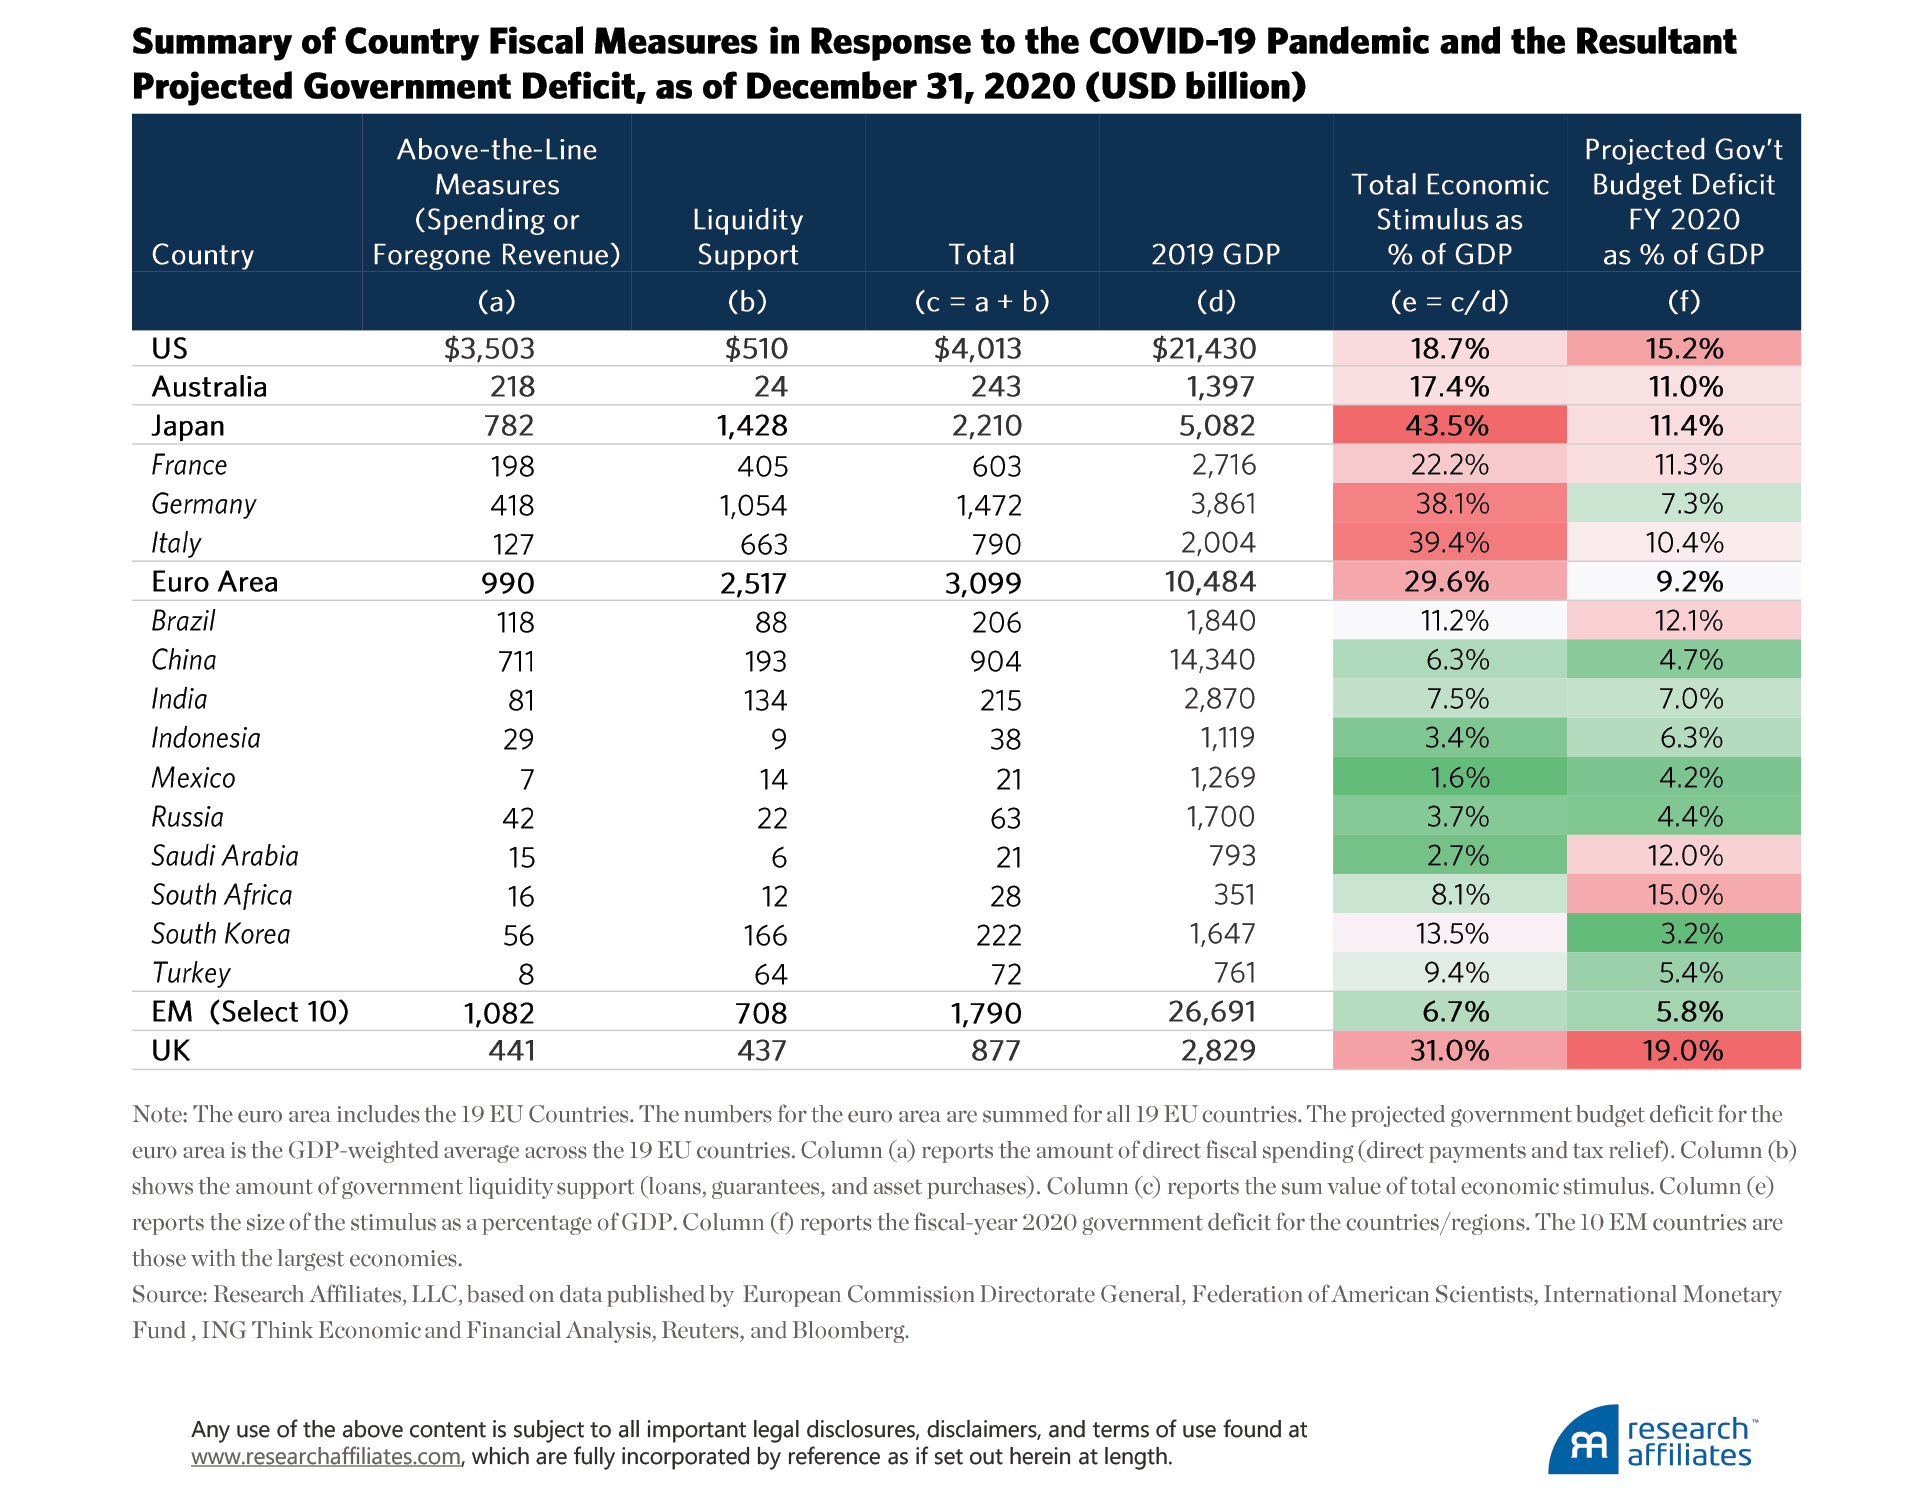
The United States’ fiscal stimulus in 2020 totaled $3.5 trillion, about 16% of 2019 GDP, three times more than the response to the 2008–2009 global financial crisis, when the stimulus program was roughly 5% of 2008 GDP (IMF, 2009). The 2020 stimulus took the form of direct payments to individuals, aid to hospitals, funding for medical research, tax relief to companies and individuals, aid to states and municipalities, and a wide array of arguably less-relevant programs. The US fiscal stimulus very nearly equals the total combined stimulus programs of the rest of the world. The $2 trillion CARES (Coronavirus Aid, Relief, and Economic Security) Act alone marked the largest emergency relief bill in US history. Including the liquidity support the US Federal Reserve Bank provided through quantitative easing, the total value of economic stimulus in the United States as of year-end 2020 approached 20% of GDP.
In Australia, the total value of the economic stimulus program was much smaller (A$243 billion, or US$218 billion) than the US program, but was of similar size (17.4%) relative to Australia’s economy. Ironically, in 2019, the Australian government had just achieved its first balanced budget in a decade. After spending related to pandemic support, the projected Australian budget deficit for 2020 was 11% of the nation’s GDP.
Japan’s COVID-related stimulus package—overwhelmingly focused on monetary stimulus—amounted to 43.5% of its 2020 GDP, the highest of all countries and regions. The Japanese government strongly favored liquidity support over direct transfer payments to businesses and individuals (2-to-1 ratio). This major stimulus package, and Japan’s ability as an island nation to keep the pandemic at bay, did not save the nation from a 5% slump in GDP.
Western European countries have allocated about US$3.1 trillion to a diversity of stimulus programs, about 23 times the inflation-adjusted value of the Marshall Plan after World War II.3 The UK government’s economic response to the COVID pandemic was massive, valued at about 31% of UK GDP—second only to Japan—sending its budget deficit forecast for fiscal-year 2020 to the most severe level, at 19% of GDP, of the nations we compare. As with Japan, the stimulus failed to avert a severe economic downturn.
Interestingly, across the 10 EM nations with the largest economies,4 the GDP-weighted-average size of the stimulus relative to the combined economies of these nations is 6.7%, far lower than in the developed countries. As with the global financial crisis of 2008–2009 (Faruqee, Das, and Blanchard, 2010), the impact on GDP of COVID-crisis lockdowns has been milder in the EM nations.
Perhaps stimulus doesn’t really stimulate?5
The tremendous shock to the global economy from the COVID-19 lockdowns resulted in dramatic declines in corporate earnings. The European, Australian, and UK corporate sectors suffered severe declines in earnings of 50%, 54%, and a staggering 88%, respectively. In the first quarter of 2021, these nations’ COVID-related economic woes are far from resolved, continuing the global flight to safety and fueling a surge in prices of US fixed income and equities, giving further support to these asset classes beyond the US fiscal stimulus and the Fed’s deep pockets.6
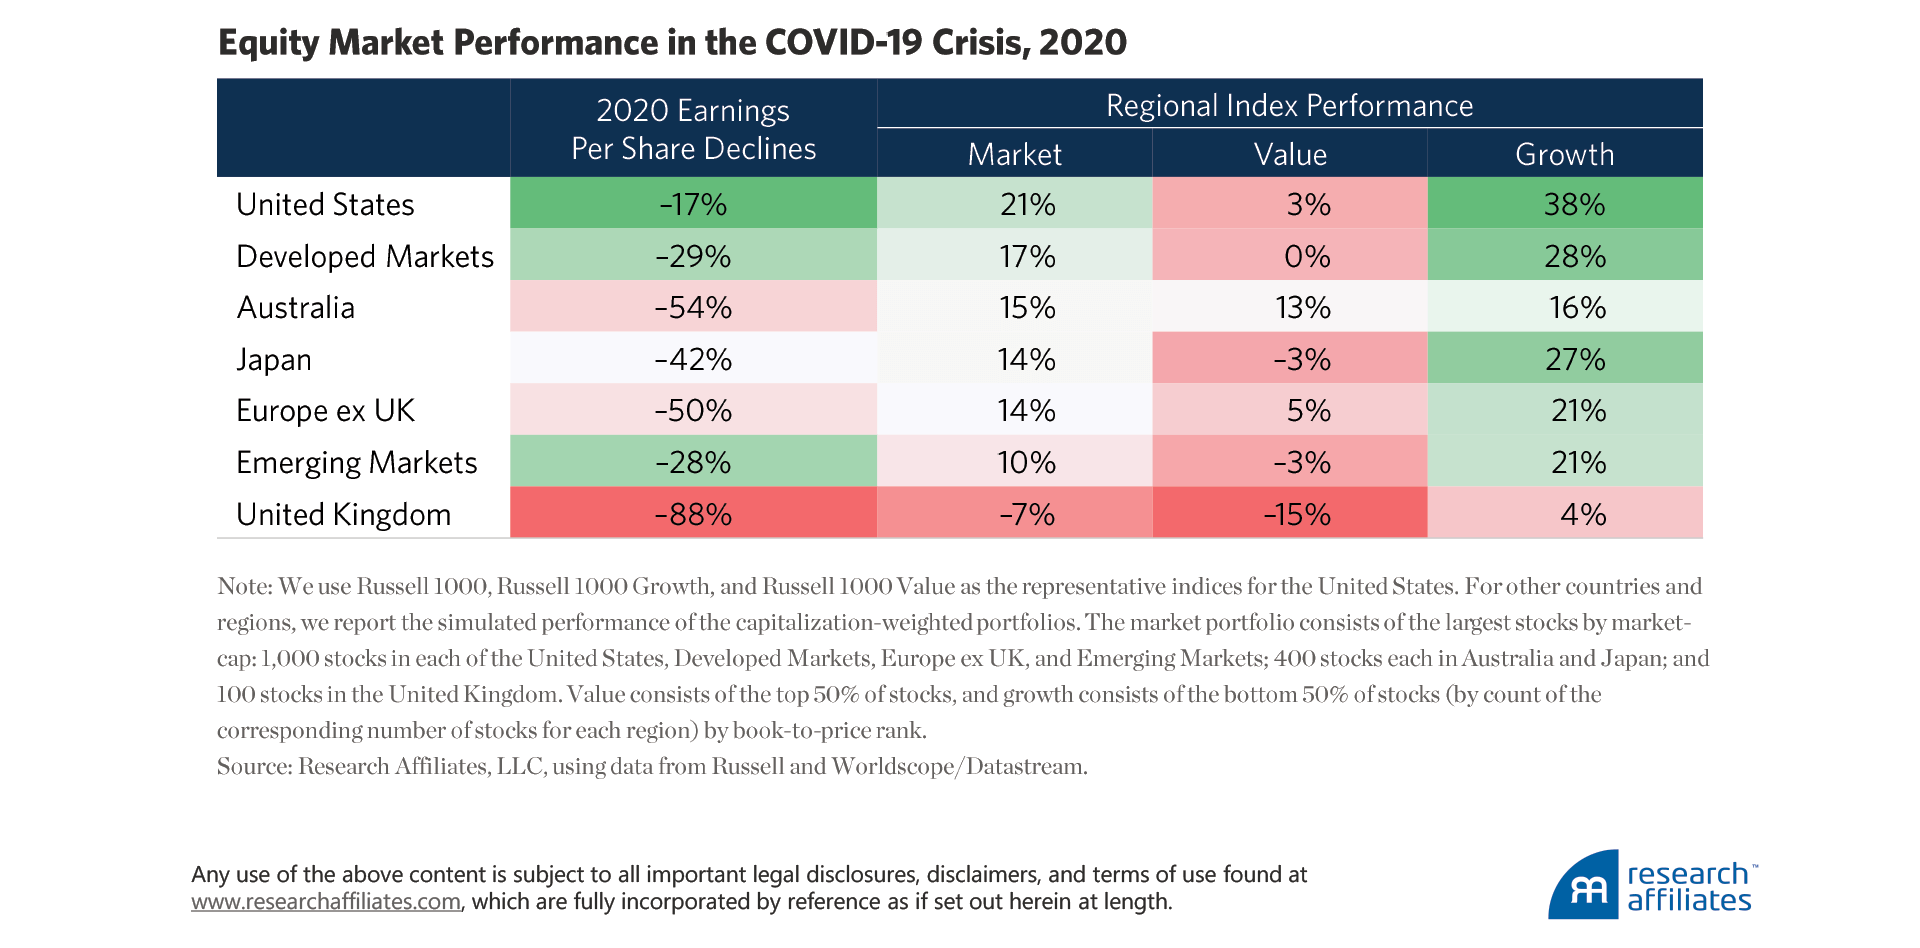
The global flight to safety and the behemoth stimulus packages drove the US equity market to appreciate 21% in 2020. US growth stocks—especially tech companies, in many cases direct beneficiaries of the pandemic—did better still, appreciating 38%. Meanwhile, value stocks, which experienced slower growth and typically weaker profit margins, were harder hit by the COVID market shock and fared much worse (3%). Investors’ high risk aversion to the economic uncertainty of the pandemic significantly weighed on value strategies around the globe, with the exception of Australia. The addition of Brexit uncertainty to the pandemic concerns fed strong negative returns in UK equities in general (−7%) and for value strategies (−15%).
… the Tough Get Going
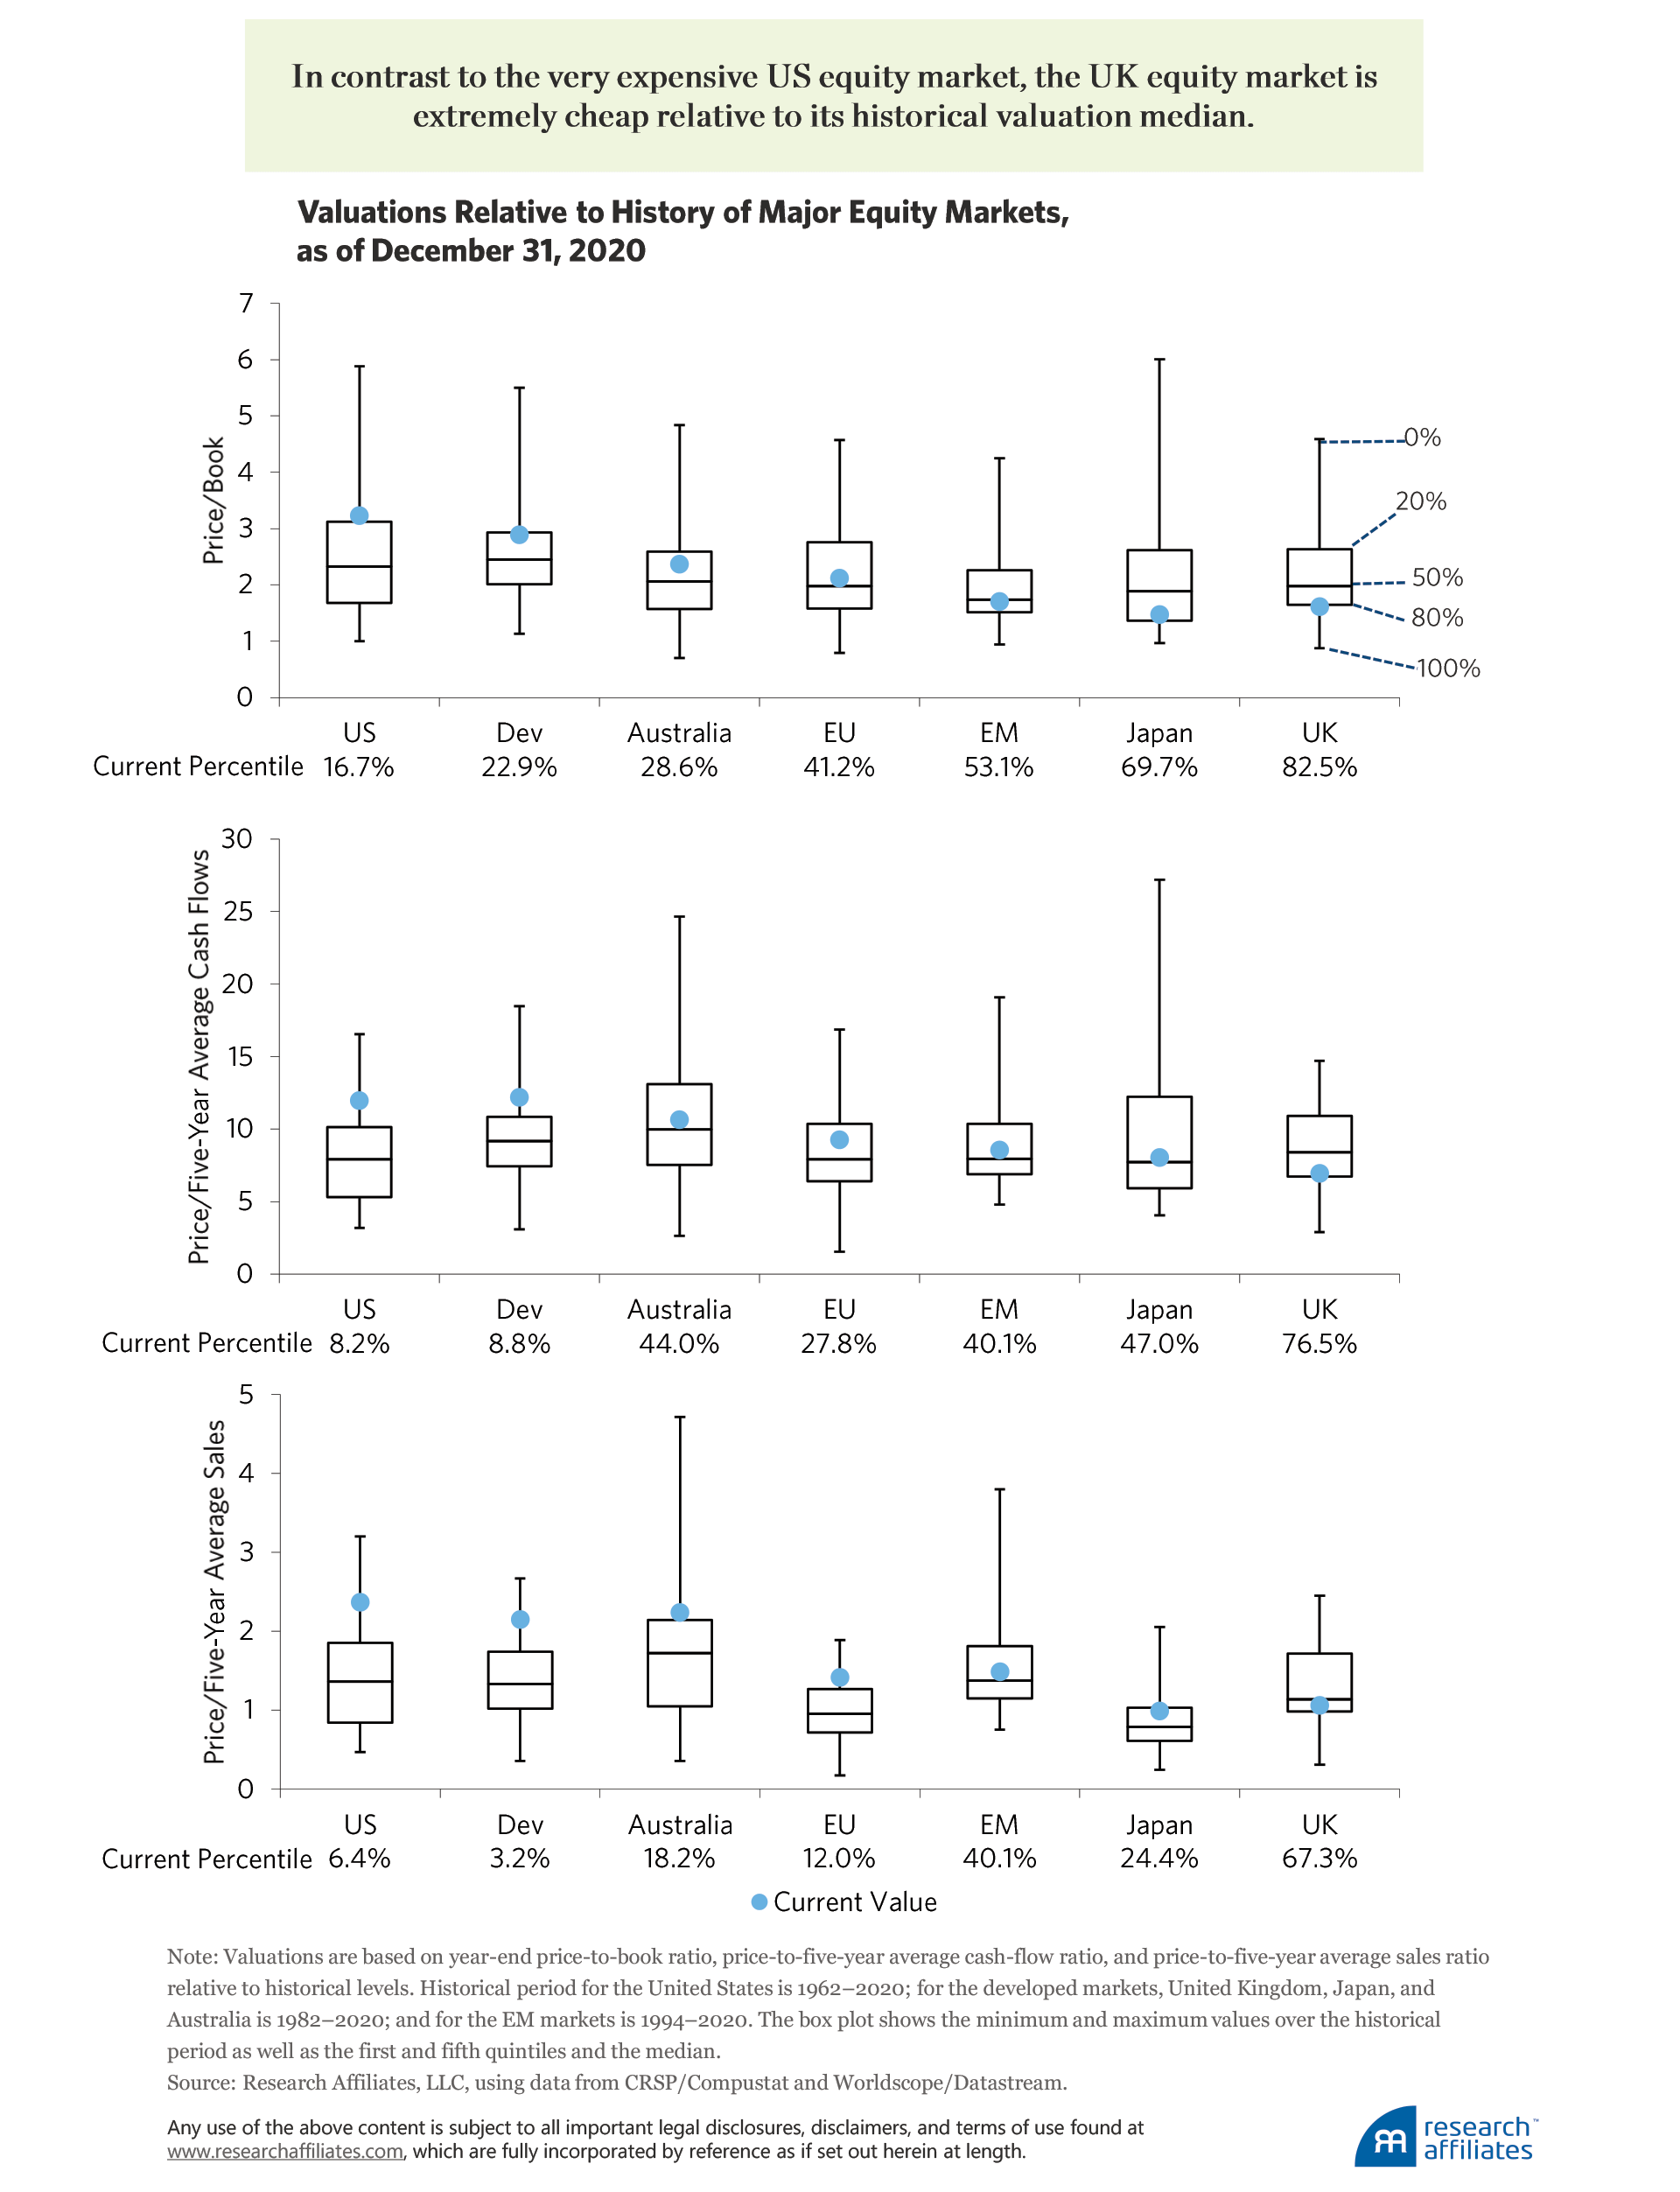
The considerable stimulus packages and aggressive monetary policies of 2020 have led to further declines in discount rates around the world. Near-record-low interest rates meant that a record US$18 trillion in bonds globally sported negative yields as of December 2020 (Mullen and Ainger, 2020). The “TINA” (there is no alternative) narrative propelled US equities to very high valuations relative to historical levels. At a time when most fixed-income assets are priced to deliver anemic or negative yields and starkly negative real returns, and when US equities are very expensive, valuations are unsurprisingly elevated, far away from historical norms.
In the last nearly 60 years, the US equity market has only been more expensive than its current valuation, based on price-to-book ratio, one-sixth of the time; more expensive based on price-to-five-year average cash-flow ratio only 8% of the time; and more expensive based on price-to-five-year average sales ratio only 6% of the time. The majority of the developed equity markets, however, are not so expensive. Australian, European, Japanese, and EM equities are all trading within hailing distance of their historical medians of valuation based on price to book and price to cash flows, while Australian and European equities are in the most expensive quintile based on price to sales.
The UK equity market stands out as trading cheaper than our last named trade of the decade—the emerging markets. Among the major equity markets, at the end of 2020, UK stocks are trading in the cheapest quintile of their historical norms based on both price-to-book and price-to-five-year average cash-flow ratios, and in the bottom third, based on price-to-five-year average sales ratio.
Why is the UK market trading so cheap? First, following the global financial crisis, both European and UK equities lagged, shunned by investors in the wake of the debt crises in Greece and Italy. As the situation in Continental Europe normalized, the United Kingdom was hit by another shock—Brexit—which drove down UK equity valuations even before the COVID pandemic. The fact that the COVID pandemic hit the United Kingdom particularly hard was the last big link in the chain of events responsible for the UK's current cheap valuations.
Most investors are transfixed by current events, but surprisingly few ask: ‘Will these events matter much in five years?'
”Cheap valuations can mean either 1) an attractive buying opportunity because assets are temporarily depressed due to fear and high risk aversion or 2) a value trap in which the financial prospects of British companies could continue declining. If Brexit and the COVID lockdowns are the two main factors responsible for the troubled valuations, will they continue to dampen UK companies’ operations and profits five years hence?
Vaccination, Brexit Deal, and Mean Reversion
The cause of the COVID-19 crisis is biological, and the exit from the crisis will also be biological. The world will emerge from the crisis when the global population achieves herd immunity, halting the ready transmission of the disease. Herd immunity can be achieved through immunization or in the old-fashioned way as people are exposed to COVID and either contract the disease or exhibit resistance.7 Presumably, in the United States and Western Europe, which did not pursue the intrusive contact tracing, enforced quarantines, and closed borders of East Asia and Oceania, a decent share of the population has already been exposed. When most of the rest, the unexposed, have been immunized, the population should approach herd immunity or strong resistance to the virus.
The good news is that several vaccines have shown both safety and efficacy in building immunity against the SARS-CoV-2 virus, the COVID-19 pathogen. Creating the vaccines, producing many millions of doses, and administering those doses to the majority of the population in a short time period is a difficult scientific, industrial, and logistical challenge. That said, the United States alone distributes nearly 200 million flu vaccines each year (an estimated 198 million in the 2020–2021 flu season and 175 million in the previous flu season, according to the Centers for Disease Control and Prevention8). So, the challenge is manageable.
How are the various countries coping with this vaccination challenge?
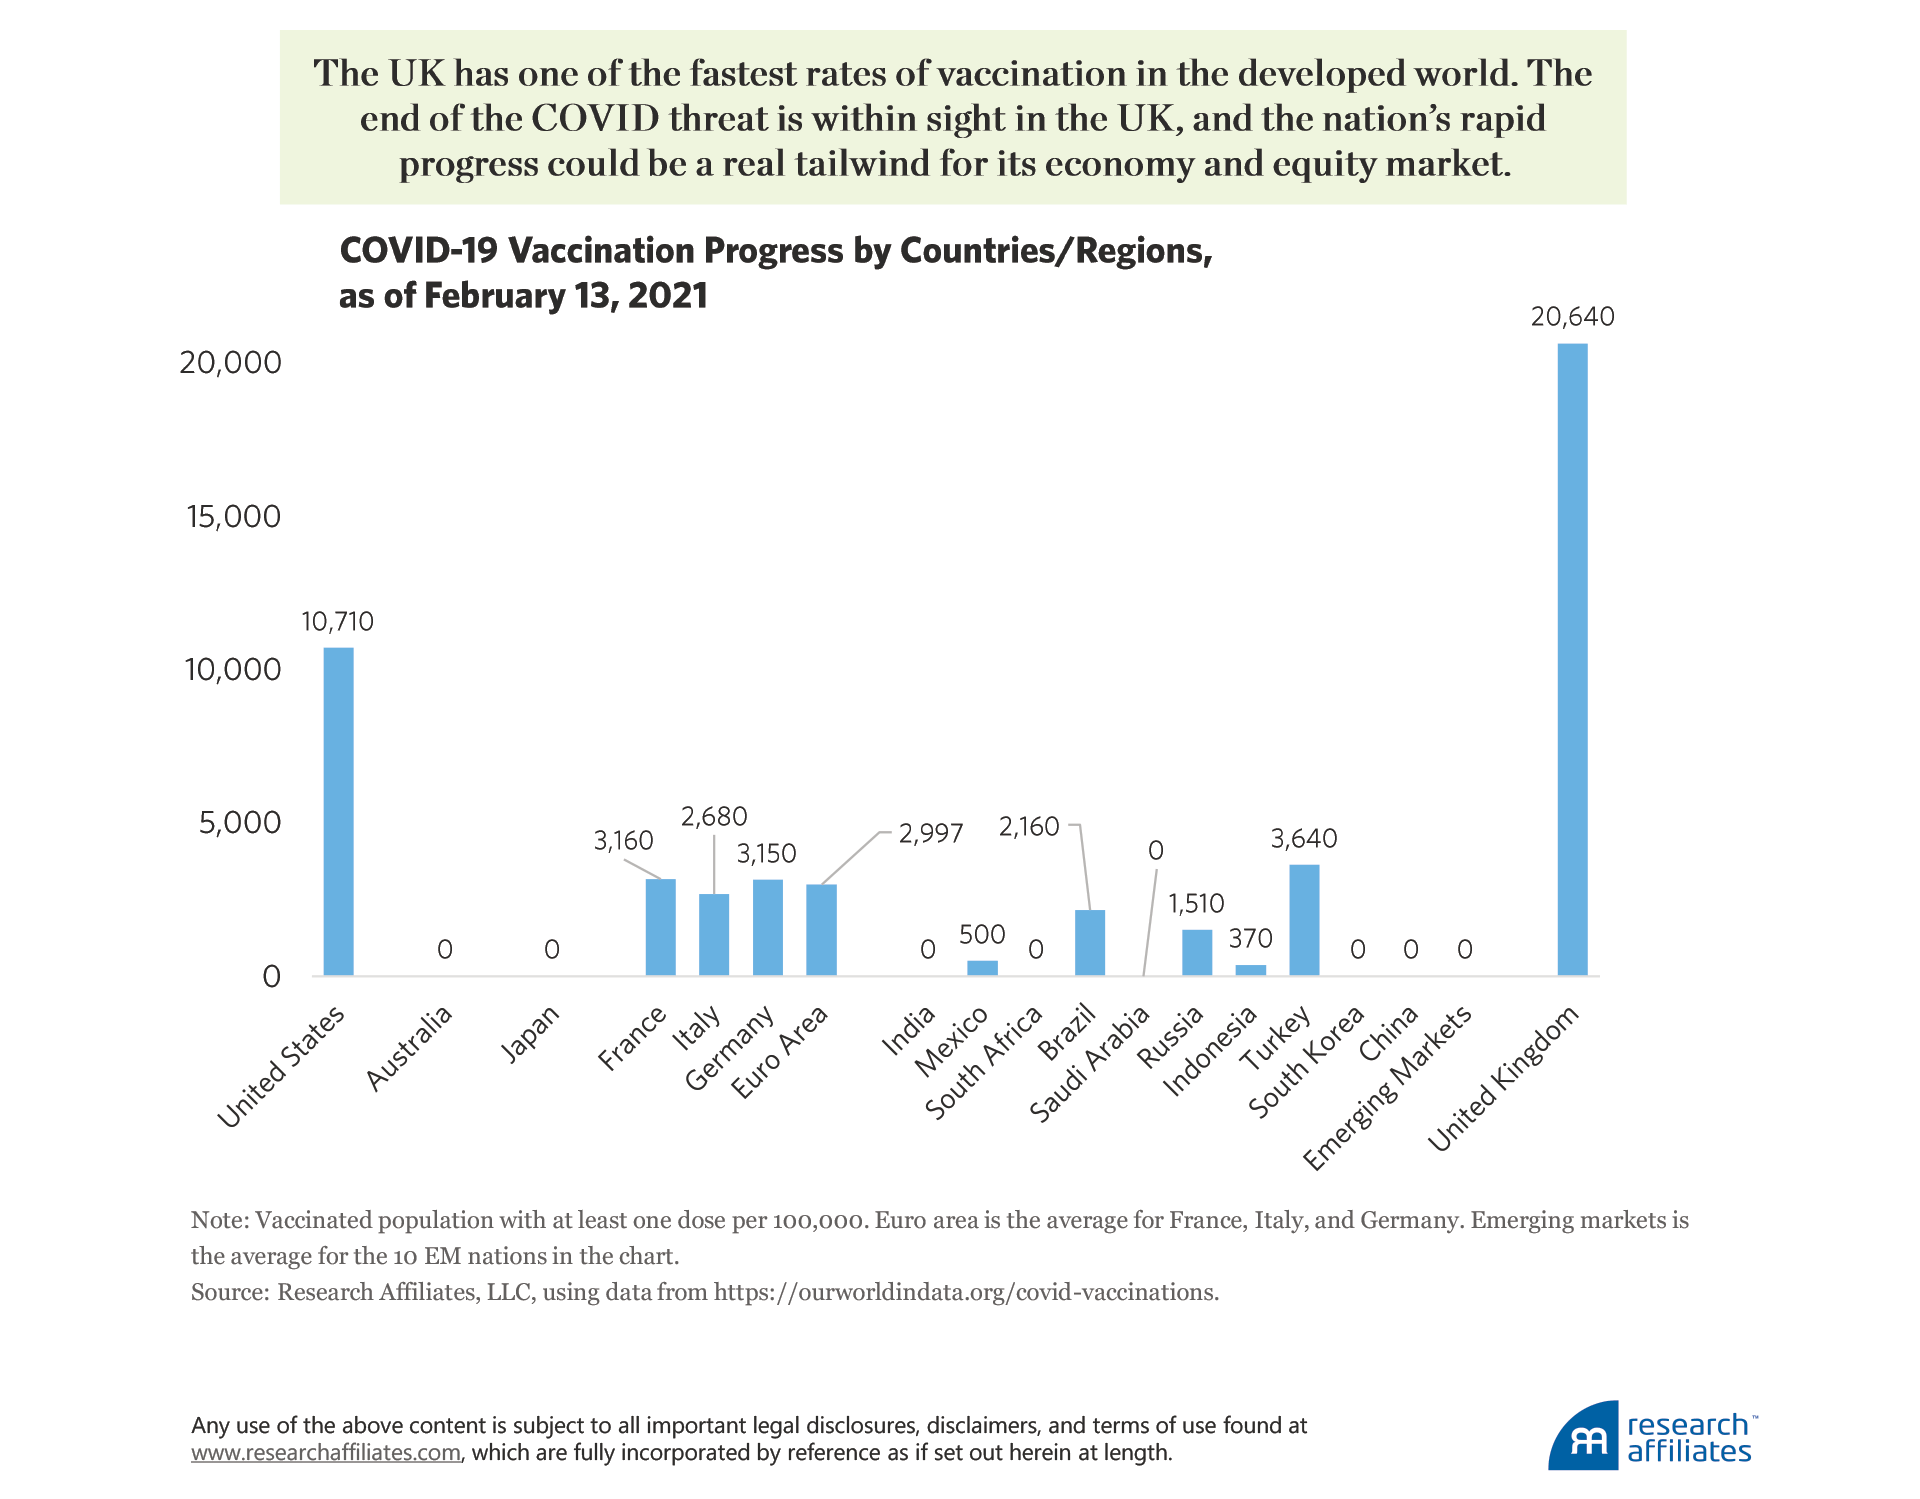
As of February 13, 2021, the United Kingdom is a clear leader in vaccination, having vaccinated 20.6% of its population with at least one vaccine dose.9 The United States is second in the running among the large economies, with 10.7% of the population having received at least one vaccine dose by mid-February 2021, and well over 1 million people “getting the jab” every single day. Other countries, however, significantly lag behind. The European Union’s progress has been deeply disappointing, with only about 3% of its citizens immunized thus far. Given that most vaccine doses were first delivered in January 2021, the United Kingdom clearly has one of the fastest rates of vaccination in the developed world. The end of the COVID threat is within sight in the UK, and the nation’s rapid progress could be a real tailwind for its economy and equity market.
After the 2016 Brexit referendum, the UK equity market suffered significant headwinds. Uncertainty and fear on numerous fronts caused a decline in UK equity prices: What would be the impact of divorcing from the big and well-integrated European market? What would happen in a no-deal Brexit? How might the EU punish the UK (even if at a cost to its own businesses) to set a negative example to other nations wanting to exit the union? And what other unanticipated outcomes could unfold?
In the UK, 2020 was not all bad news. On the eve of 2021, the UK and the EU reached a long-awaited Brexit deal. The main terms of the deal are
- tariff-free and quota-free trade;
- continued cooperation on pension benefits and healthcare for mutual visitors; and
- continued cooperation and recognition of the mutual standards.
Are all Brexit-related perils over now for the UK economy? Not yet. It remains to be seen if the EU will opt for a trade war that would harm future growth for the region. The Brexit deal appears to reduce the likelihood of that scenario, and for each year that passes without new barriers to trade, we believe the prospects for continued free trade are quite good.
With the Brexit deal in place, much of the uncertainty around Britain’s withdrawal from the EU single market and customs union is now resolved. Thus, the Armageddon scenarios envisioned by many on the “remain” side of the debate never materialized. Notably, however, services, which account for the majority of the UK economy, were not included in the final Brexit agreement. This omission is understandably viewed by many as a distinct negative to the Brexit process, particularly as it pertains to financial services.
But as the dust settles on the deal, many have come to believe the exclusion of the services industry will likely be a positive for the City of London. Yes, some jobs have been lost to EU financial hubs, such as Frankfurt, Paris, and Dublin, but not to the extent predicted by many. The trading of Swiss shares is also expected to recommence in London, replacing some of the capital outflows after Britain bowed out of the EU. Optimism now appears strong that the UK can rival global financial hubs such as Singapore and New York.
The UK equity market stands out as trading cheaper than our last named trade of the decade—the emerging markets.
”The UK’s newfound independence from the European Union allows more flexibility in regulating various aspects of its economy. Just the simple example of the UK’s faster rate of vaccination compared to its European neighbors signals that this new independence may reap benefits going forward.10 Such independence of thought when it comes to economic direction and regulation can give the United Kingdom a tailwind in an ever-increasing globally competitive landscape.
Another positive aspect of Brexit is the UK’s freedom to enter preferential trade agreements with other countries and trading blocs. The United Kingdom, on its own, should be more nimble than the EU, which has to agree terms on behalf of 27 different countries, each with its own sovereign process necessary to ratify any deal. Although some would argue the UK has had a slow start in sealing new trade deals, it will be applying to join the Comprehensive and Progressive Agreement for Trans-Pacific Partnership (CPTPP), a free-trade pact that represents a market of around 500 million people. The UK already has trade deals with 7 of the 11 nations that make up the CPTPP. The potential icing on the cake, however, would be the new Biden administration’s decision for the United States to rejoin the CPTPP; the United States withdrew in January 2017. Should the United States not rejoin the trading partnership, a trade deal between the UK and the US is likely at the very top of UK Prime Minister Boris Johnson’s to-do list.
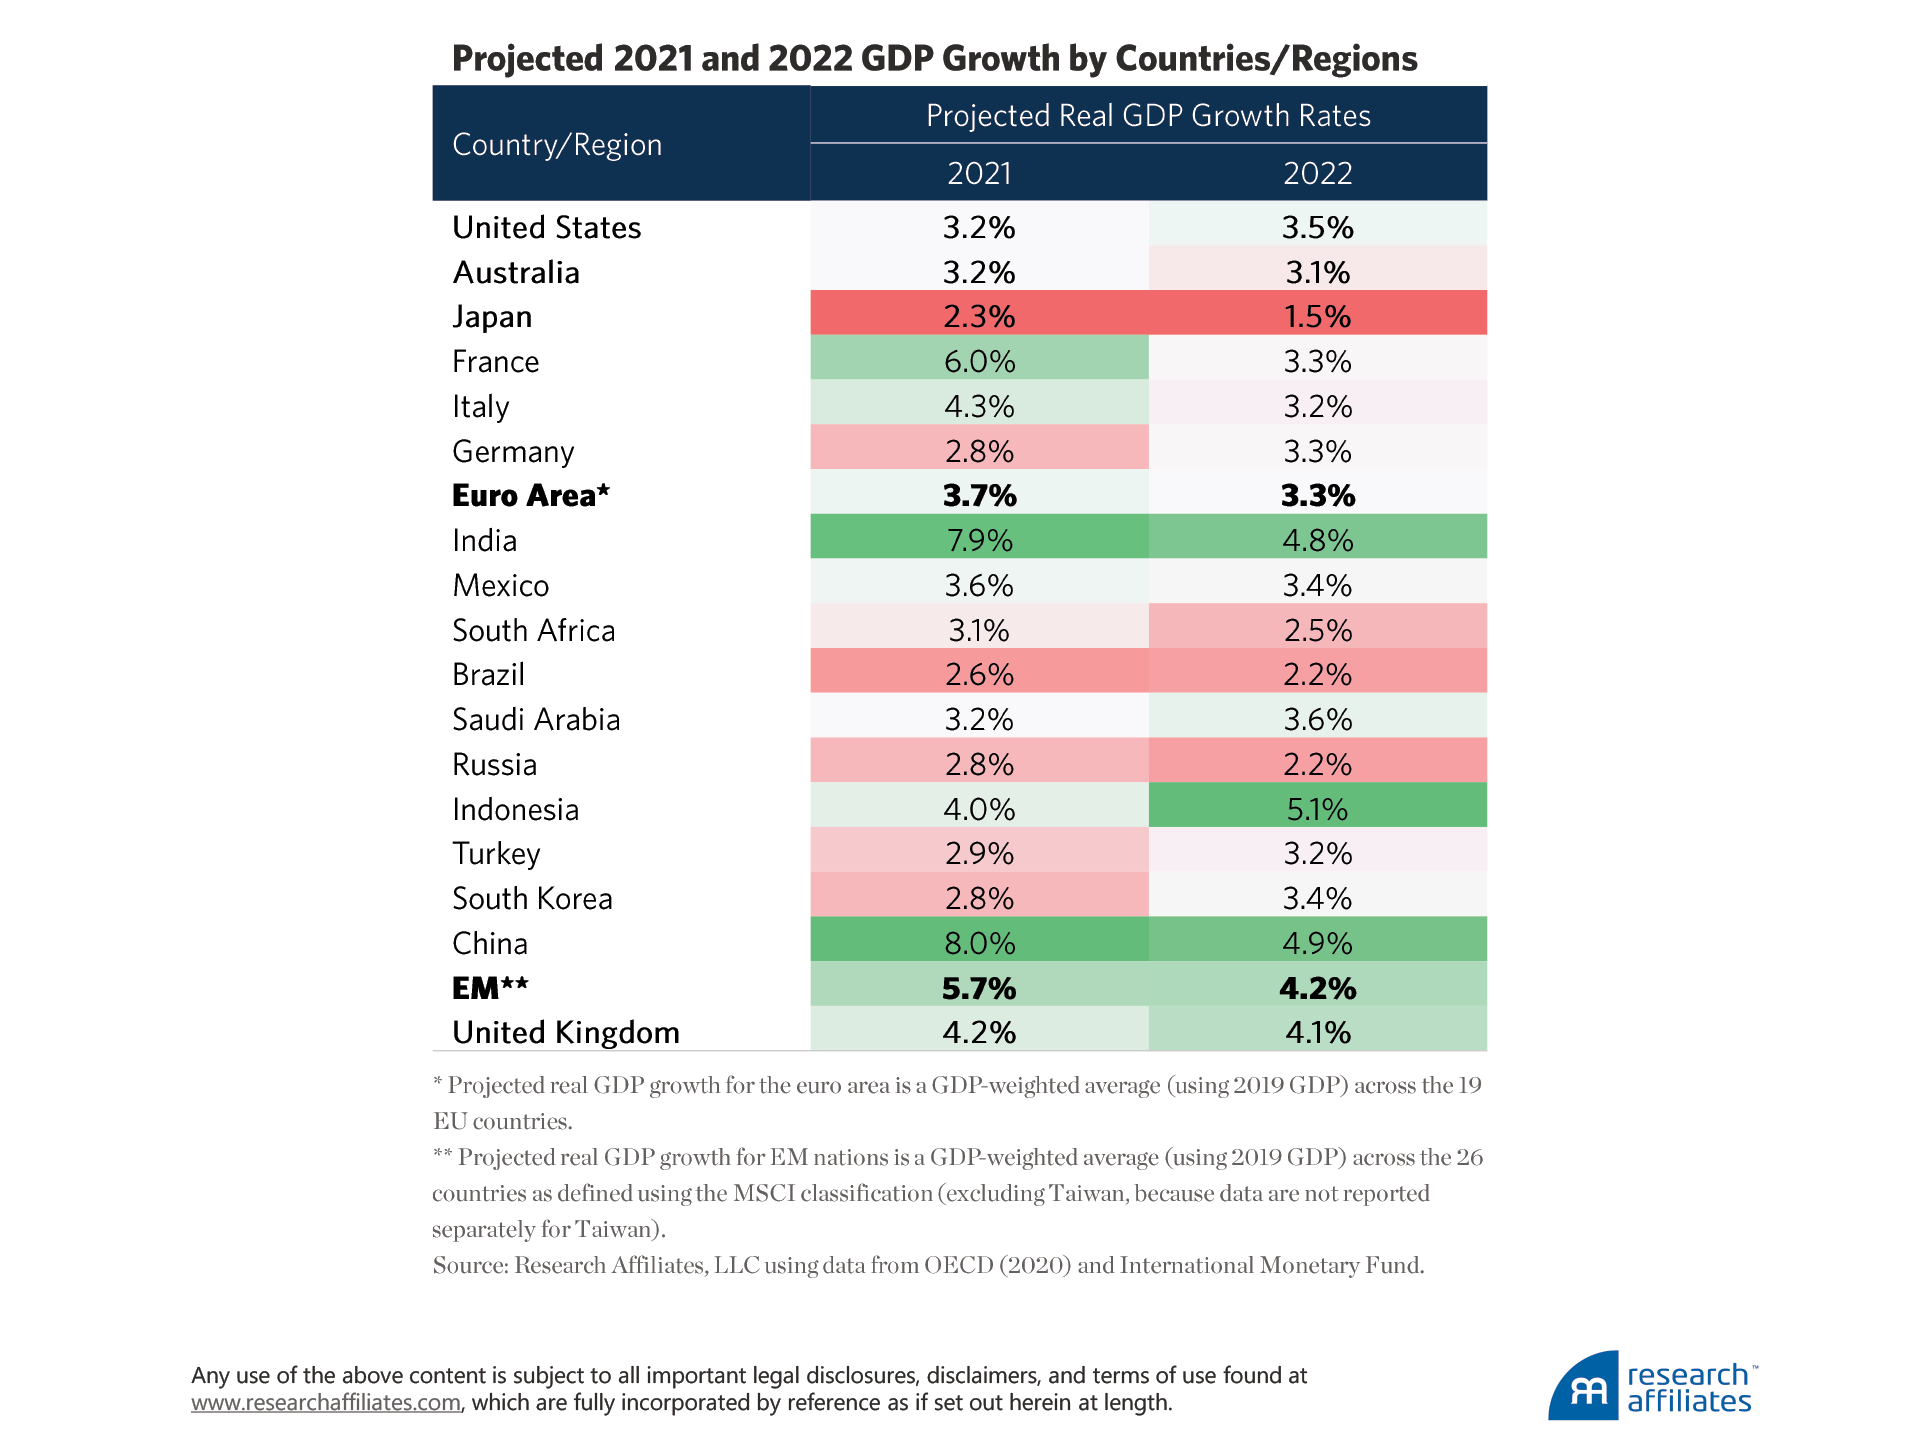
Lastly, the UK’s economy is one of the hardest hit by the coronavirus. The transitory nature of this crisis, as with most crises, suggests that the UK economy should be able to quickly bounce back. The tailwind of vaccination and the clarity around Brexit are responsible for projected UK growth rates in 2021 and 2022 of 4.2% and 4.1%, respectively, which only slightly lag behind the average projected growth rates of the EM economies (5.7% in 2021 and 4.2% in 2022).
What does this mean in terms of potential return going forward?
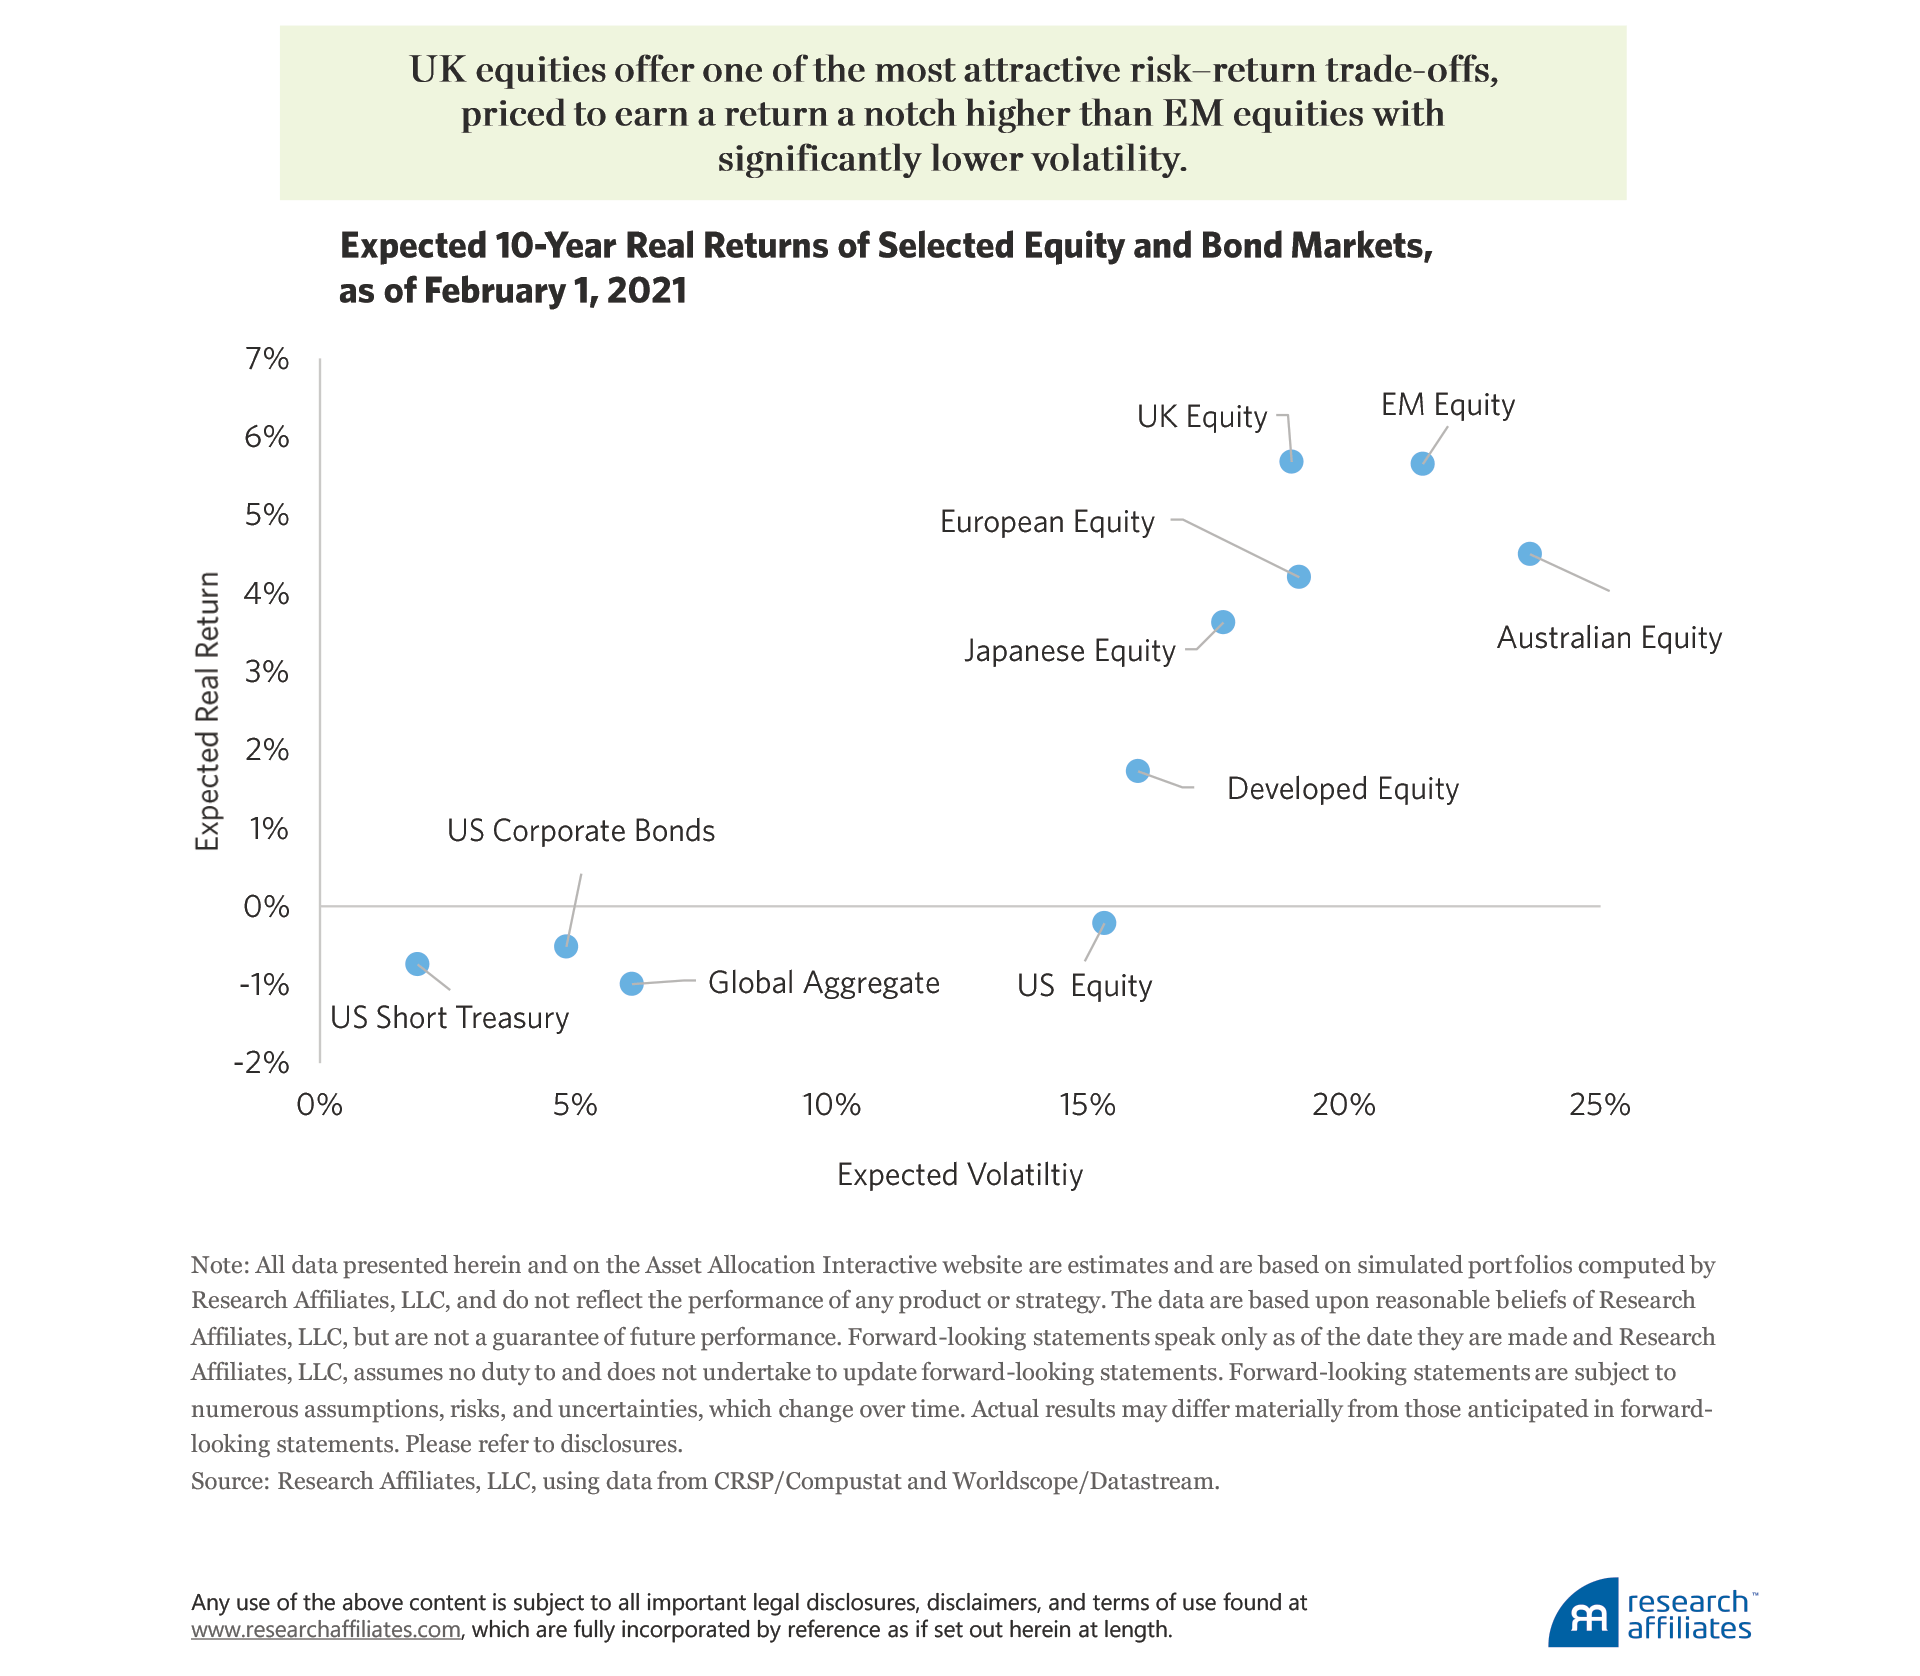
Research Affiliates’ Asset Allocation Interactive web tool uses a fairly simple building-block model that takes into account yield, growth in income, and changes in valuation multiples (or, for bonds, their spreads) to determine the expected long-term return of global asset classes. Most global asset classes, in particular the majority of fixed-income securities and US equities, are priced to deliver returns below the expected inflation rate, resulting in a negative real return. UK equities stand out as offering one of the most attractive risk–return trade-offs, priced to earn a return a notch higher than EM equities with significantly lower volatility.
For current growth-to-value discounts to be ‘fair,’ [we must] assume roughly half of all value companies will go out of business over the course of the current recession. Obviously, this assumption is implausible.
”
Value Around the Globe
UK equities are not the only segment of the market that performed poorly in recent years. US value stocks have lagged growth stocks for nearly 14 years, perhaps ending their drawdown in September 2020. The magnitude and length of the drawdown depends on which valuation measure we use to define value. If we use price to sales, the drawdown began in 2017, if we use price to earnings, it began in 2014, and if we use price to book (using the Fama–French methodology), it started in 2007 (see Arnott et al., 2021). In other regions, value stocks also experienced long and deep underperformance relative to growth. The UK equity market’s underperfomance means it is now trading at relatively attractive valuation multiples. What about value?
Today, around the globe, value is trading at extremely deep discounts relative to growth. Except in Australia, value-to-growth discounts are wider than 95% of the respective country’s or region’s history, in some cases falling into the cheapest percentile of all available history. The discounts are wide no matter how we measure valuation: price to book or price to fundamental value (a composite measure that combines relative price to five-year average sales, five-year average cash flows, five-year average dividends, and the most recent book value).
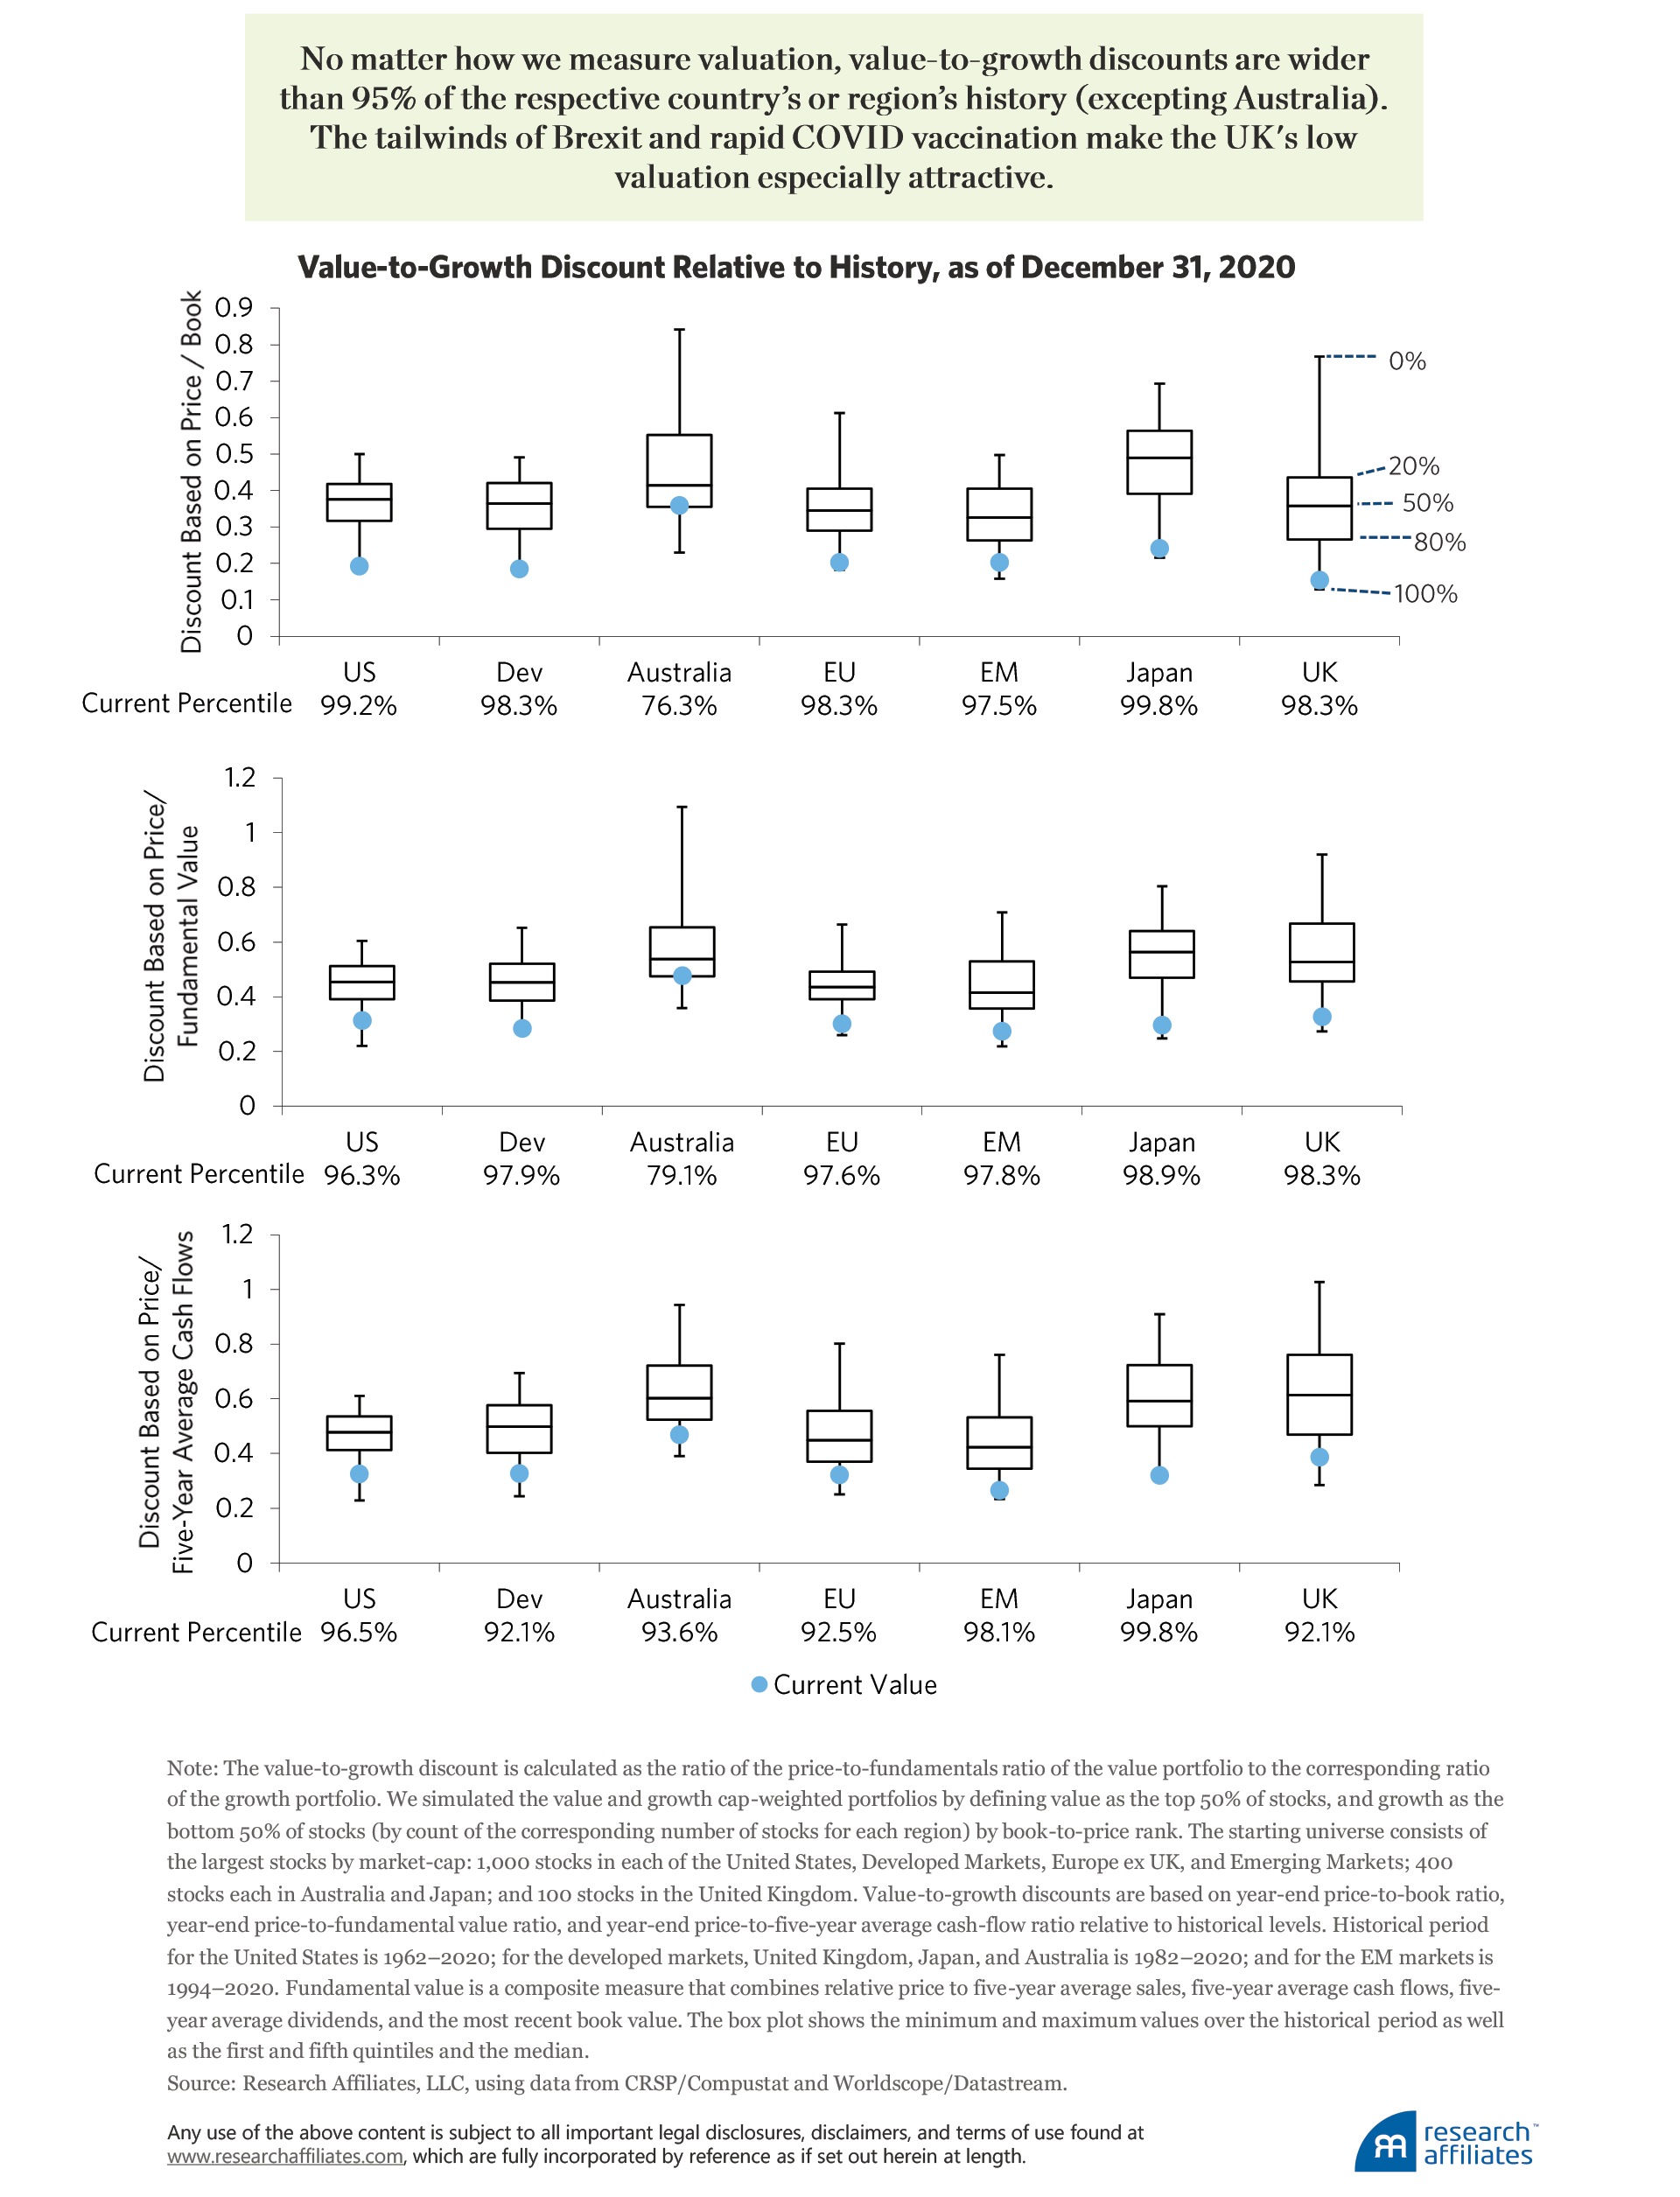
Why are value stocks trading at such deep discounts? Value stocks represent more-cyclical sectors and are much more prone to economic shocks. Perhaps the deep discounts reflect the market’s expectations for large declines in future profits and soaring bankruptcy risk for value companies. For the current discounts to be “fair” discounted cash-flow assumptions, however, it is necessary to assume that roughly half of all value companies will go out of business over the course of the current recession. Obviously, this assumption is implausible.
Over the last decade, retail participation in the equity market jumped markedly. The volume of retail trading rose from 10% in 2010 to about 15% in 2019 and soared to an average of 20% in 2020 (Osipovich, 2020). Many of these new retail investors entered the market only in the last decade and have never experienced the end of a long-lived bubble, such as the tech bubble’s bursting 20 years ago.
The 2020 pandemic-related lockdowns contributed to the tremendous rise in retail participation, as workers suddenly found extra time in their day due to furloughs, layoffs, or simply not having to commute because they worked from home. Further feeding the frenzy of market trading was checking and savings account growth from stimulus payments and lower spending. Many of the new market participants are not investing, but seeking speculative gains and simply gambling, as places such as Las Vegas and Monte Carlo, not to mention sports betting, have largely shut down.
Value stocks are much less shiny and glamourous compared to market darlings like Tesla. In the current COVID-driven environment, the contrarian positioning of value stocks feels especially risky and scary. Extreme underpricing of value stocks relative to their fundamentals, combined with much greater retail participation in momentum trading, has sharpened the contrast between value and growth stocks. This heightened divergence is likely a more reasonable explanation for the current deep discount rates than is the expectation of the lower profitability of value companies. Going forward, undervalued value stocks should offer an attractive long-run source of return.
Conclusion
The long-running saga of Brexit and the more-recent drama of the COVID-19 lockdown crisis have combined to generate unique investment opportunities. In particular, UK equities are now trading at valuation levels comparable to EM equity markets. A major difference, however, is that the United Kingdom is a developed market with a sophisticated economy. The recently finalized Brexit deal means that UK businesses can operate with much less uncertainty. The Brexit deal also opens additional markets to UK firms.
An additional positive is that the United Kingdom is among the world’s champions in leading the COVID-19 vaccination charge. The current low valuations of UK stocks, combined with the tailwinds of the Brexit deal and tremendous progress in vaccination, imply that UK stocks should be especially attractive going forward. Further compounding the investment opportunity of UK value stocks is that value investing in general has suffered significantly over the last nearly 14 years, trading today at bargain-basement multiples. Both UK and EM value stocks may prove to be the trades of the decade.
Please read our disclosures concurrent with this publication: https://www.researchaffiliates.com/legal/disclosures#investment-adviser-disclosure-and-disclaimers.

Endnotes
- Too many people exaggerate in their use of “trade of a century” or “trade of a lifetime.” We are happy when we see a terrific opportunity every 5 or 10 years, allowing for one or two trade-of-a-decade opportunities in any decade.
- We are referencing the FTSE RAFI EM Index. Over the same two-year period, the US cap-weighted index (S&P 500 Index) gained 46.3% and the developed cap-weighted index (MSCI World Index) earned 45.9%.
- The Marshall Plan (or European Recovery Program), signed by US President Harry Truman in 1948, provided 16 nations of Western Europe with a broad spectrum of support programs including food, staples, fuel, and machinery. In total, the United States transferred over $12 billion (equivalent to $130 billion in 2019) in economic recovery aid to these Western European economies after the end of World War II.
- Brazil, China, India, Indonesia, Mexico, Russia, Saudi Arabia, South Africa, South Korea, and Turkey.
- On December 27, 2020, the Wall Street Journal published a letter to the editor from Rob Arnott in which he addressed this very topic:
Words matter. In your editorial “Covid Political Relief” (Dec. 21) you write, “Please don’t call this economic stimulus.” That’s exactly right. Where does the money for fiscal stimulus come from? Current taxpayers or future taxpayers. The largesse is then redirected to selected cohorts in society and used to create goods and services that the private sector often would have created in due course, sometimes faster and always more efficiently than the government can redistribute resources.
Consumption is moved forward from the future; savings and investment are pushed back. Consumption feels good, but savings and investment fuel long-term growth. This is why the recovery from the global financial crisis of 2007-09 was so anemic, while the recovery after World War II was so explosive—federal spending tumbled from 45% of gross domestic product in 1946 to 11% in 1948.
It’s called stimulus for a reason. People who want to control the distribution of national treasure from the future to the present or from haves to have-nots—but all too often in the opposite direction, contrary to stated intent—would rather speak of “stimulus,” a term with positive connotations, than “redistribution.” Some redistribution is necessary and good, but most is neither. Either way, let’s call it what it is.
- There is a direct, but widely misunderstood, link between fiscal stimulus and corporate earnings. Stimulus can make its way into the economy directly, bolstering both savings and spending, which propel earnings higher. Alternatively, stimulus can make its way into the economy indirectly through the capital markets (Brightman, 2015).
- Three “control groups” bear mention: the Diamond Princess cruise ship, the USS Theodore Roosevelt aircraft carrier, and the Manhattan subways. We can reasonably assume that nearly 100% of the population was exposed to COVID-19. In each case, comprehensive testing indicates that roughly 17–25% of the population contracted COVID-19 (Moriarty et al., 2020; Kasper et al., 2020; and Yang et al., 2020), which suggests that most of the world’s population has some measure of resistance to the disease.
- Source: https://www.cdc.gov/flu/prevent/vaccine-supply-distribution.htm
- As of February 13, 2021, the only other developed country with a vaccination rate higher than the United Kingdom is Israel, a tiny country with the foresight to pay a premium to make a special arrangement with Pfizer/BioNTech. The nation received accelerated access in return for access to the anonymized detailed information of those vaccinated (Ben Zion, 2021). By February 13, Israel had already immunized 44.3% (see https://ourworldindata.org/vaccination-israel-impact and slide toggle to February 13) of its modest population with at least one dose.
- Belonging to the European Union does not legally restrict any member state from taking its own path in its vaccination program. The member states chose to collaborate as one by appointing the European Commission to lead the bloc’s vaccine strategy.
References
Arnott, Rob. 2020. “‘Stimulus Sounds a Lot Better than ‘Redistribution.’” Wall Street Journal Opinion | Letters (December 27).
Arnott, Rob, Campbell Harvey, Vitali Kalesnik, and Juhani Linnainmaa. 2021. “Reports of Value’s Death May Be Greatly Exaggerated.” Financial Analysts Journal, vol. 77, no. 1 (First Quarter):44–67.
Ben Zion, Ilan. 2021. “Israel Trades Pfizer Doses for Medical Data in Vaccine Blitz.” AP News.com (January 17).
Brightman, Chris. 2015 “What’s Up? Quantitative Easing and Inflation.” Research Affiliates Publications (April).
Faruqee, Hamid, Mitali Das, and Olivier Blanchard. 2010. “The Initial Impact of the Crisis on Emerging Market Countries.” Brookings Papers on Economic Activity (Spring):263–323.
International Labour Organization. 2021. ILO Monitor: COVID-19 and the World of Work, 7th ed. (January 25).
International Monetary Fund. 2009. “Fiscal Implications fo the Global Economic and Financial Crisis.” IMF Staff Position Note (June 9).
Kasper, Matthew, Jesse Geibe, Christine Sears, et al. 2020. “An Outbreak of Covid-19 on an Aircraft Carrier.” New England Journal of Medicine, vol. 383 (November 11):2417–2426.
Moriarty, Leah, Mateusz Plucinski, Barbara Marston, et al. 2020. “Public Health Responses to COVID-19 Outbreaks on Cruise Ships Worldwide, February–March 2020.” Morbity and Mortality Weekly Report 69, no. 12 (March 27):347–352.
Mullen, Cormac, and John Ainger. 2020. “World’s Negative-Yielding Debt Pile Hits $18 Trillion Record.” Bloomberg.com (December 10).
OECD. 2020. “Turning Hope into Reality.” OECD Economic Outlook, Issue 2 (December).
Osipovich, Alexander. 2020. “Individual-Investor Boom Reshapes US Stock Market.” Wall Street Journal (August 31).
Sengupta, Amitava. 2020. “Impact Of COVID-19 on Global Supply Chains and Opportunities in the Post-COVID World.” Entrepreneur (14 April).
Yang, Wan, Sasikiran Kandula, and Mary Huynh et al. 2021. “Estimating the Infection-Fatality Risk of SARS-CoV-2 in New York City during the Spring 2020 Pandemic Wave: A Model-Based Analysis.” Lancet, vol. 21, no. 2 (February 1):203–212.
