
Tesla, the Largest-Cap Stock Ever to Enter S&P 500: A Buy Signal or a Bubble?
Tesla is entering the S&P 500 with a stupendously high valuation and will likely be ranked sixth in the index. Traditional cap-weighted indices, such as the S&P 500, are structured to buy high and sell low—and Tesla is a prime example of this maxim.
The eightfold increase in Tesla’s share price since its March low meets our two-part definition of a bubble: 1) implausible assumptions are needed to justify its valuation, and 2) buyer interest is based on a great narrative rather than being supported by a conventional valuation model.
Our research shows that a continuation of Tesla’s 2020 share-price performance is vulnerable on two additional fronts: 1) as a top-dog stock (top 10 market-cap stocks), the odds are against its remaining a top-dog stock, and 2) as an addition to the S&P 500, history indicates it is likely to underperform the market (S&P 500) in the year after entry.
Our research also demonstrates that Apartment Investment and Management, the stock removed from the S&P 500 to make way for Tesla, is likely to outperform the index over the next year by as much as 20%, based on the average outperformance of all deletions from the index in the 31-year period from October 1987 through December 2017.
On November 16, S&P Dow Jones Indices announced that Tesla will (finally) join the prestigious S&P 500 Index on December 21. From the beginning of 2020 to the announcement date, Tesla’s share price rose 400% from $83.67 to $408.09. Most of that run-up occurred after the media began speculating in March about Tesla’s likely addition to the index. From the announcement date through December 7, Tesla’s share price rose another 49% to $608.32. That’s an eightfold increase from its March low.
Given Tesla’s very large market-cap, the US Index Committee, which maintains the S&P 500, did consider a gradual transition into the index rather than adding the company’s full weight at one time. Currently about $11 trillion in assets track the index,1 and a substantial portion will seek to buy Tesla at the exact closing price on December 21. On December 1 the Index Committee announced that Tesla will be added all in one go, which prompted another 10% share-price increase the following week. The result is that founder Elon Musk now has the second-largest fortune in history. For now, only Jeff Bezos, founder of Amazon, is wealthier.
Tesla will be the largest stock to enter the S&P 500 in the history of the index, by both rank (likely the sixth largest company in the index2) and absolute market capitalization ($608 billion as of the December 7, 2020, market close).3 By the close of trading on December 21, index funds, ETFs, and other index-tracking strategies will have purchased Tesla shares valued at nearly $220 billion, most seeking to trade at the opening price.4 To make way for this purchase, these funds and strategies will sell a similar dollar amount from the other 505 stocks in the index (corporate actions have pushed the number of S&P 500 holdings to 505 names). At well under 1% of the outstanding market-cap of these companies, the requisite sales are not likely to precipitate major price moves.
Because Tesla’s addition to the index is not a secret, we can comfortably surmise that hedge fund managers and other liquidity suppliers have already stockpiled most of the $220 billion and are ready to supply the shares to the indexers for this largest single trade in history. What does it all mean for investors?
Tesla: The Bull Scenario
Tesla is a great company run by a great visionary. Elon Musk, its leader, has a long history of initiating multiple disruptive start-ups and driving them to success. PayPal, SpaceX, The Boring Company, Neuralink, OpenAI, and of course, Tesla are just a few of the companies Musk has played a key role in launching. Tesla, the electric vehicle and clean energy company, is a true pioneer in its space.
Tesla’s production and sales have grown at a spectacular pace. From 2016 to 2019, Tesla’s unit car sales grew an average of 61% a year. Tesla dominates the Electric Vehicle (EV) market, sometimes called the Fully Electric Vehicle market as a means to distinguish fully electric cars from hybrid cars. Extrapolating data from the first three quarters of 2020, we project Tesla will sell 425,000 cars this year, equal to 29% of market share of current global EV production.5 Even its automotive competitors admit Tesla has state-of-the-art technologies in battery design and EV production that competitors will not match for some time to come.
Several countries, including Denmark, Norway, and the United Kingdom, among others, plan to phase out internal combustion vehicles in the years ahead amid concerns around global warming caused by greenhouse gas emissions. Fleets of autonomous cars are coming reasonably soon and they will presumably all be electric. As a result, Tesla finds itself particularly well suited for the move toward a greener future. Tesla’s leading position and competitive advantage in the EV space—Elon Musk’s demonstrated ability to deliver on promises of past fast production growth—have all contributed to Tesla’s stupendous valuation.
But, But, But …
What else could we buy with $608 billion? Let’s consider the EV market. Renault-Nissan, Volkswagen, and Hyundai-Kia are the second, third, and fourth largest EV producers with 13%, 11%, and 8%, respectively, of EV market share.6 Combined, these three organizations are responsible for 32% of EV market share, about 10% larger than Tesla (and growing roughly as fast), but together are valued at $172 billion, barely one-fourth of Tesla’s value. Of course, these entities produce a lot more than just electric vehicles. The equivalent of Tesla’s current valuation can buy not only all of the electric vehicles these three organizations sell (actually 10% more than Tesla produces), but also about 27 million of the non-electric vehicles they sell each year, close to 60 times Tesla’s likely 2020 EV sales, with $436 billion to spare!
And what could we buy using the total $608 billion of Tesla’s market-cap? How about the “Nifty Nine,” the nine largest car manufacturers in the world—Toyota, Volkswagen, Renault-Nissan, General Motors, Hyundai-Kia, SAIC, Honda, Ford, and Fiat Chrysler?7 Yes, that’s right, and we would still have $15 billion left over, enough to buy around 300,000 Tesla cars for our closest friends and family. Advocates for Tesla will point out that in 1999 Amazon’s value exceeded that of all other book retailers in the world. Fair enough. But what is Tesla’s strategy for taking over vast swaths of other already profitable industries?
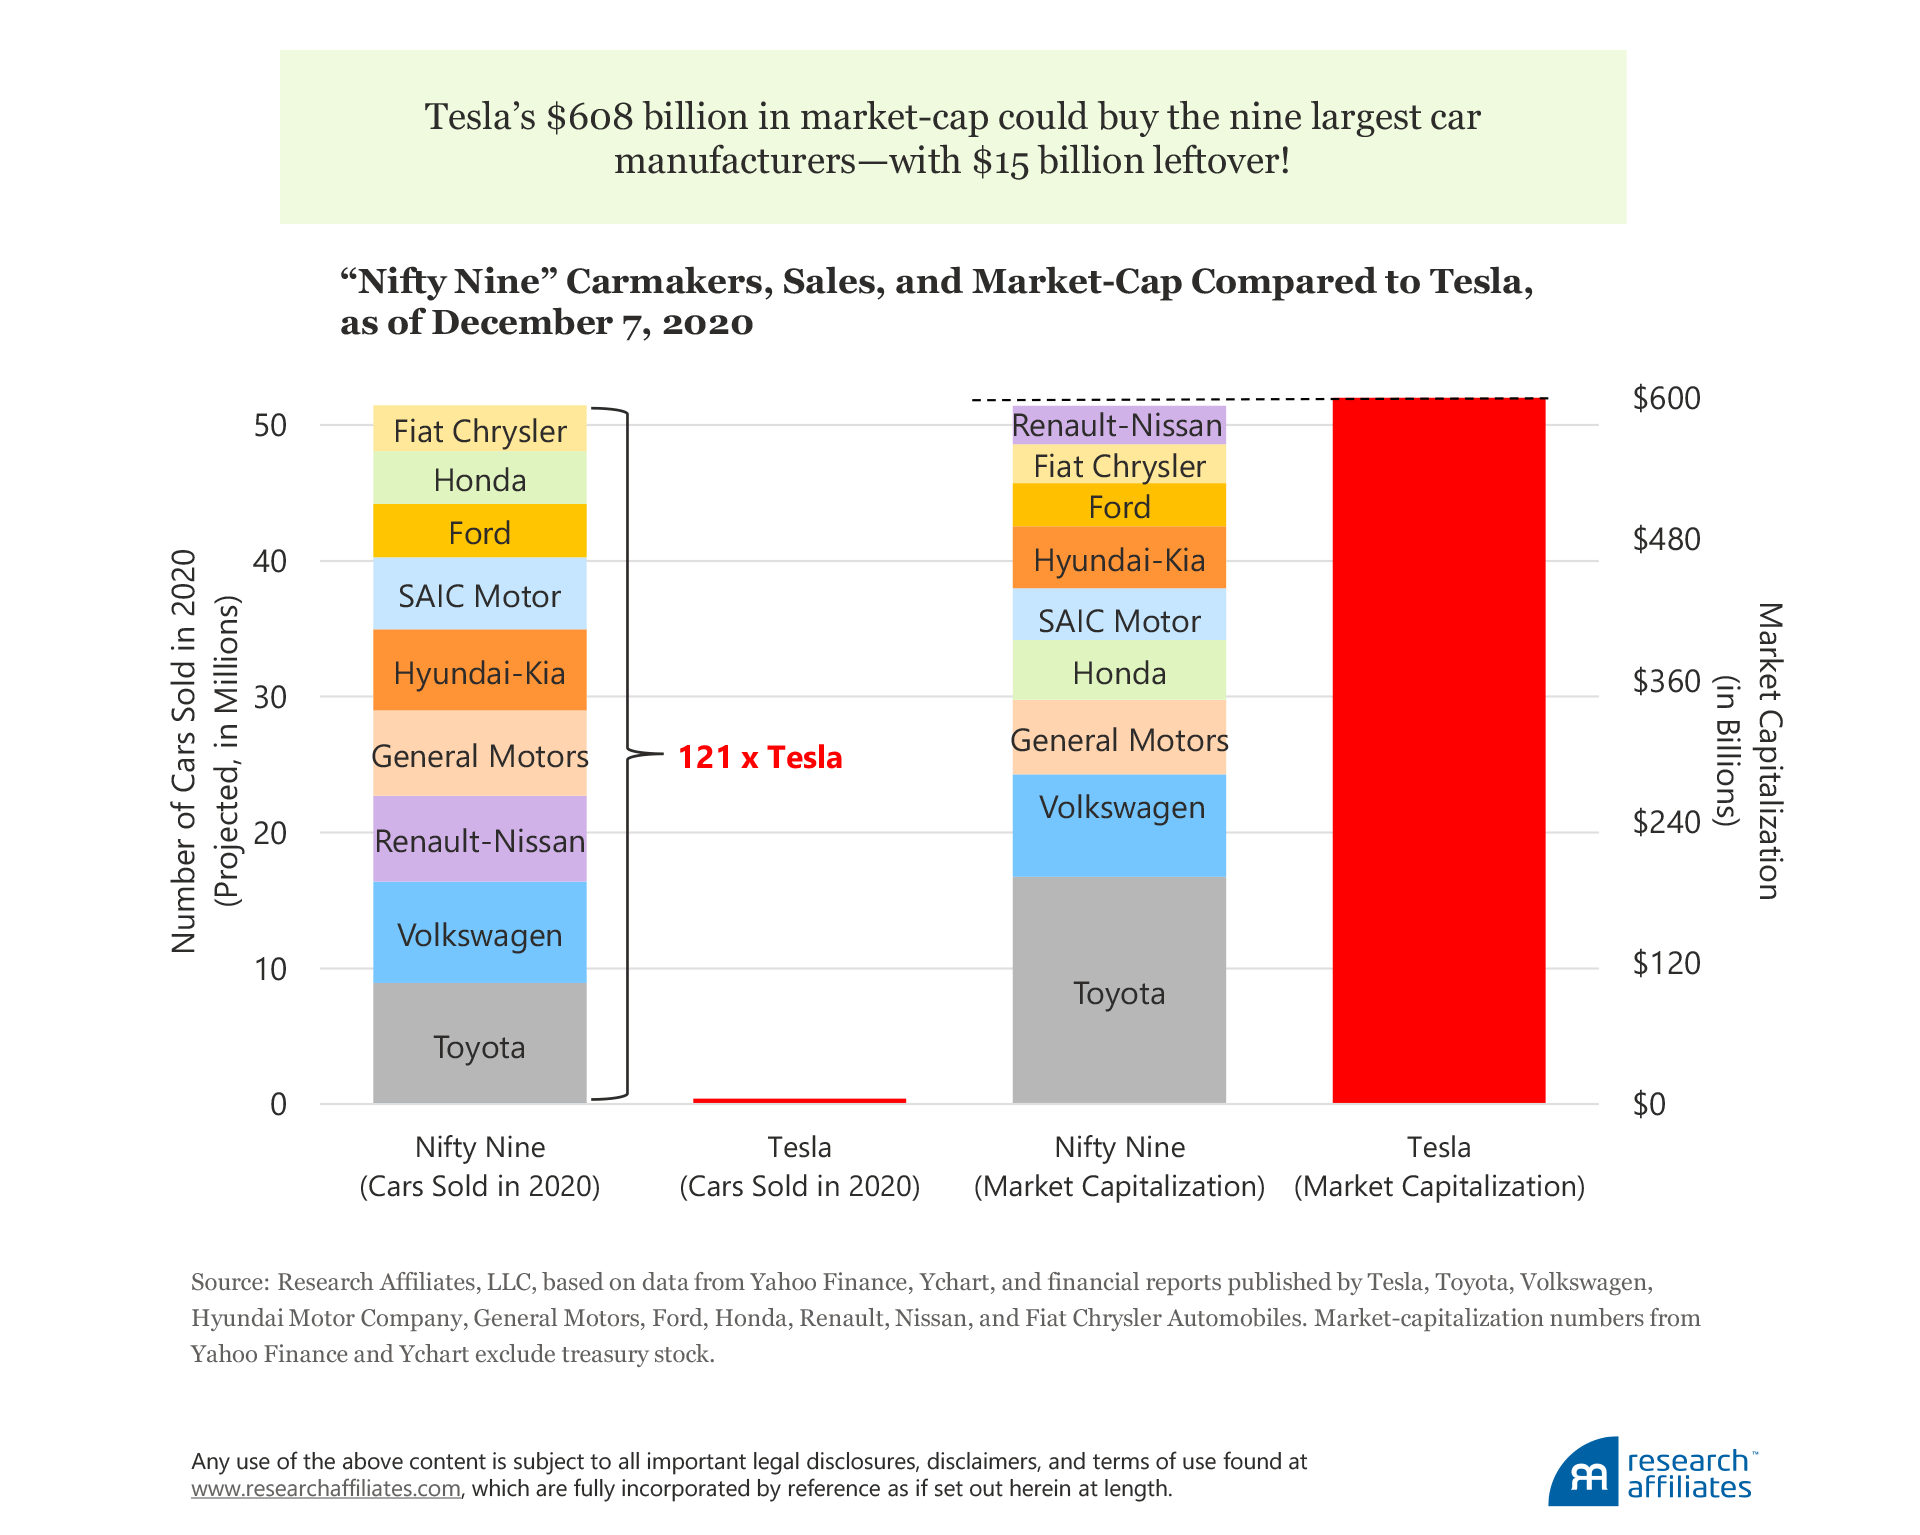
How do Tesla’s sales compare to sales of the other automakers? The Nifty Nine are slated to sell roughly 51 million vehicles in 2020, roughly two-thirds of global production, or about 121 times Tesla’s expected sales. The most generously priced major auto company, Toyota,8 is valued at about $19,000 per car based on the company’s current annual production rate, or a bit under $2,000 when we consider Toyota’s total production over the last decade. The valuations of other major automakers on a per car basis lag far behind Toyota’s per car valuation. Moreover, the 1-to-121 ratio of Tesla's to Nifty Nine's car sales is conservative. Global car sales are expected to suffer a 22% decline in 2020 relative to 2019 due to the COVID-19 pandemic (Wayland, 2020), but Tesla’s target market was much less sensitive to pandemic pressures that slowed demand. When we compare Tesla’s 2020 sales to the Nifty Nine’s 2019 sales—a sales level likely to resume after the pandemic eases—the ratio rises to 1 to 161!
By contrast, Tesla is worth about $1.4 million for every car the company is expected to produce this year and around $500,000 for every car the company has produced over its history. Tesla’s valuation, per dollar of revenue, per dollar of profit, or per car produced, is well over 100 times that of the Nifty Nine. This analysis of sales is, of course, based on past performance; Tesla’s high valuation reflects expectations of future high growth in sales and margins.
Tesla: The Bear Scenario
Tesla’s market capitalization is currently large enough to buy the automakers responsible for more than two-thirds of global car production. Following the discounted cash-flow model, what assumptions would we need to make to justify the valuations of Tesla and the rest of the automotive industry? Current valuations would require that Tesla sell 100 times as many cars as it now does, with the highest profit margin in the automotive industry. Does that seem plausible?
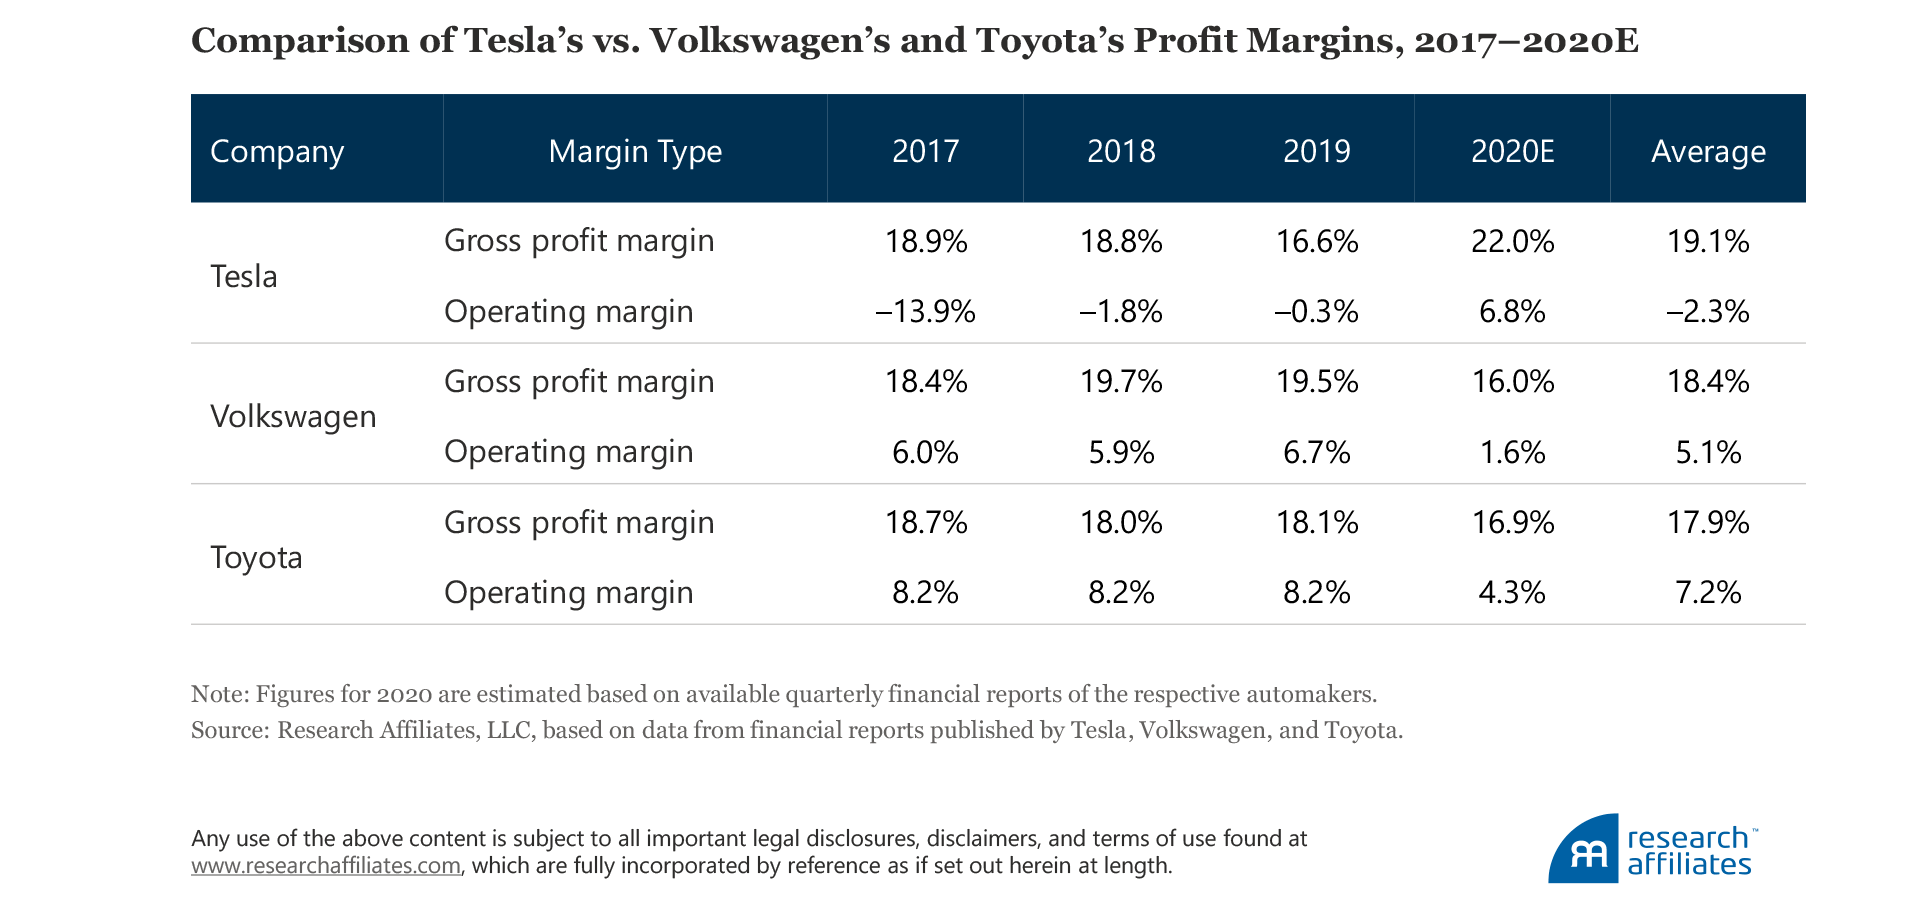
Tesla just turned profitable in 2020, which is good news for Tesla as a company because it no longer faces immediate threats of violating its loan covenants. At the same time, however, its gross margins are roughly on par with those of Toyota or Volkswagen—the industry leaders—and this is bad news for Tesla’s share price. In 2020, the year the COVID-19 pandemic swept the globe, Tesla’s net margins benefited from carbon credit sales far more than from auto sales. Can its net margin soar from current levels? That’s not as straightforward an analysis as extrapolating the recent trend.
In Arnott, Cornell, and Shepherd (2018), we proposed a two-part definition for a market or asset bubble that can be applied in real time, rather than just with 20/20 hindsight. The first part of our definition to confirm a bubble is that in using a discounted cash-flow or similar valuation model, we would need implausible assumptions to justify the market’s or asset’s current price. The second part of the definition is satisfied when a marginal buyer is not interested in conventional valuation models and is content to buy based on a narrative or story that foretells great future success (and price increases) for the market or asset. Based on our definition, Apple’s current lofty valuation doesn’t qualify as a bubble (on either count), but Tesla’s does.9
What assumptions would justify Tesla’s current valuation? Suppose Tesla sales grow by 50% a year over the next 10 years. That means its sales would need to increase 58 times over anticipated 2020 sales.10 The company’s current margin is not high enough to justify the 100 times multiplier over the rest of the industry. Suppose that in 2030 Tesla has a 10% net margin, higher than any existing auto company and 47% higher than its most recent 6.8% net margin. Nope, still not good enough. A 10% net margin would make Tesla “only” 85 times larger than it is today, not 121 times larger. Such high growth persisting over a full decade is implausible. Amazon’s growth rate over the last 3, 5, and 10 years has been in the high 20s, nowhere near 50% a year. Tesla’s own three-year revenue growth rate is 33% (the revenue growth was far slower than the 61% unit car sales growth), so 50%—for a full decade—is a major acceleration over its stupendous recent growth. Our analysis examines terminal value only. In order to justify Tesla’s current valuation, the assumptions about its sales and margin growth need to be even more aggressive.
Bubbles almost always burst. But, as we observed in 2018, shorting a bubble stock is very dangerous. Bubbles can last longer and carry valuations higher than we investors could possibly imagine and can outlast our capital.
The Electric Vehicle Industry
Many limitations hinder the growth of the EV market. An international survey conducted by Deloitte (Hamilton et al., 2020) identified four challenges for EV adoption: driving range, time to charge, lack of charging infrastructure, and high cost. These challenges are ongoing and likely to curtail Tesla’s growth. Despite these challenges Tesla has grown very fast as has the EV production of its competitors. But can these growth rates continue?
The largest car manufacturers have these electrification plans in place:
- Toyota is targeting cumulative sales of 5.5 million fully electric vehicles by 2025 with sales of 0.5 million in that year alone. In 2020 Toyota entered a joint venture with BYD, a Chinese manufacturer of electric vehicles and the second-largest producer of lithium-ion batteries in the world. The purpose of the joint venture has the dual purpose of solidifying Toyota’s place in the pure EV space and of accessing the fast-growing Chinese market.
- Hyundai group plans to invest $87 billion in the electrification of its vehicles by 2025 and expand the range of its EV models to 44 over the same period. In June 2020 it entered a partnership with LG, the world’s largest battery producer, to collaborate on EV batteries.
- Volkswagen (VW) plans to invest €33 billion in electric vehicles by 2023 with the goal of 1 million in EV sales through 2023. The VW group expects to have 70 new electric models by 2028 and is targeting 40% of its global sales to be in electric vehicles by 2030.
- Ford plans to invest $11.5 billion in EV research, development, and production by 2022 to meet its goal of having 40 EV models in its global portfolio by that date.
- General Motors is currently on track to meet its 20 EV-model range by 2023 and plans for all Cadillac vehicles to be electric by 2030.
- Renault-Nissan group plans to have 8 EV models by 2022 and expects 42% of the group’s total vehicles sold in Europe will be electric by 2022.
The full list of manufacturers’ plans is quite extensive, because most leading car manufacturers have very serious plans for the electrification of car production. These plans will be aided through governmental support of the many nations these companies represent. For example, the government of Japan is earmarking about $19.2 billion to support decarbonization technologies in Japan to be spent on developing national infrastructure and research and development. One area of research these funds will likely target is the development of solid-state batteries, a technology with higher energy density, faster charging time, and lower risk of fire compared to the standard lithium-ion technology. Recently Toyota revealed its serious progress in solid-state battery technology, which allows a 500-kilometer range with 10-minute charging time and few safety concerns. Toyota plans to launch a prototype of the vehicle in 2021 and to begin production relatively soon thereafter.11
Tesla will not remain unchallenged as the EV industry leader for long. Tesla—a disruptor—has shaken up the industry, but as yet is showing no signs of driving out any of the existing players. Strong competition has ensured that car manufacturers have become very skilled in areas such as branding for specific market niches, understanding consumer psychology, providing customer financing, and servicing vehicles. The financial footprint of the car manufacturing industry is huge, having a global reach and strategic importance to many national economies. This translates into strong lobbying and other forms of government support that provide existing car manufacturers numerous competitive and business advantages.
Finally, might we have global overinvestment in electric vehicles? The impediments to EV adoption, such as a lack of charging infrastructure, are not going to be resolved any time soon. Demand, therefore, may not keep pace with soaring supply, which would be bad news for Tesla’s sales and margins because the company’s book of business is not particularly well diversified.
S&P 500 Buying Party … Tesla Boom or Hangover?
How will Tesla’s addition to the S&P 500 impact TSLA's price performance? As of June 30, 2020, $4.6 trillion assets were tracking the S&P 500 directly and an additional $6.6 trillion were benchmarked to it. Indexers often claim their trading does not move share prices. So, if Tesla shares are bought at 9:30:00 am (EST), and the price is no different from the price at 9:30:01 or the last after-hours trade before 9:30 am, should we believe that the index funds did not move the price? Based on this highly deceptive scenario, the trade would not appear to have an impact. But prior to the trade, hedge funds and other liquidity providers had pushed up the share price—by 700% since the March lows—accumulating the shares they needed to offer the indexers on December 21.
The correct measure of the indexers’ impact is a company’s share-price rise in the days following the announcement date that it will be added to the index until the effective date when the stock enters the index. Our earlier research (Arnott, Kalesnik, and Wu, 2018), covering the period from October 1987 through December 2017, demonstrated that in the few days between announcement date and effective date, the stock to be added beats the S&P 500 by roughly 1,000 basis points on average. Much of the share-price increase is likely driven by the buying pressure from hedge funds and other investors who are buying the stock ahead of S&P 500 indexers.
In our 2018 study, we found the S&P 500 additions, on average, win big before they are added and discretionary deletions lose big before they are dropped. The average addition to the index typically rises 43% relative to the market (S&P 500) in the 12 months prior to the close of the rebalancing day. If the addition is a mega-cap (ranking in the top 100 or higher by market capitalization), the average gain is 127%. Conversely, the average deletion loses 31% over the same time span.
Traditional capitalization-weighted indices routinely add companies with share prices at high market valuations—unloved companies simply do not garner the attention of the index committee. In contrast, the shares of companies the index sells to make way for newcomers usually trade at a deep discount. On average, the valuation spread between the two—based on a blend of price-to-book, price-to-earnings, and price-to-sales ratios—is roughly threefold: additions trade at a 200% valuation premium to the dropped stocks. (Hence, we titled our 2018 article “Buy High and Sell Low with Index Funds!”)
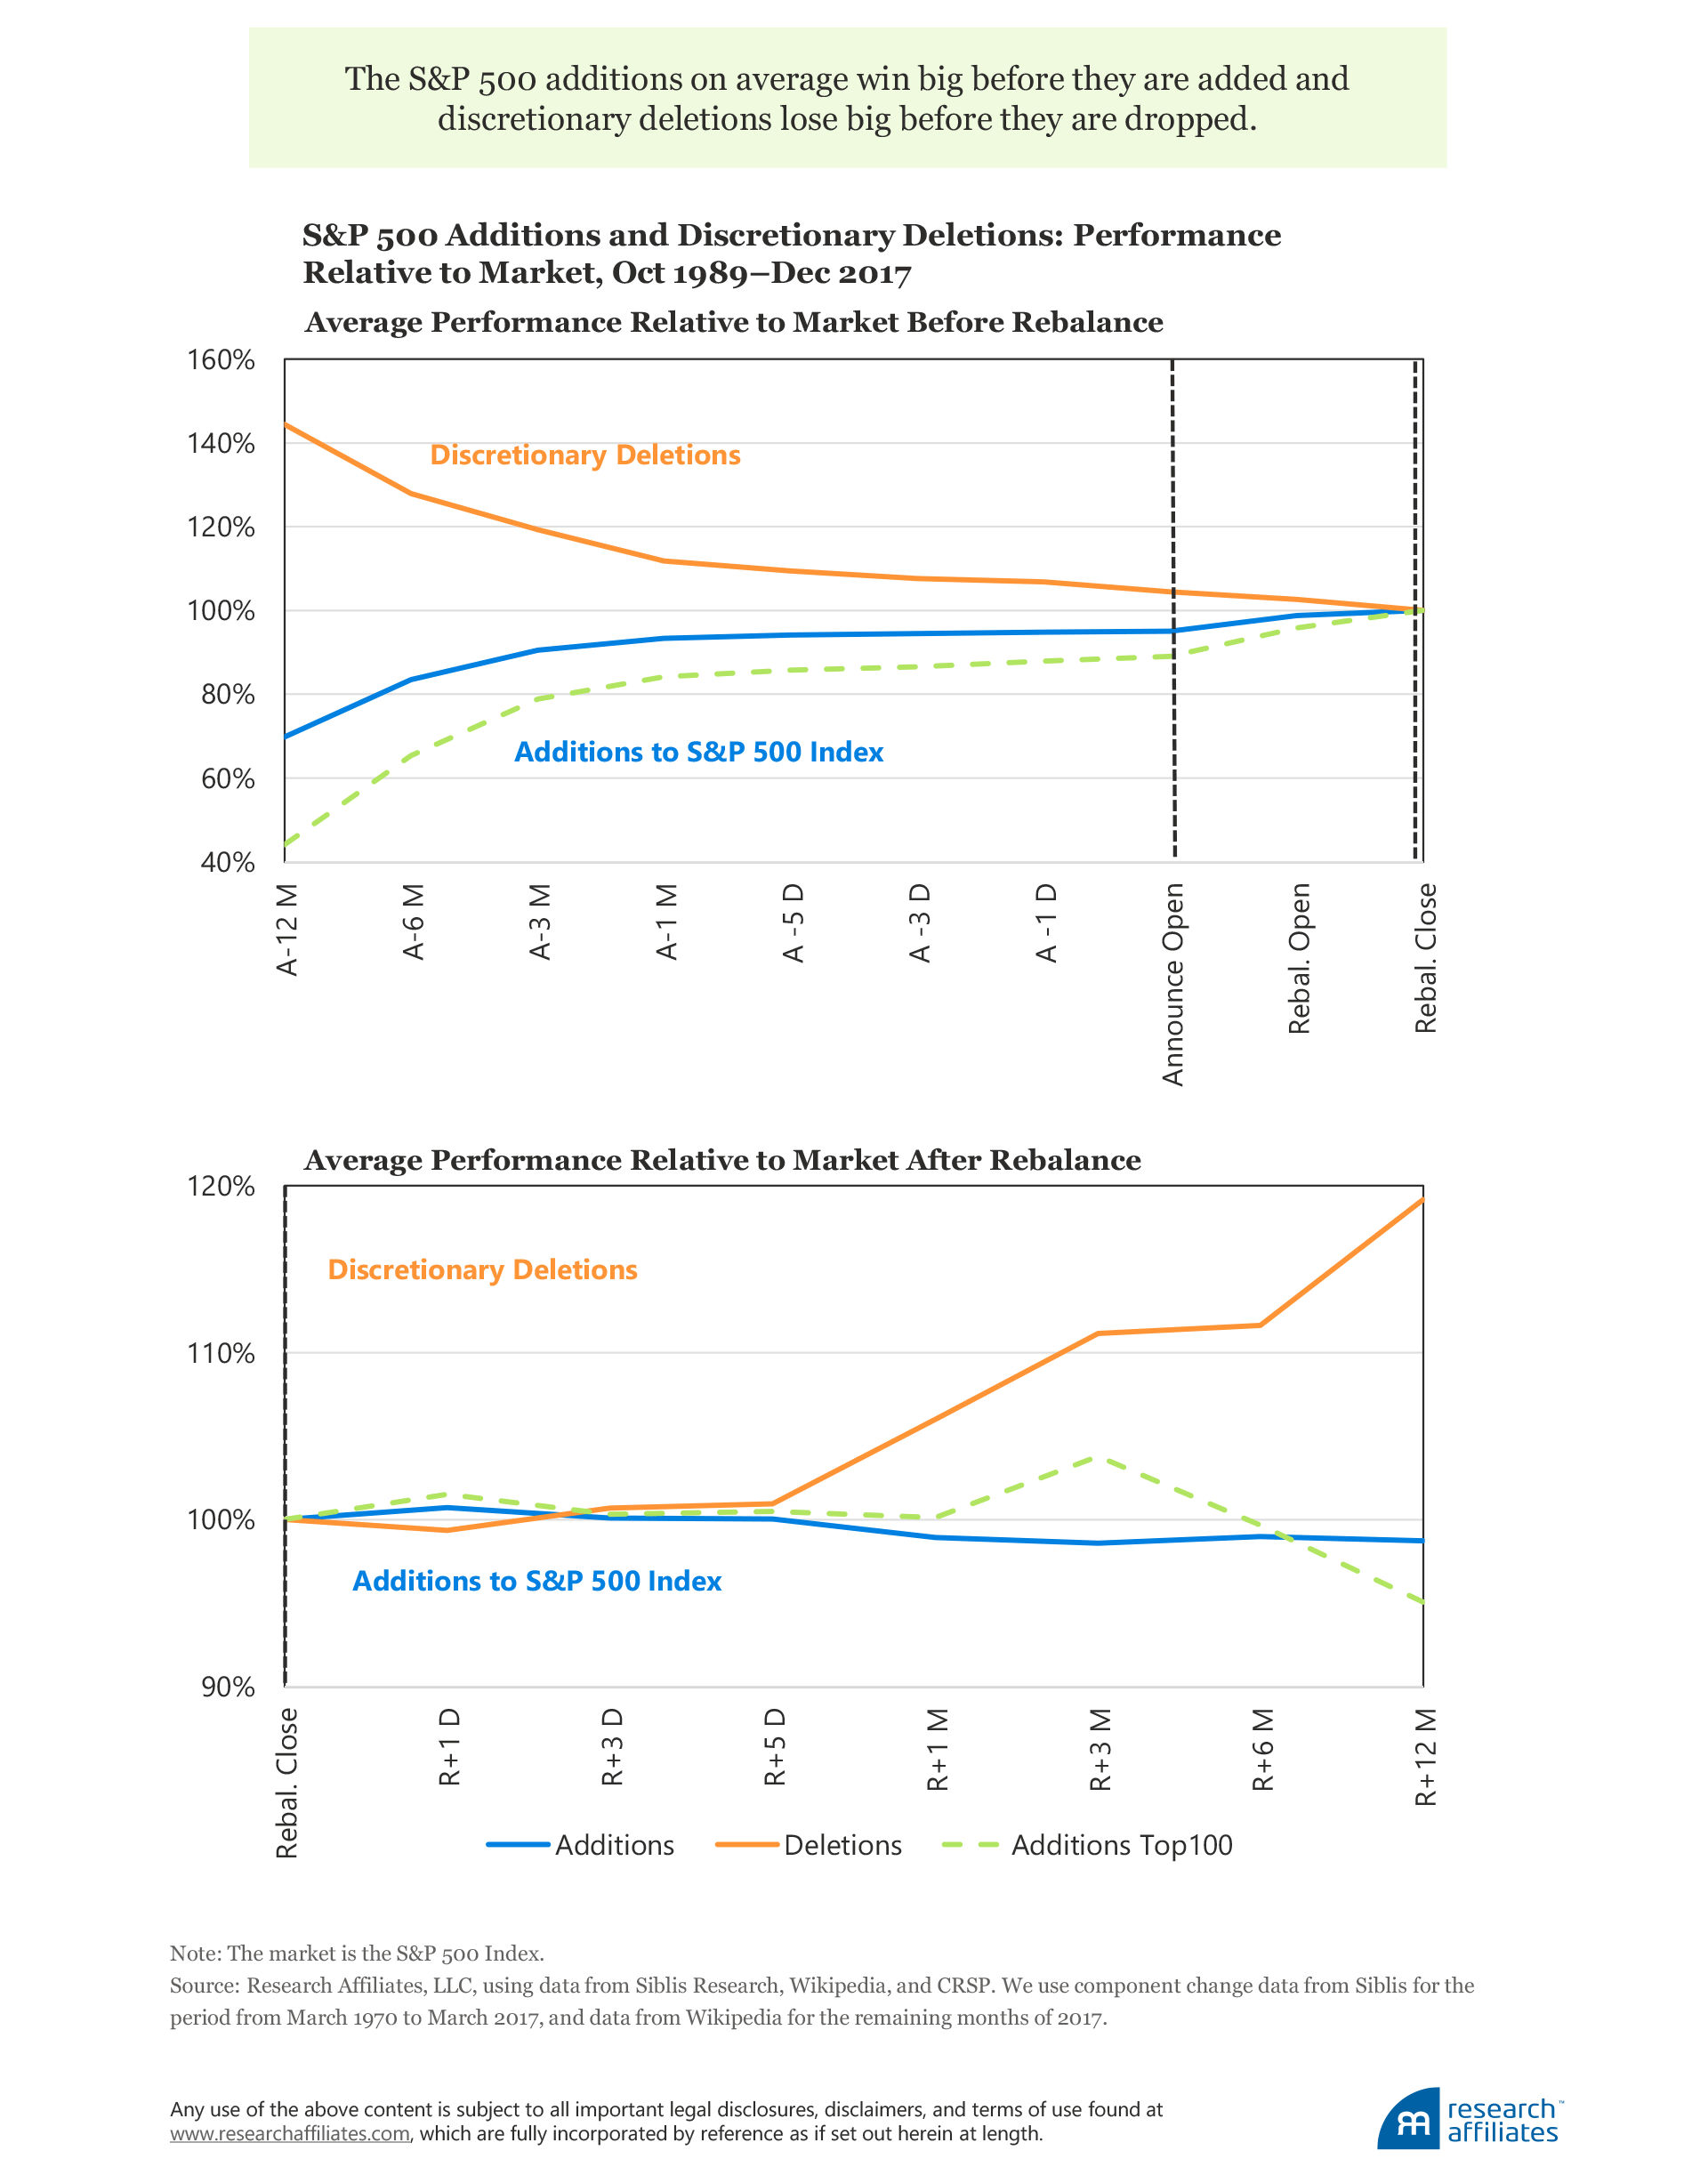
The pattern reverses in the year after an index change. The average addition rises an additional 1% relative to the market on the day after it is added to the index, then loses about 2% relative to the market over the following year. If the addition is a mega-cap, there is a 2% follow-through share-price rise the day after the effective date, followed by a drop of 7% over the next year (Arnott, Kalesnik, and Wu, 2018).
Our research further shows that the average deletion drops 1% more the day after its removal from the index, then beats the market by an average of 20% over the next year. The S&P 500 is designed to buy high and sell low, which results in a performance gap of 24% between additions of mega-cap stocks and discretionary deletions from the day after the change is made until 12 months later.On December 11, 10 days ahead of the index rebalance date (December 21) on which Tesla is scheduled to enter the S&P 500, the S&P index committee announced it is dropping Apartment Investment and Management (Aimco) (NYSE:AIV) to free up space for Tesla. AIV’s price has dropped 36%, lagging the market by 52%, in the 12 months before the announcement of its removal from the S&P 500. This price decrease is likely a key reason the S&P index committee decided to drop it.
AIV’s price fell further, by more than 4%, in the after-market trading session following the December 11 announcement it would be removed from the index. Both Tesla and Aimco followed the familiar pattern: Tesla’s share price surged, while Aimco's share price plummeted before the index adjustment date. If history is a guide, the prospects for each of these stocks may substantially reverse over the next year, with Tesla underperforming and Aimco recovering nicely.
Our 2018 research showed that the performance gap between index additions and deletions is stronger for the additions with the largest capitalization. But Tesla is not just a mega-cap company—after the S&P decision on November 16, it ranked sixth among all US public companies in terms of capitalization. Previously, the number six position in the S&P 500 was held by Berkshire Hathaway, a company with 7 times Tesla’s last quarterly revenue (third quarter 2020) and 91 times Tesla’s last quarterly net income.
Tesla’s size raises another point of concern: typically, only 2 to 3 of the top 10 stocks ranked by global market-cap remain in that list 10 years later (Arnott, Kalesnik, and Wu, 2018). Importantly, the 7 or 8 companies that drop off the top 10 list over the following decade all underperform the newcomers to the list 10 years later. Contributing drivers to the aging and fading top dogs’ decline are 1) more directed competition after becoming a top dog; 2) greater regulation seeking to extract revenues from perceived cash cows and seeking control over perceived predatory practices; and 3) the likely overvaluation that drove these companies to top-dog status in the first place. The top-dog status of Tesla further tilts the odds of price underperformance, and not in Tesla’s favor.
Conclusion
Tesla is an impressive company in an influential and fast-growing market segment. The company has unique brand and technological advantages in the electric vehicle space. Yet it is far from the only player in the EV industry—existing automakers already produce more than twice as many electric vehicles as Tesla and have plans to invest many tens of billions of dollars in electrification. Nevertheless, Tesla is likely to remain a leader, perhaps the leader, in this space, if the company is not disrupted by an innovative newcomer.12
The top nine automakers, whose combined market-cap equals that of Tesla, produce 121 times as many cars as Tesla. Tesla, however, is priced at a valuation larger than these Nifty Nine, who produce just over 70% of the global automotive, truck, and motorcycle industry. Tesla’s skyhigh valuation helps the company by providing cheap capital for new investment and a cash buffer to ward off creditors. It also serves as a convenient ATM for Elon Musk should he need a billion or two to fund his next futuristic project.
A partial driver of Tesla’s eightfold increase in price since its most recent March low was the crowd of COVID-19 locked-down gamblers who, having to forego Las Vegas or Monte Carlo, turned their attention to hot stocks instead. Tesla’s valuation was arguably further boosted through much of 2020 by its pending inclusion in the S&P 500 Index. Given all the classical signs of a bubble in Tesla’s stock, and the evidence of 31 years of S&P additions and deletions, December 21–22 likely marks the beginning of a reversal in Tesla’s share price. Similarly, Apartment Investment and Management, the company that Tesla replaces in the index, is apt to enjoy its own reversal of fortune as its share price rises over the next year. Investors guided by history may wish to take advantage of this opportunity to buy low and sell high!
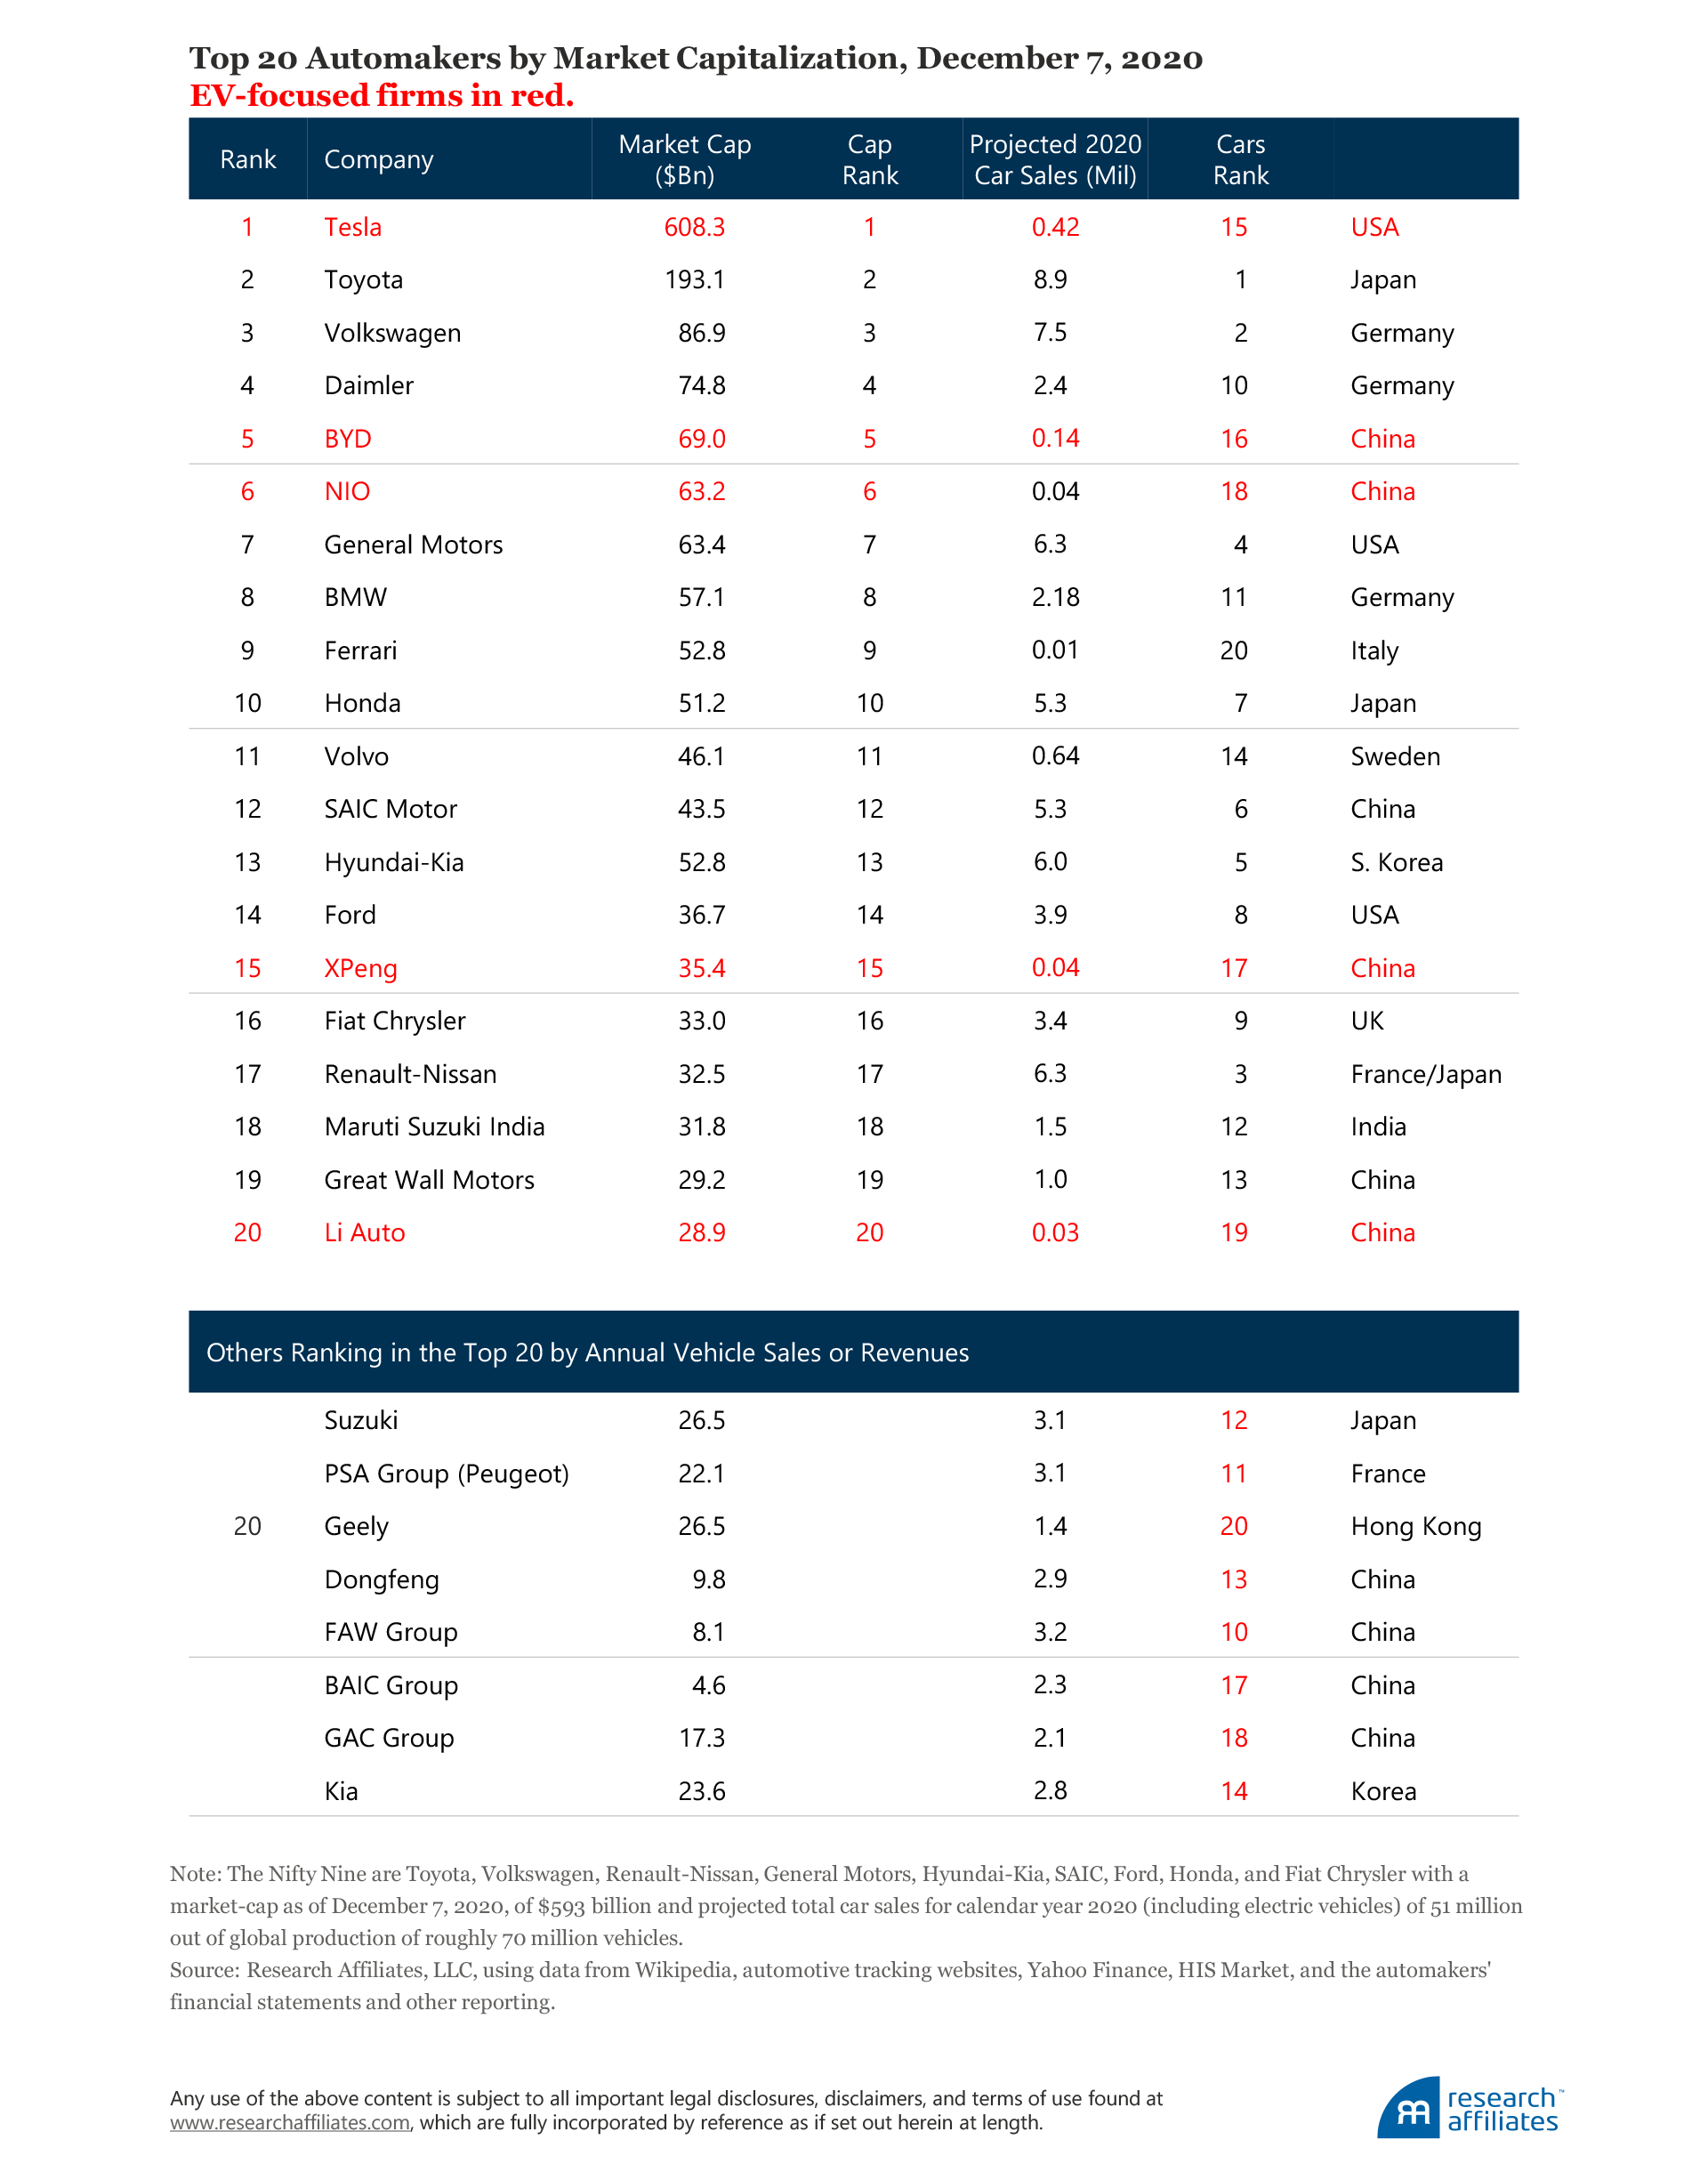
Appendix: Summary of Top 20 Automakers by Market Cap, Car Sales, and Revenues
Please read our disclosures concurrent with this publication: https://www.researchaffiliates.com/legal/disclosures#investment-adviser-disclosure-and-disclaimers.

Endnotes
- Source: https://www.spglobal.com/spdji/en/indices/equity/sp-500/#overview.
- Alphabet Inc. has two share classes (A, ranked 5, and C, ranked 6) in the S&P 500 with a combined market capitalization of $1.23 trillion as of December 7, 2020. We count Alphabet’s two share classes as a single company.
- Until Tesla, the largest addition to the S&P 500 was Microsoft in 1994. It ranked 13 when it entered the index.
- The current market-cap of the S&P 500 is approximately $30 trillion. Tesla’s current market capitalization of $608 billion represents about a 2% weight in the index. The purchase amount of $220 billion is calculated as a 2% weight multiplied by $11 trillion in total assets that track the S&P 500 Index.
- According to the Korean Automobile Manufacturers Association (PulseNews.co.kr, 2020) and Tesla’s audited financial statements. In the US EV market, Tesla has maintained about an 80% market share during the first half of 2020, according to data by Buy Shares (Lambert, 2020).
- According to the Korean Automobile Manufacturers Association (PulseNews.co.kr, 2020) and other sources.
- Renault and Nissan trade as separate companies although they belong to the same corporate group. Hundai-Kia and Fiat Chrysler trade as one company. In total, the Nifty Nine encompass nine groups, 10 companies, and well over 20 brands.
- Toyota has been the dominant pioneer in hybrid technology, releasing the Prius in 1997. Since that time, Toyota has sold 15 million hybrid vehicles, more than 10 times as much as Tesla’s cumulative car production since its inception. Much of Toyota’s extensive experience in electrified power trains is transferable to purely electric vehicles.
- Apple’s current weight based on its economic footprint (the average of four economic measures: five-year average of sales, cash flows, and dividends, as well as the most recent book value) is 4%, whereas its weight based on market capitalization is 5.7% among the top 1,000 US stocks.
- It is standard in a discounted cash-flow analysis when computing the discounted cash-flow value for rapidly growing companies to assume a company grows at an accelerated rate for a number of years and then reverts to the average industry growth rate. The reversion to the average growth rate is a necessary assumption to avoid the numbers growing unrealistically to infinity due to exponential growth rates. In this case we assume Tesla grows at an accelerated rate for 10 years, a very aggressive assumption given industry experience. If the period of accelerated growth begins in 2021 and ends in 2030, by 2030 Tesla’s sales will be 58 (=1.5^10) times larger than the 2020 level.
- According to a Nikkei Asia.com (2020).
- Disruptors are frequently disrupted. Recall that in mid-2000, 3Com spun off Palm at a valuation that briefly exceeded the value of General Motors. Palm was disrupting business communications with its Palm Pilot. Within 2 to 3 years, Blackberry was disrupting Palm. When the iPhone was introduced in 2008, it largely supplanted Blackberry.
References
Arnott, Rob, Bradford Cornell, and Shane Shepherd. 2018. “Yes. It’s a Bubble. So What?” Research Affiliates Publications (April).
Arnott, Rob, Vitali Kalesnik, and Lillian Wu. 2018. “Buy High and Sell Low with Index Funds!” Research Affiliates Publications (June).
Hamilton, Jamie, Bryn Walton, James Ringrow, Geneviève Alberts, Saskia Fullerton-Smith, and Edward Day. 2020. Electric Vehicles: Setting a Course for 2030. Deloitte Insights, Deloitte University EMEA CVBA: Berkenlaan, Belgium.
Lambert, Fred. 2020. “Tesla Holds 80% of US EV Market Despite Losing Federal Tax Credit.” Electrek.co (August 21).
Wayland, Michael. 2020. “Led by US, Global Auto Sales Expected to Plummet 22% in 2020 Due to Coronavirus.” CNBC.com (April 21).
