
We recommend using a composite of ratios when valuing a firm because no perfect measure of value exists. Doing so reduces the impact of each measure’s inherent shortcomings when the ratio is used in isolation.
Book value is an incomplete measure of a firm’s assets. Given the growing importance and increasing share of intangible capital in total company capital, adding measures of intangibles provides a more complete measure of firm capital.
Including intangibles when estimating a firm’s value has a greater impact on smaller companies. Mega-cap growth stocks, notably, the FANGs, still look expensive after incorporating intangibles in the value of firm capital.
We believe that when evaluating a company, relying on a single metric or ratio may not be prudent. We have shown that a combination of risk-based and reversal metrics can improve the returns of a momentum strategy (Arnott et al., 2017). We have further shown that the variations in definitions of “quality” result in vastly different portfolios and returns (Hsu, Kalesnik, and Kose, 2019). A combination of measures of a firm’s distress level, profitability, accounting practices, and spending level provides a more complete picture of the financial health of a company than any one measure on its own. Similarly, relying on a single measure of value may not be prudent.
Prospective buyers do not rely solely on price-to-bedroom ratio when assessing a home’s price. They consider location, lot size, square footage, number of bathrooms, local schools, and so on, because no single measure provides the complete picture. As investors, we also need to look beyond the standard book-to-market (B/M) ratio academic definition of value—reciprocally, the price-to-book-value (P/B) ratio—when assessing a company’s valuation.
Each commonly used ratio is an imperfect and incomplete measure. The price-to-sales ratio favors low-margin businesses. The price-to-cash-flow ratio and price-to-earnings ratio favor cyclical firms at their peak prices. Dividend yield excludes firms that do not pay dividends. And importantly, P/B fails to recognize the value of intangibles. Given the growing importance and increasing scale of intangible capital in many businesses, expanding P/B to include intangibles captures a more complete measure of firm capital (Arnott et al., 2020). In turn, a more complete measure of firm capital creates a more comprehensive measure of a firm’s assets when included in a composite of multiple fundamentals.
A composite approach that includes multiple measurements is an effective means of capturing the economic scale of a company. In addition to the composite’s help in painting a robust picture of company size, broad components within the composite help fill in the picture’s details. For example, we have no reason to believe that weighting companies by a combination of dividends and net buybacks will result in higher excess returns than rebalancing companies to weights incorporating dividends alone. Nevertheless, we prefer the combination of the two variables, because their sum provides a more complete picture of a firm’s distributions to shareholders than does either item individually. Similarly, if we want to capture the complete picture of a firm’s assets, why would we include office chairs, which are reflected in book value, but not the investment in R&D that book value skips?
Our use of multiple measures is driven by a desire to diversify, not a pursuit of the highest return in a backtest. Novy-Marx (2016) notes that use of a composite signal could lead to overfitting. We agree. We could easily optimize the weight of each variable based on past returns, but instead we opt for a simple equal weighting of inputs such as sales, cash flow, dividends, and book value to avoid the overfitting Novy-Marx highlights. (We also note that reliance on a single metric could be interpreted as the ultimate form of overfitting. After all, what is more optimized than a portfolio 100% dependent on the variable that has performed best in the past?)
The Growing Importance of Intangibles
As intangible assets such as knowledge, intellectual property, and human capital become more important to firms’ successes, intangibles’ share of total company capital has grown meaningfully. In 1963, the average firm’s intangible assets were roughly 24% of the size of its book value of tangible assets. The relative size of intangibles has since more than tripled to represent 77% of the average firm’s tangible book value (Arnott et al., 2020).
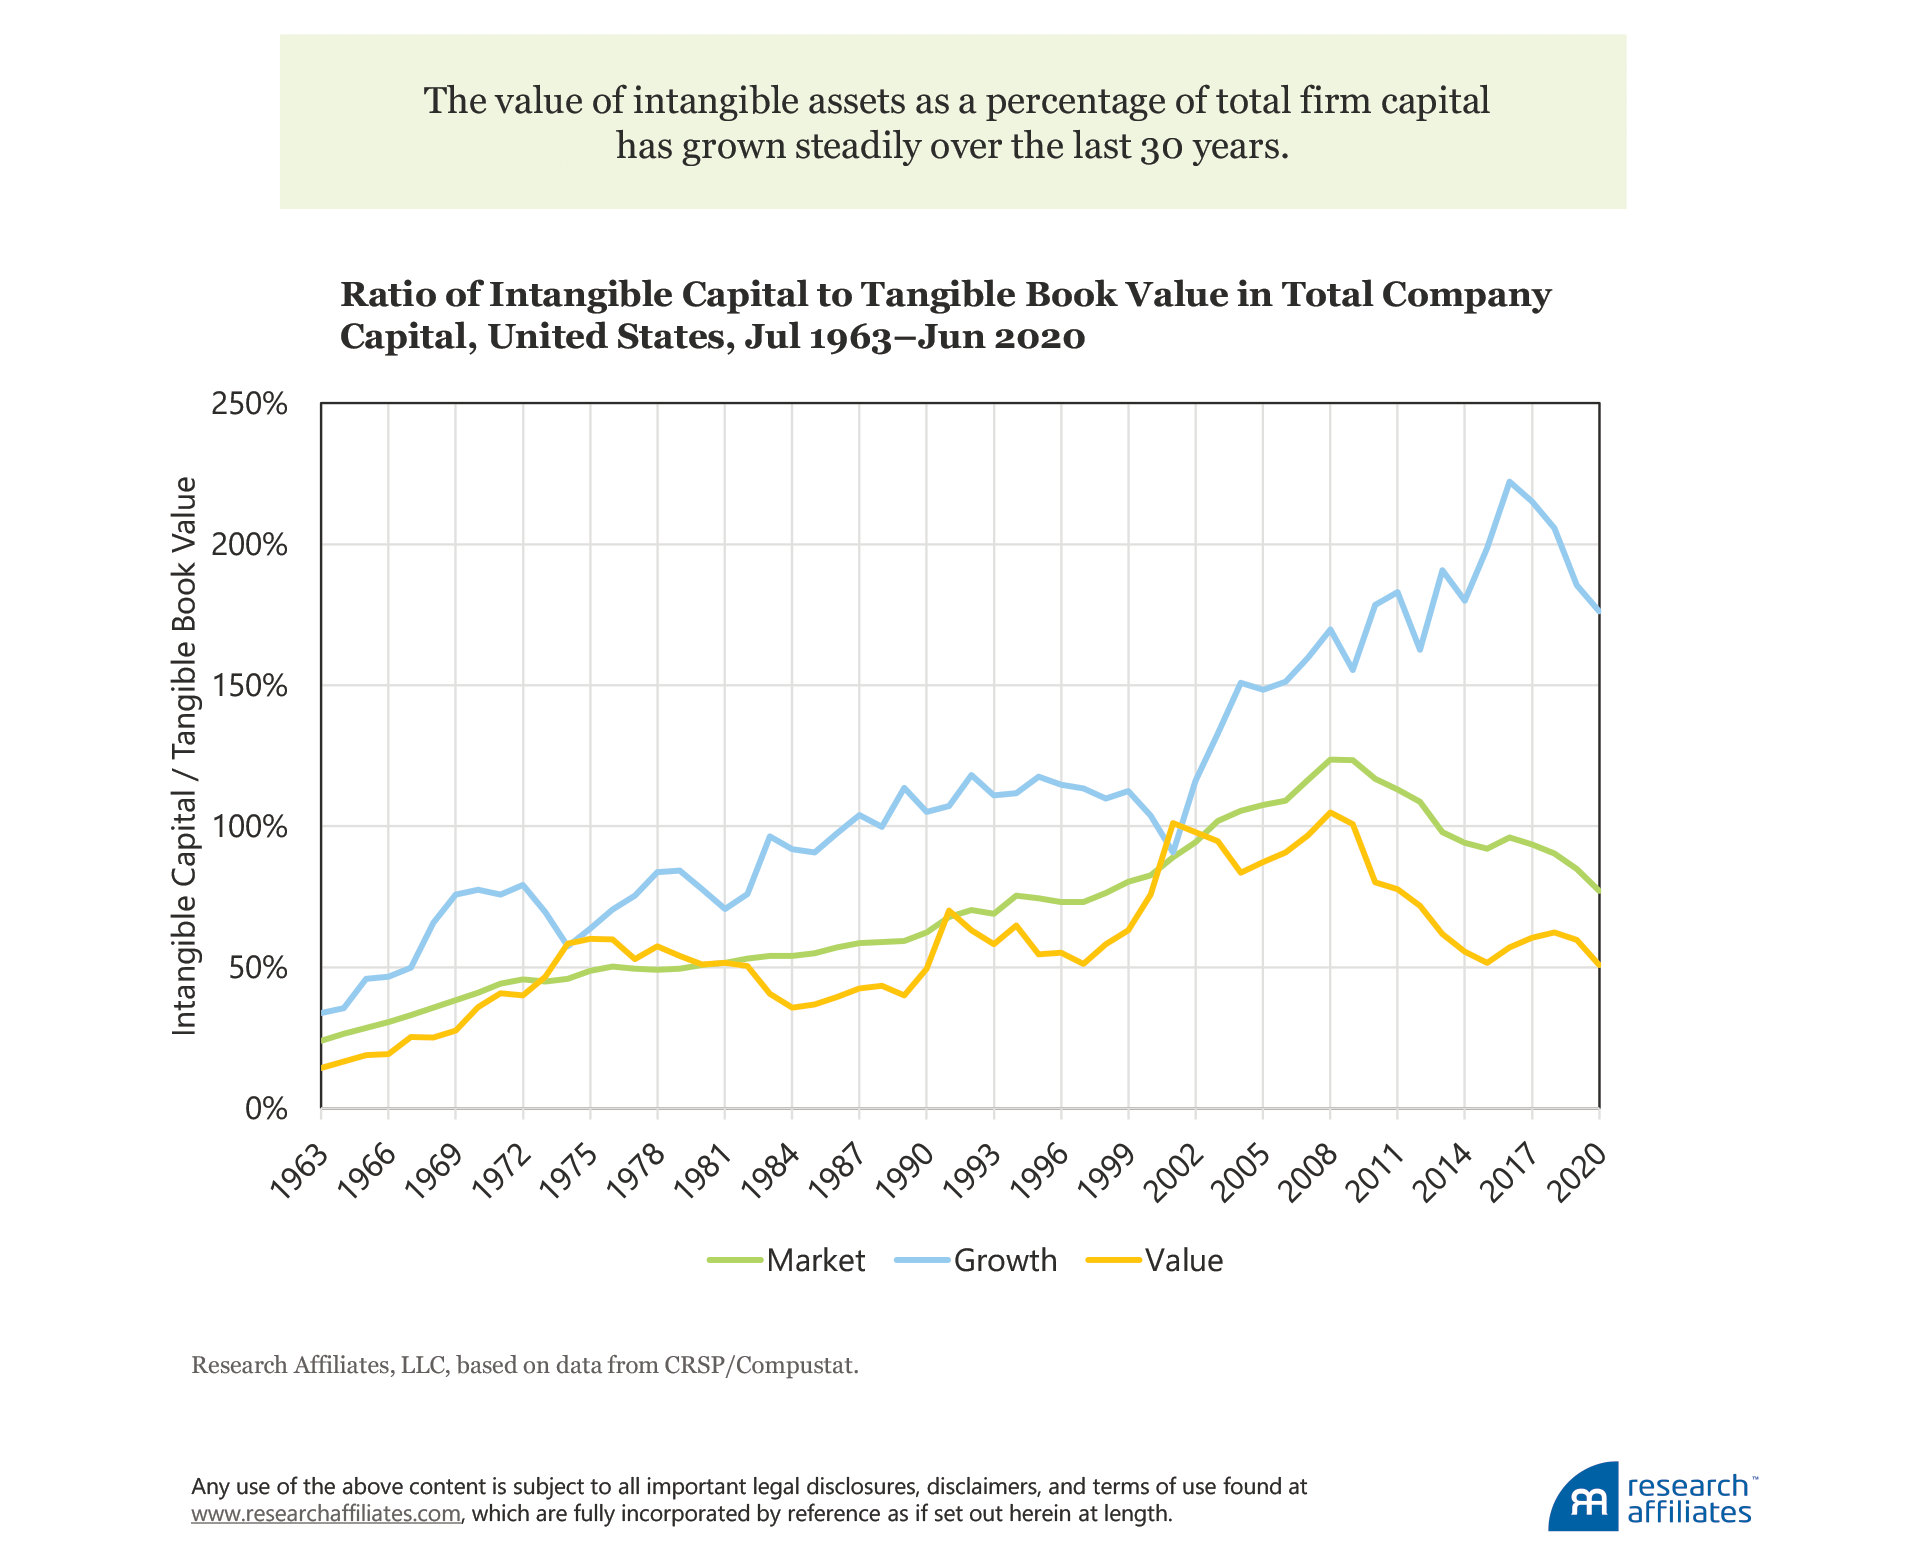
The steady and significant increase in the size and role of intangibles makes including them necessary in a truly comprehensive measure of a firm’s capital. Further, the growth in intangibles would suggest that certain industries, such as biopharma and software development, may be much more capital intensive than the tangible book value on their balance sheets would suggest.
We rank US companies by the absolute difference between their research and development (R&D) spending and their book value. The top 10 list includes seven technology and technology-related firms and three drug companies.
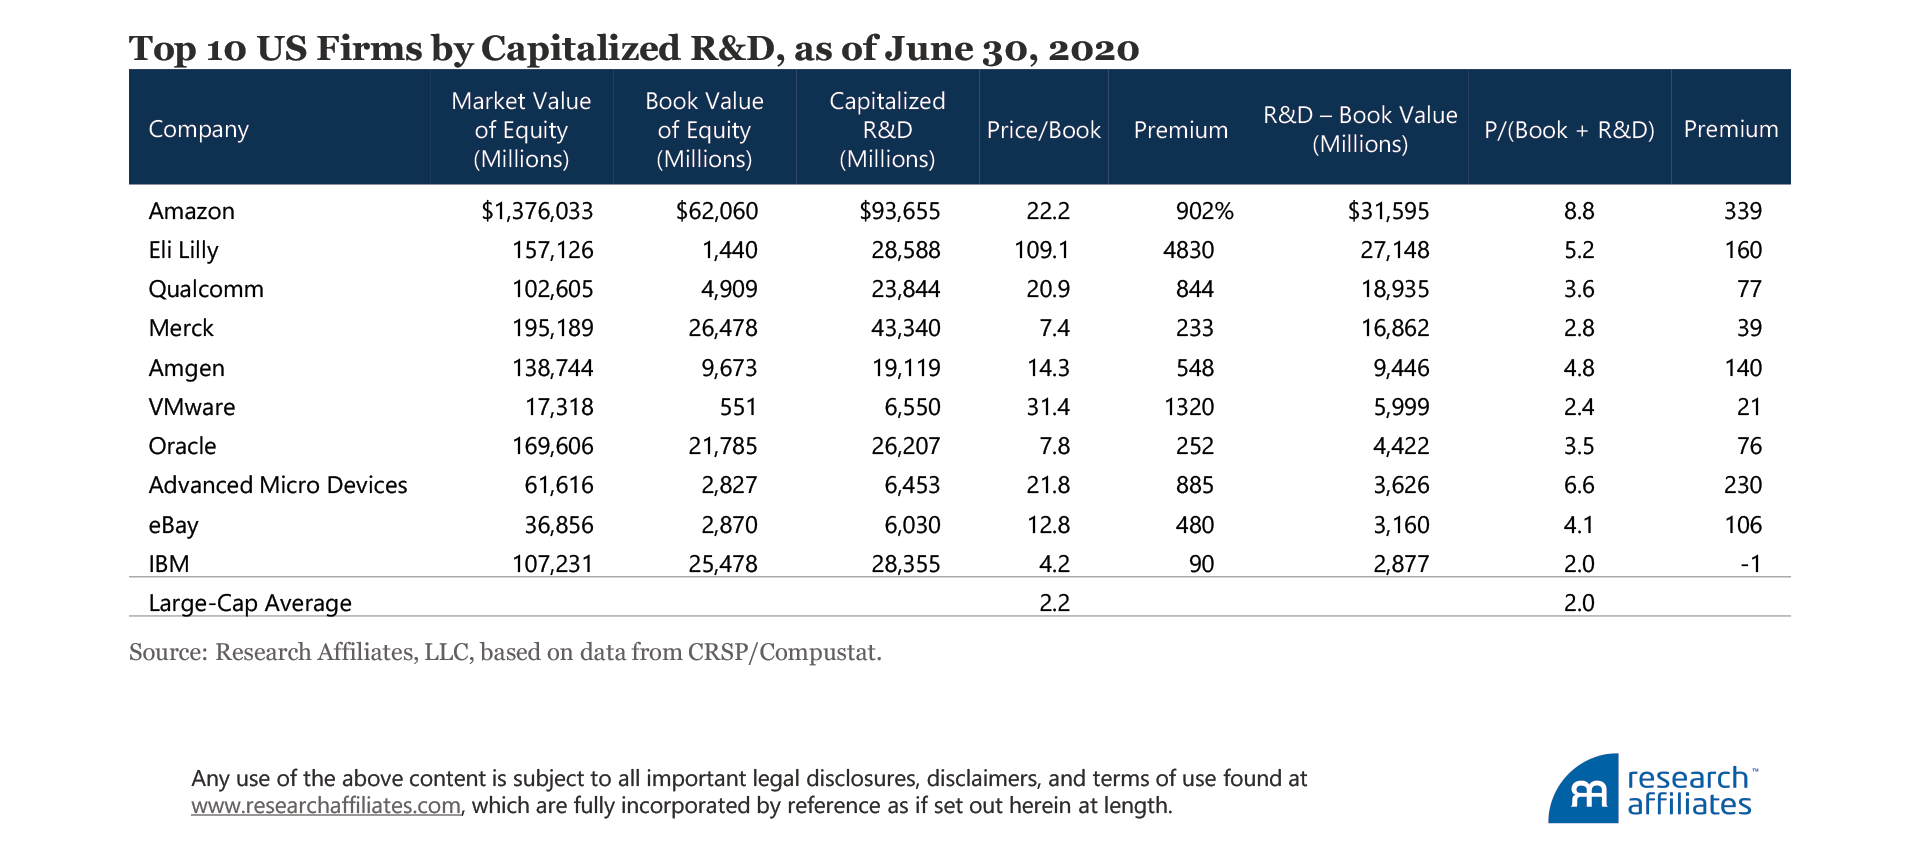
Some of the firms in the list appear to be much less expensive when examined by a P/(B + R&D) multiple than by the standard P/B multiple. Although we would not reclassify any as a value stock after incorporating R&D, the premia of several companies shrink substantially. IBM, for example, trades at nearly double the price of the average large-cap company when measured by P/B alone (4.2 times versus 2.2 times), but at a sliver of a discount (−1%) when measured by P/(B + R&D).
Of course, not every firm on the list has a multiple that shrinks so close to the multiple of the average company. Amazon tops the list with capitalized R&D spending more than $30B larger than its book value. The firm remains, however, quite expensive even after factoring in this massive R&D outlay. On a pure P/B basis, Amazon is more than 10 times the price of the average company (22.2 times versus 2.2 times). After we include R&D spending, it remains expensive at nearly 4.5 times the price of the average company (8.8 times versus 2.0 times). Amazon is not the only exorbitantly priced company that still looks extremely expensive after incorporating R&D.
The FANG stocks (Facebook, Amazon, Netflix, and Google/Alphabet) all trade at a substantial premium to the average company in terms of both P/B and P/B + R&D. Tacking on additional intangible assets in the form of SG&A (selling, general, and administrative expenses) does not narrow the premia.
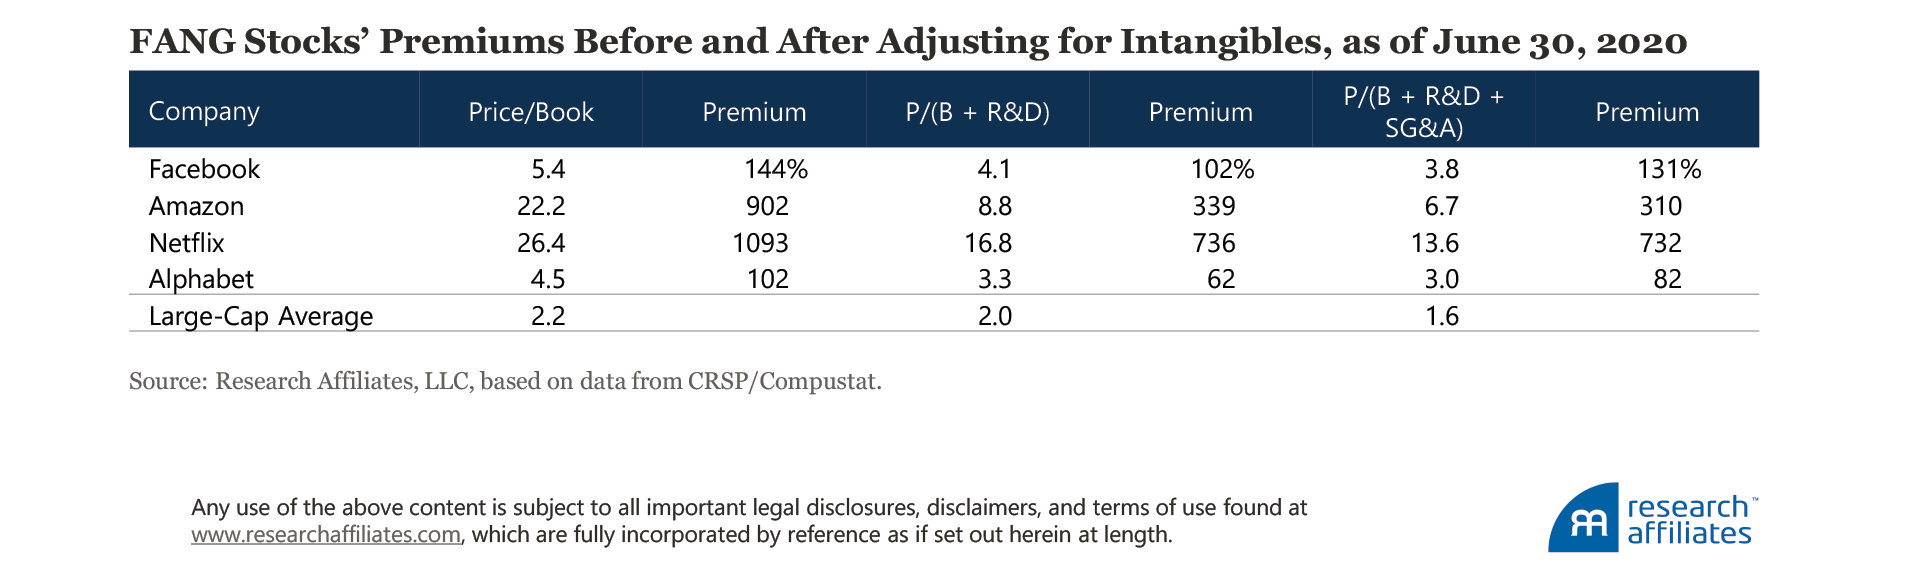
Across these three sets of multiples, only one of these firms, Alphabet, ever sees its multiple relative to the average company drop below 2 times: Alphabet is less than double the price of the average firm when we add R&D alone to book value or add R&D and SG&A to book value. Incorporating intangibles can make the valuations of some growth firms appear more reasonable, yet expanding beyond book value to a more complete measure of firm capital will not change the fact that some companies are expensive today regardless of the metric used to evaluate them. The FANG stocks are merely the most vivid example of expensive mega-cap companies. The addition of intangibles has the most substantial impact on the relative valuations of firms—which would be expensive if measured by P/B alone—at the other end of the size spectrum, that is, within small companies.
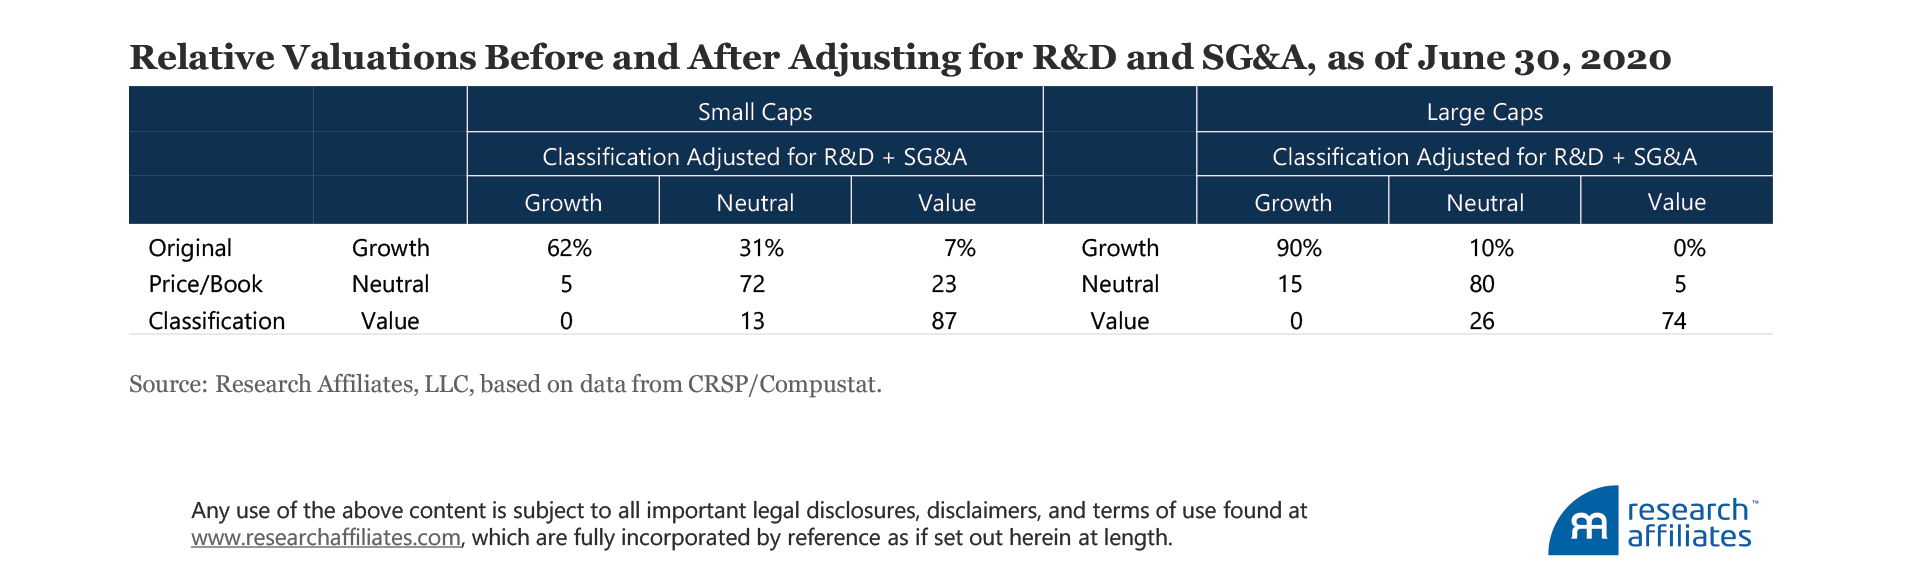
Small Firms with Big Intangibles
Tracking the impact of the addition of intangibles to the P/B multiple across size categories shows the inclusion of R&D has a far greater impact on small companies than on large companies. This result is intuitive. Firms, for example, that research molecules for pharmaceutical use tend to spend heavily on R&D and drug companies, including both pharmaceutical and biotech firms, compose a much greater share of small caps (15.6%) than large caps (6.6%). Indeed, 17 of the top 20 firms within the small-cap space, as ranked by a ratio of R&D spending to book value, are drug companies.
We can track the relative valuation of each firm both before and after we add each measure of intangibles to P/B. First, we sort the universe of companies by NYSE median-cap stock to classify large versus small. Next, we separately sort by valuation, labeling the cheapest 30% as value, the most expensive 30% as growth, and the middle 40% as neutral. Only 64% of small caps categorized as growth solely according to P/B would continue to be categorized as growth if we value all firms by P/(B + R&D). Under the P/(B + R&D) valuation, 30% of the firms move into the neutral category, while 6% of the firms’ R&D spending is so large relative to their book values they jump all the way from growth to value.
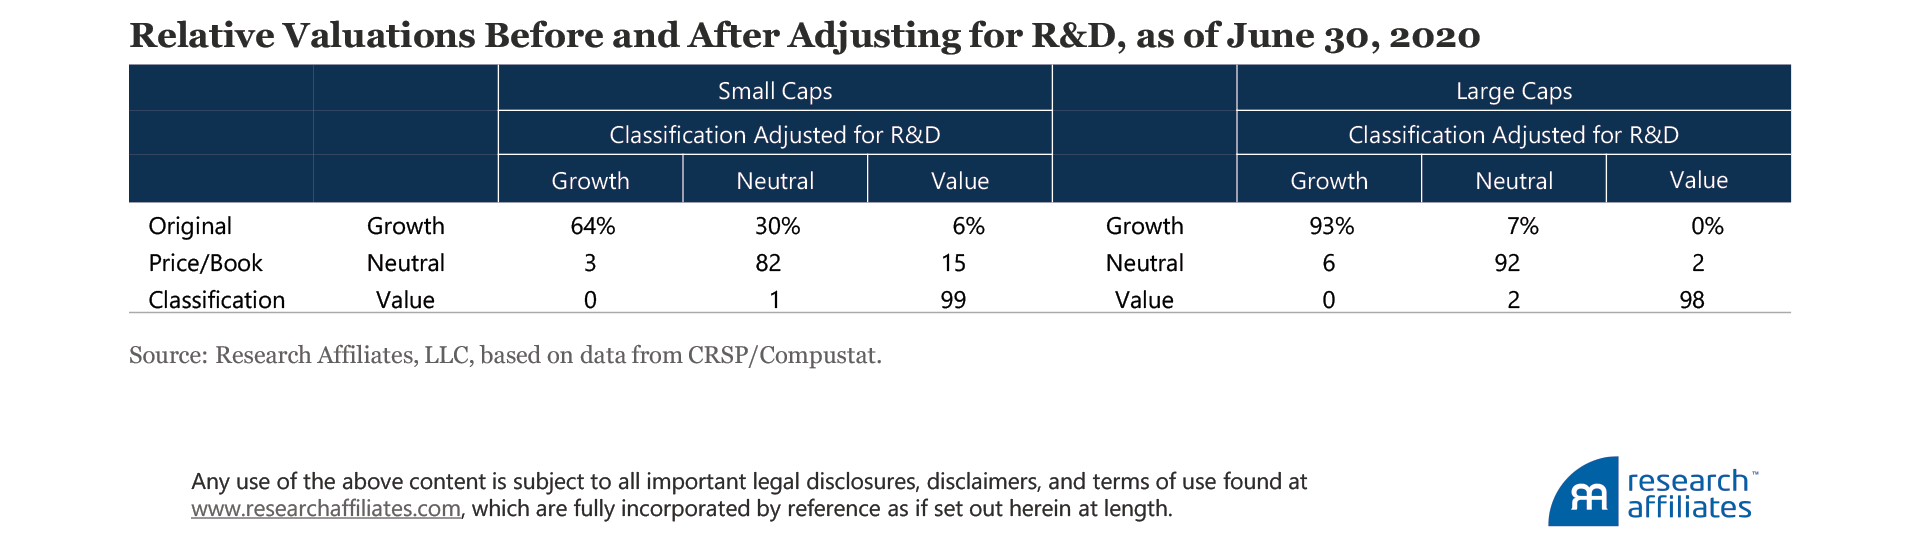
As we move beyond R&D on which nascent drug companies are so dependent and expand our measure to include SG&A, the gap between large and small companies narrows only modestly. We observe that the FANG stock examples seem largely representative of the experience of all large-cap growth stocks. The categorization of this group shows the most persistence; regardless of the amount of intangibles we add to the valuation measure, at least 90% of large-cap growth stocks continue to be categorized as growth stocks. Whereas spending on R&D and SG&A may be growing faster than book value for large-cap growth companies, large-cap value companies are also growing their spending in these same areas, making it difficult for many large-cap growth companies to narrow the valuation gap even when using this expanded definition.
Measuring Intangibles and Performance
Our methods for measuring intangibles and for measuring performance are the same methods used by Li (2020). We follow a perpetual inventory method to measure the intangible capital we add to book value (Eisfeldt and Papanikolaou, 2014, Lev and Srivastava, 2019, and Peters and Taylor, 2017).1
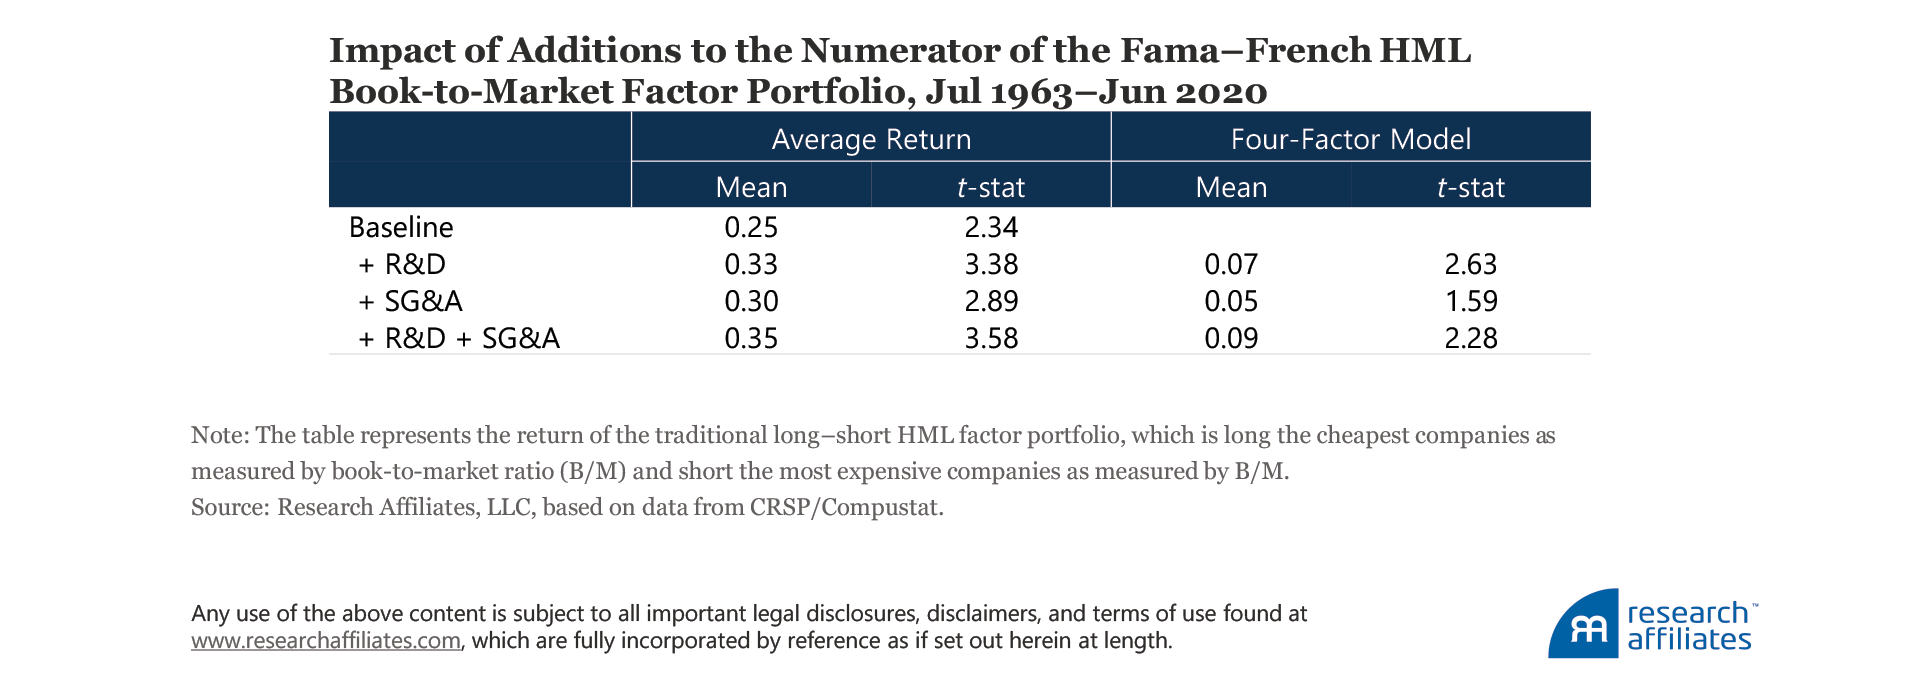
We construct an HML (high-minus-low) value factor using the Fama–French (1993) methodology. We first examine the performance impact on value investing by adding knowledge capital (R&D) to baseline HML. The performance of HML improves by eight basis points a year (0.33 versus 0.25) when R&D expenses are capitalized and added to book value. Similarly, organization capital, represented by a fraction of spending on SG&A, tends to improve the performance of value investing by five basis points a year (0.30 versus 0.25).
After controlling for the Carhart (1997) four-factor model, which explicitly constructs value-factor portfolios using P/B without adjusting for intangibles, the incremental return from both measures that include R&D—R&D alone and R&D plus SG&A—remains significant. Robustness checks that alter the depreciation rate and that use a smaller fraction of SG&A expenses yield similar results.
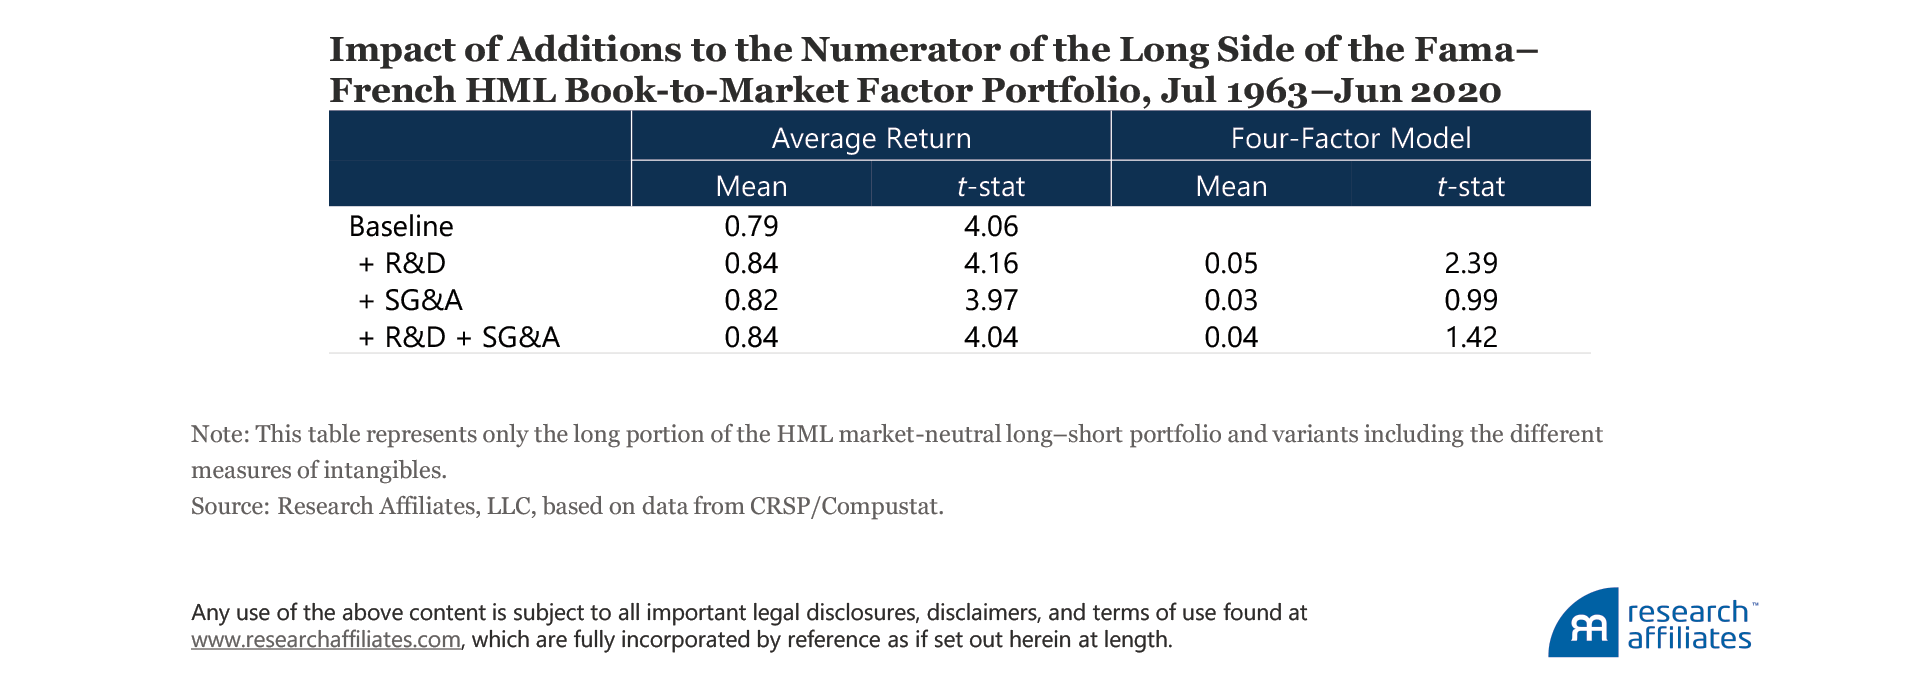
Although the traditional Fama–French HML portfolio represents a market-neutral long–short portfolio, many investors access value exposure solely in a long-only setting. Whether due to simple preference or binding constraint, value investors typically buy shares of cheaply priced companies rather than short expensively priced companies. Accordingly, we test the impact of adding intangibles in a long-only setting given it is the relevant exposure for a broader group of investors than is the academic long–short portfolio.
In the long-only setting, we observe a similar pattern. Most of the value-add from intangibles is attributable to the capitalization of R&D spending. This makes intuitive sense because R&D is an activity to which management can direct investment in order to gain a long-term competitive advantage. Only R&D-adjusted book value exhibits a statistically significant improvement in performance.
Source of the Excess Return
Some researchers have suggested the modest premium associated with intangibles-adjusted B/P is not a free lunch. Companies that incur R&D to create a long-term competitive advantage are also more likely to cut costs by abandoning their investment in knowledge capital when facing financial constraints. Li (2011) documents that a positive R&D return relationship is only present among R&D-intensive financially constrained firms, which have higher levels of risk than those that are unconstrained. Gu (2016) shows that R&D-intensive firms tend to be riskier and earn higher expected returns, especially in competitive industries. Similarly, firms with high levels of organization capital are riskier from the shareholder’s perspective, because key talent, embodied in the organization capital, may leave if their outside option becomes more attractive (Eisfeldt and Papanikolaou, 2013). Many of these arguments share similarities with the Fama–French (1992) argument that risk drives the value premium.
Lakonishok, Shleifer, and Vishny (1994) outline an alternative to the risk-based explanation, asserting that mispricing causes the value premium. We fall into this camp because we believe mispricing, not risk, drives the value premium (Chaves et al., 2013, and Chaves and Arnott, 2012). It is not a coincidence that portfolios weighted by sales, cash flow, dividends, and book value result in similar returns if rebalanced regularly. The rebalance itself, not the metric to which the portfolio rebalances, drives the excess return (Arnott et al., 2013). Accordingly, we are not surprised to see results that show the addition of intangibles has a muted impact on the returns of HML portfolios.
Regardless of which camp you fall into, our findings indicate that the incremental excess return achieved via the addition of intangibles is statistically significant in only three of the seven long–short iterations and one of the long-only iterations we tested in our sample. These muted results may rightfully lead to questions about why we believe intangibles should be added to book value when determining a firm’s value.
A More Robust Picture of a Firm’s Valuation
We believe mispricing, not risk, drives the value premium. On the one hand, we would not expect the expansion of an individual measure of valuation to yield substantially different returns for a value portfolio. On the other hand, a lack of return impact does not mean we should use incomplete measures when valuing firms.
We do not recommend using P/B alone to determine a company’s valuation because it is an incomplete measure of firm capital. This distortion has grown over the last 30 years, but can be corrected by adding intangibles to book value to create a ratio of price to total firm capital. This more comprehensive measure reduces bias against firms whose business models are less reliant on physical capital. Even though the addition of intangibles does not make a meaningful impact on the relative valuation ratio of each and every firm, this broader view offers a more-level playing field by giving firms credit for investing in research and knowledge capital, not just property, plant, and equipment.
Finally, a composite of multiple ratios paints a more detailed picture of a firm’s valuation. Although total firm capital is a more robust measure of firm size than book value alone, it still does not provide a complete measure of firm value. Just as home buyers consider a host of variables when evaluating the price of a new house, we prefer to use multiple variables to get the most robust picture possible of a firm’s valuation. Multiple variables reduce the impact of each metric’s inherent shortcomings when the metric is used in isolation.
Please read our disclosures concurrent with this publication: https://www.researchaffiliates.com/legal/disclosures#investment-adviser-disclosure-and-disclaimers.

Endnote
- R&D capital is measured as RCit = RCit–1(1 – δ) + R&Dit, where RCit is the end-of-period t stock of R&D capital of firm i, R&Dit is the firm’s R&D expenditures in year t, and δ is the depreciation rate of R&D capital. We measure organization capital stock as OCit = OCit–1(1 – δ) + 0.3 × SG&Ait, where OCit is the end-of-period t stock of organization capital of firm i, SG&Ait is the firm’s SG&A expense in year t, and δ is the depreciation rate of organization capital. We assume a depreciation rate of 20%, an initial stock of zero, and, following previous literature (Peters and Taylor, 2017, Hulten and Hao, 2008, Eisfeldt and Papanikolaou, 2014, and Zhang, 2014) assume that only 30% of SG&A is investment in intangible capital and the remainder is operating expense for the current period.
References
Arnott, Robert D., Campbell R. Harvey, Vitali Kalesnik, and Juhani Linnainmaa. 2020. “Reports of Value’s Death May Be Greatly Exaggerated.” Research Affiliates Publications (May). Available on SSRN.
Arnott, Robert D., Jason Hsu, Vitali Kalesnik, and Phil Tindall. 2013. “The Surprising Alpha from Malkiel’s Monkey and Upside-Down Strategies.” Journal of Portfolio Management, vol. 39, no. 4 (Summer):91–105.
Arnott, Robert D., Vitali Kalesnik, Engin Kose, and Lillian Wu. 2017 “Can Momentum Investing Be Saved?” Research Affiliates Publications (October).
Carhart, Mark M. 1997. “On Persistence in Mutual Fund Performance.” Journal of Finance, vol. 52, no. 1 (March):57–82.
Chaves, Denis, and Robert D. Arnott. 2012. “Rebalancing and the Value Effect.” Journal of Portfolio Management, vol. 38, no. 2 (Fall):59–74.
Chaves, Denis, Jason Hsu, Vitali Kalesnik, and Yoseop Shim. 2013. “What Drives the Value Premium? Risk versus Mispricing: Evidence from International Markets.” Journal of Investment Management, vol. 11, no. 4 (Fourth Quarter):1–18.
Eisfeldt, Andrea, and Dimitris Papanikoloau. 2014. “The Value and Ownership of Intangible Captial.” American Economic Review, vol. 104, no. 5 (May):189–194.
———. 2013. “Organization Capital and the Cross-Section of Expected Returns.” Journal of Finance, vol. 68, no. 4 (August):1365–1406.
Fama, Eugene F., and Kenneth R. French. 1992. “The Cross-Section of Expected Stock Returns.” Journal of Finance, vol. 47, no. 2 (June):427–465.
———. 1993. “Common Risk Factors in the Returns on Stocks and Bonds.” Journal of Financial Economics, vol. 33, no. 1 (February):3–56.
Gu, Lifeng. 2016. “Product Market Competition, R&D Investment, and Stock Returns.” Journal of Financial Economics, vol. 119, no. 2 (February):441–455.
Hulten, Charles, and Xiaohui Hao. 2008. “What Is a Company Really Worth? Intangible Capital and the ‘Market to Book Value’ Puzzle.” NBER Working Paper No. 14548 (December).
Lakonishok, Josef, Andrei Shleifer, and Robert W. Vishny. 1994. “Contrarian Investment, Extrapolation, and Risk.” Journal of Finance, vol. 49, no. 5 (December):1541–1578.
Lev, Baruch, and Anup Srivastava. 2019. “Explaining the Recent Failure of Value Investing.” NYU Stern School of Business (October 25). Available at SSRN.
Li, Dongmei. 2011. “Financial Constraints, R&D Investment, and Stock Returns.” Review of Financial Studies, vol. 24, no. 9 (September):2974–3007.
Li, Feifei. 2020. “Intangibles: The Missing Ingredient in Book Value.” Available on SSRN.
Novy-Marx, Robert. 2016. “Testing Strategies Based on Multiple Signals.” Simon Graduate School of Business, University of Rochester. Available at http://rnm.simon.rochester.edu/research/MSES.pdf.
Peters, Ryan, and Lucian Taylor. 2017. “Intangible Capital and the Investment-q Relation.” Journal of Financial Economics, vol. 123, no. 2 (February):251–272.
Zhang, Mindy X. 2014. “Who Bears Firm-Level Risk? Implications on Cash-Flow Volatility.” Working Paper Series, University of Texas at Austin (January).
