
Our analysis examines combinations of six factors (value, low beta, profitability, investment, momentum, and size) in simple long-only, investable portfolios that reflect real-world strategies. Based on our research, these six factors produce a substantial diversification benefit across return drivers.
We find that selecting roughly a quarter of the investable universe based on one specific signal for each factor typically produces the best risk-adjusted performance for a multi-factor strategy in the presence of implementation costs.
Neither a focus on maximizing paper portfolio performance, which ignores the associated trading costs, nor a singular focus on low-cost implementation, which misses opportunities for better performance, will produce an optimal result for multi-factor smart beta investors.
We strongly advocate the thoughtful design of a multi-factor strategy, which requires a conscious and deliberate decision to find the most advantageous balance between effectively harvesting the factor premium and implementation cost.
One thing is for sure, investing means buying and selling, and these two activities aren’t free. Regardless of how promising the strategy looks on paper, its benefits will be reduced to some degree through its implementation. A worthy goal, therefore, is to limit the toll implementation takes on a strategy’s execution.
Factor investing, also known as smart beta, has become increasingly popular as investors realize they can harvest factor-driven excess returns over the market capitalization-weighted benchmark through a simple, transparent, and rules-based approach. A multi-factor strategy offers a one-stop solution for investors seeking excess returns associated with several factors. The diversifying aspect of combining factors with different risk and return characteristics and low correlations helps investors “weather the storm” during adverse market conditions.1
The goal of not unduly reducing the benefits associated with factor investing by incurring unnecessary transaction costs means adopting real-world product design that is mindful of implementation in the areas related to portfolio concentration, turnover, trading cost, and capacity. In this article we address two questions in the presence of implementation costs: Which factors should be included in a multi-factor portfolio? What is the best way to construct a single-factor portfolio? We find the right balance is achieved by making a conscious decision based on thorough study of the trade-off between the effective harvesting of the factor premium and low cost implementation.
Factor Performance and Correlation
Consistent with Brightman et al. (2017), we include in our analysis six factor-based smart beta strategies: value, profitability, investment, size, low beta, and momentum. Each of these factors is widely deemed robust in the academic literature (Fama and French, 1993, 2012, 2016; Carhart, 1997; and Frazzini and Pedersen, 2014). Profitability and investment, supported by strong academic evidence, are characteristics associated with quality (Hsu, Kalesnik, and Kose, 2019). To illustrate the opportunities presented by investing in real-world strategies, we construct simple long-only investable portfolios in accordance with widely accepted academic practice.
To construct the long-only factor portfolios, we start with the large-cap universe of US stocks, except for the small-size strategy. For each, we use the top 30%, based on NYSE breakpoints, to select stocks based on the corresponding characteristics. For example, we construct the value portfolio from stocks above the 70th percentile on the NYSE by book-to-market ratio. We then capitalization weight the selected stocks, except for low beta, which we weight by beta ranking following Frazzini and Pederson (2014). The portfolios are rebalanced annually each July with the exception of momentum and low beta, which are rebalanced quarterly. Details about our factor construction method are provided in the appendix. On average, the six factor-based smart beta strategies deliver economically significant returns, with an average annualized excess return of 1.86% over the study period, July 1973–December 2018.

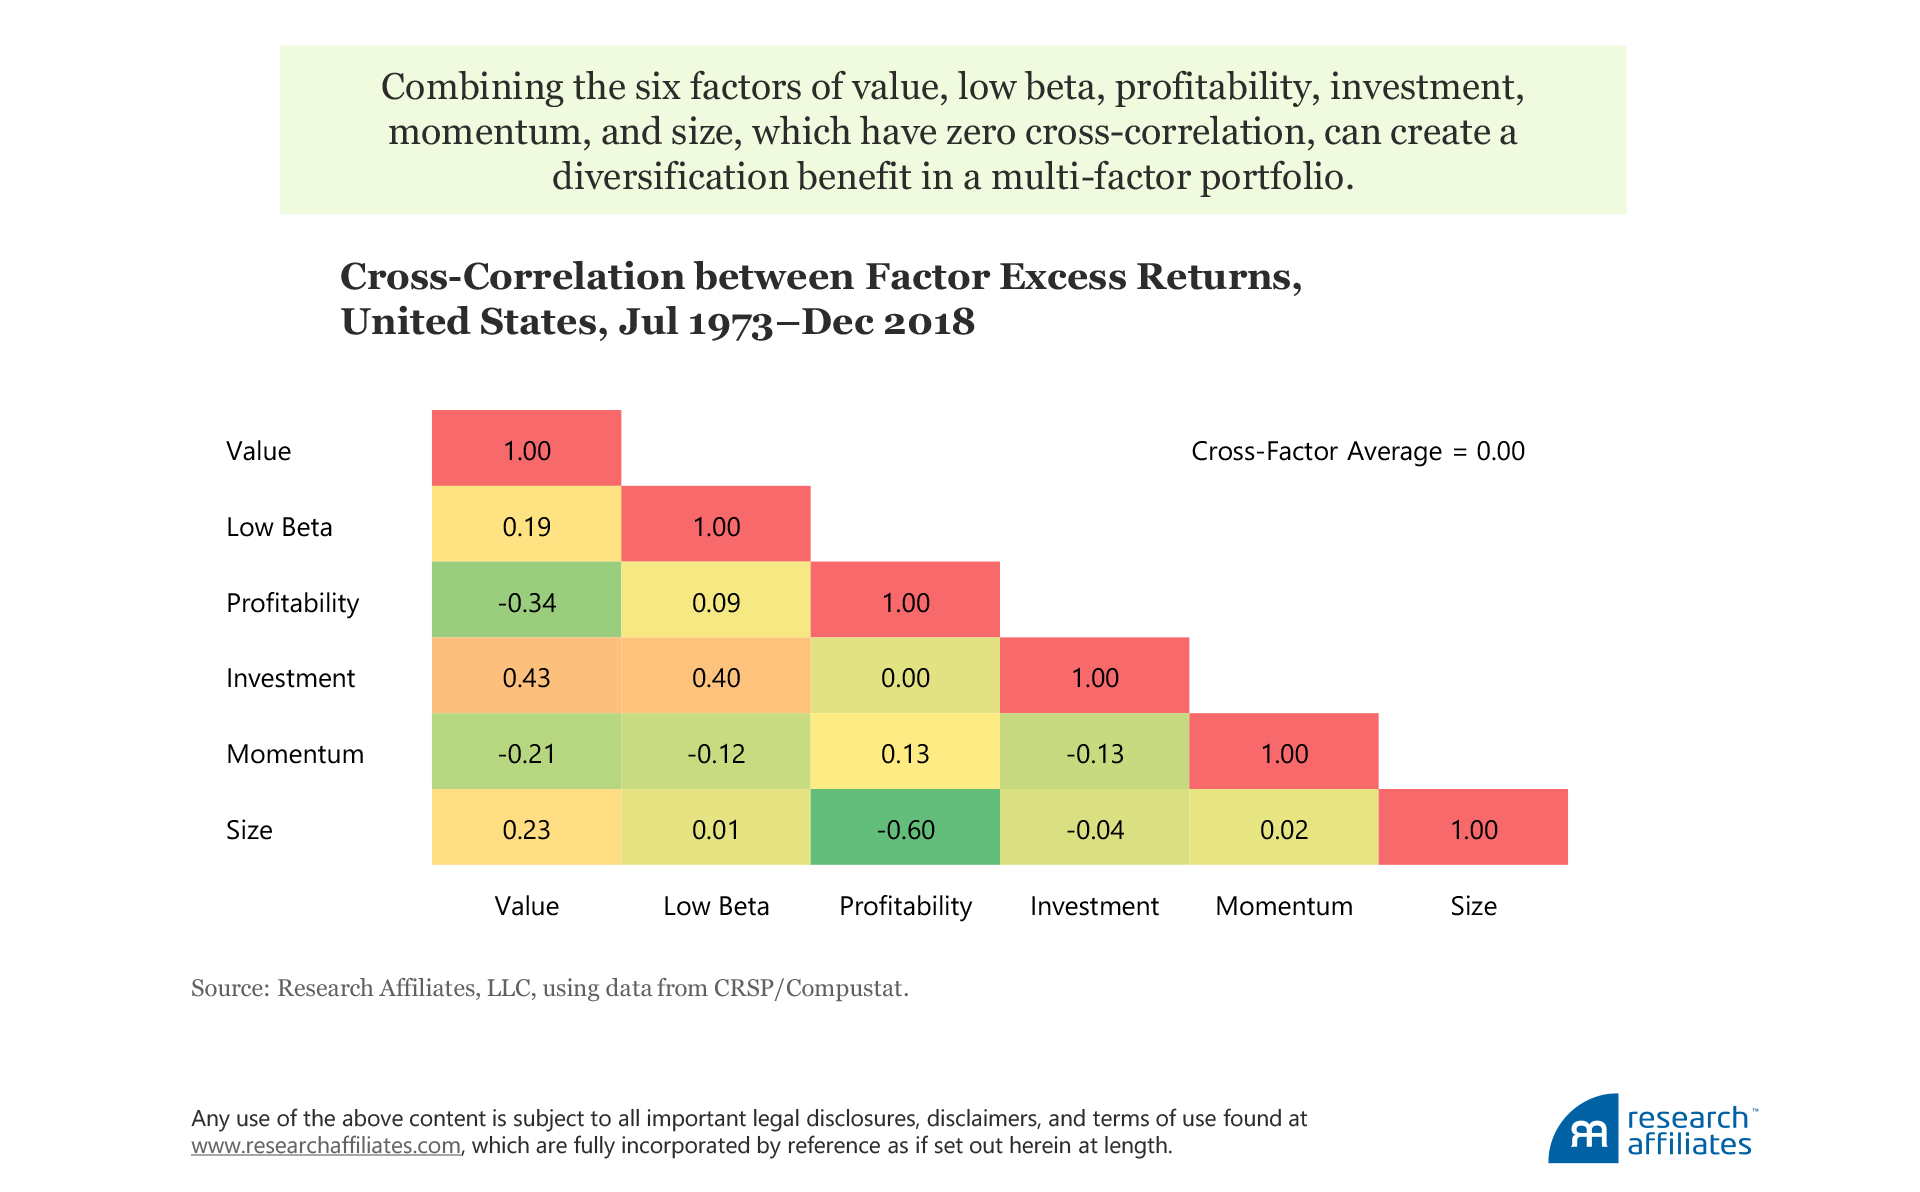
The correlations of the six factors’ excess returns over the market are mostly low or negative. The only factors that appear to have a correlation above 0.4 are investment, value, and low beta. On average, the pairwise cross-factor correlation is virtually zero, suggesting that a combination of these six factors can create a diversification benefit.
At first glance, the momentum and size factors appear to offer a substantial diversification benefit when added to the multi-factor strategy. The momentum factor has a negative correlation with three of the other factors—value, low beta, and investment—and a slight positive correlation with the remaining two—profitability and size. The size factor is relatively lowly correlated with the other factors, and especially seems to be a strong diversifier of the profitability factor. Bringing implementation into the picture, however, requires more thoughtful analysis given the notorious reputation of high transaction costs in trading a momentum strategy and small stocks.
Implementation Costs of Factors
In this article we focus on the implicit component of implementation cost, which can be measured by the market impact of the trade, or in other words, the movement in a security’s price due to trading (Aked and Moroz, 2015). The market impact of a portfolio rebalancing can be attributed to the following:
- Portfolio volume—the aggregate of median daily trading volume of all stocks in a portfolio. A strategy’s cost is inversely proportional to its portfolio volume; in other words, a strategy is more costly to implement if it requires holding illiquid stocks.
- Tilt—a measure of illiquidity that represents the degree to which portfolio weights deviate from the weights proportional to trading volume. The smallest possible value of tilt is 1.0, which is achieved by a volume-weighted portfolio, theoretically the most liquid combination of a given set of holdings.
- Turnover—a measure of how frequently assets in a portfolio are bought and sold by the strategy over a 12-month period, typically a calendar year. In general, a strategy that requires a higher rate of trading incurs higher market-impact costs.
- Turnover concentration—the degree to which trades are spread across the holdings in a portfolio. Highly concentrated trades are more costly to execute. A strategy that demands high liquidity from only a few names causes higher market impact than another strategy that spreads out trades across many holdings.
Intuitively, we are led to believe that low portfolio volume, high tilt, high turnover, and high turnover concentration are associated with a high market impact cost.
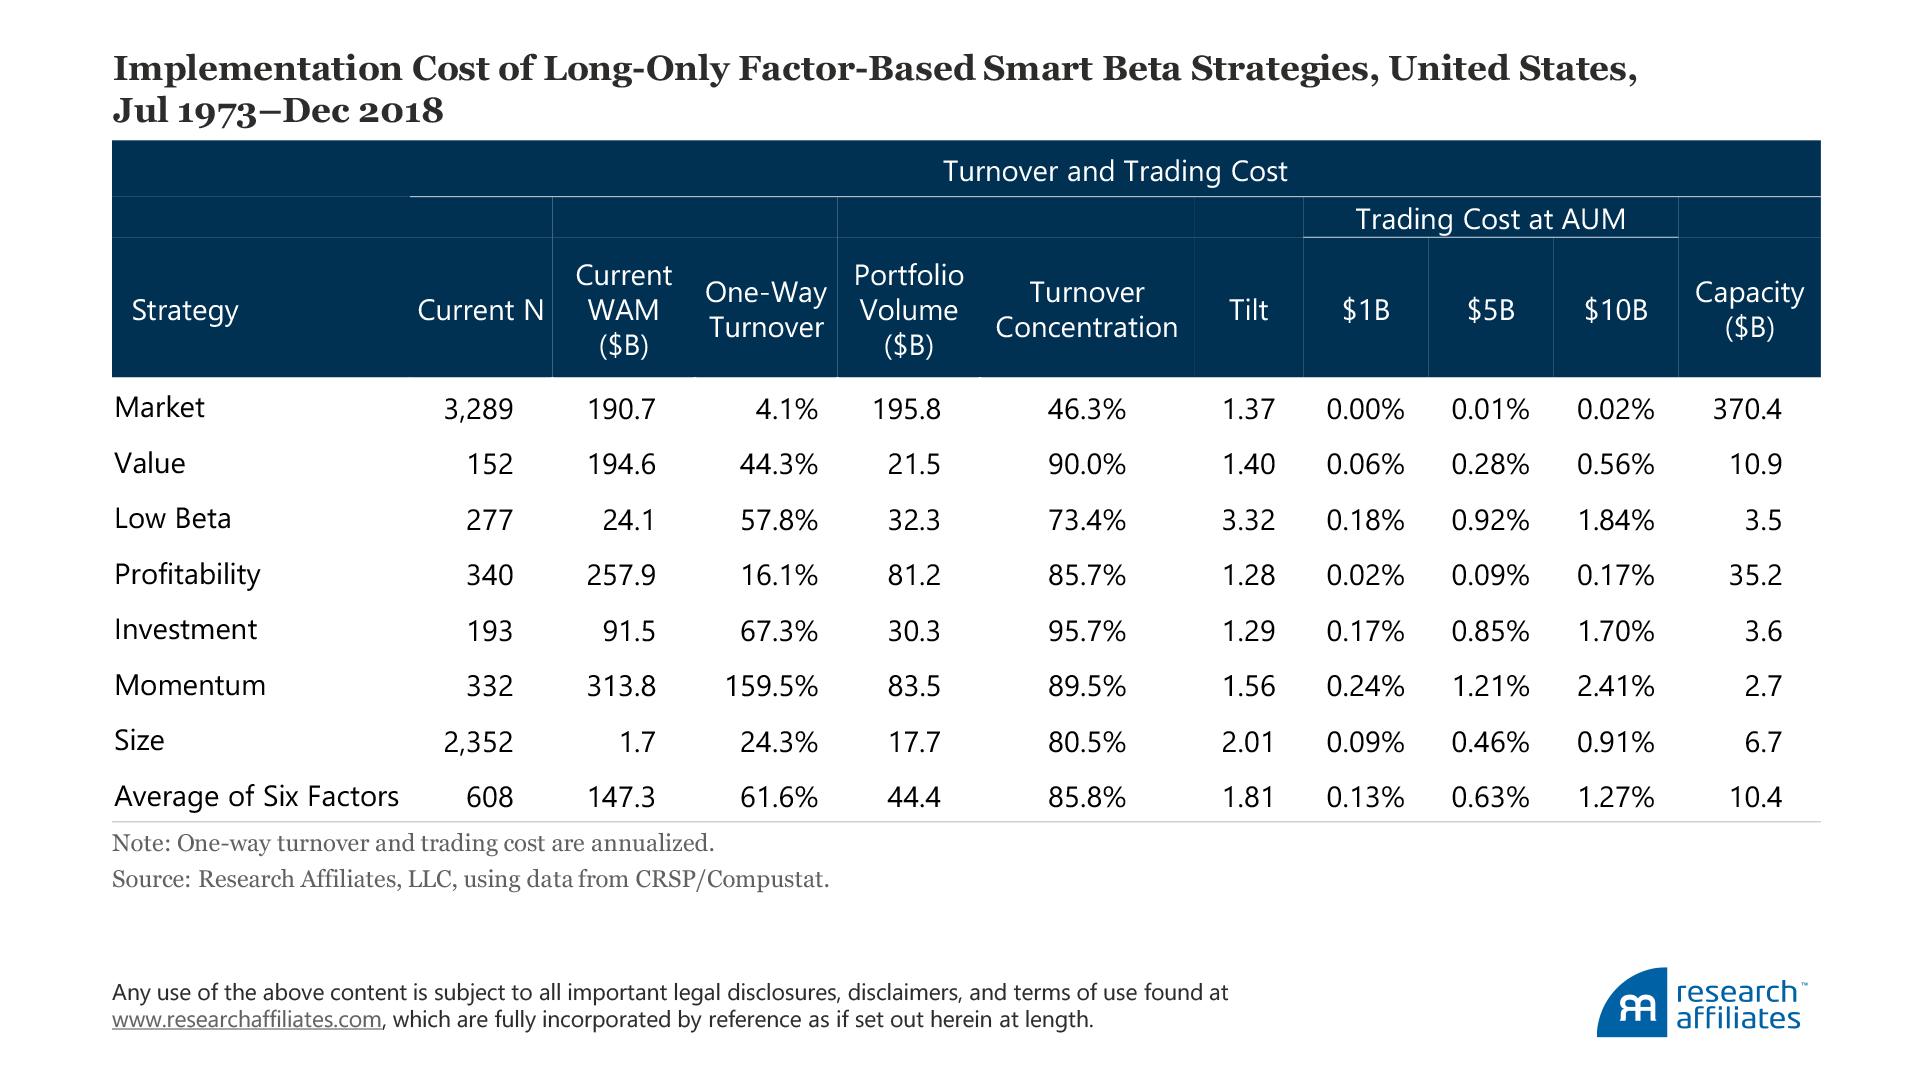
The average turnover across these six strategies is 61.6% and the average estimated trading cost of the strategies is 127 basis points (bps), given the assumption of $10B assets under management (AUM).2 The cost of implementing a strategy that has high turnover, strong tilt, or low volume can be quite large. The momentum strategy, for example, has annualized one-way turnover of an extraordinarily high 159.5%, assuming quarterly rebalancing, which generates a comparatively high trading cost of 241 bps at $10B AUM even though portfolio volume and tilt are at reasonable levels. When we take into consideration implementation shortfall, using a naively constructed momentum factor as a stand-alone investment strategy does not seem to produce a good outcome.
In contrast, strategies with high portfolio volume, low tilt, or low turnover typically have lower implementation costs. For example, the profitability strategy, which has the lowest trading cost of the six factors (17 bps at $10B AUM) is characterized by all three of the low-cost traits. The value strategy also incurs low trading costs (56 bps at $10B AUM) by virtue of its relatively low turnover and tilt. Interestingly, the size strategy, which focuses on stocks with a small market capitalization, has a below-average trading cost (91 bps at $10B AUM). Although the size factor tends to trade small, illiquid stocks as indicated by its comparatively low portfolio volume and high tilt, it has low turnover due to its broad coverage—2,352 names as of December 2018. On balance, the higher coverage of the size strategy almost offsets the cost of trading smaller companies.
Multi-Factor with Momentum and Size
Although momentum is very expensive to implement as a stand-alone strategy, and size seems to be risky from a volatility and tracking error perspective, these factors can be good additions to a multi-factor strategy because of their negative or low positive correlations with other factors. We analyze four portfolios to assess how including both factors impacts the performance characteristics and implementation costs of a multi-factor strategy. We look at four portfolios whose factors are allocated an equal weight and are rebalanced every quarter:
Portfolio 1: Value, low beta, profitability, and investment
Portfolio 2: Four factors in portfolio 1 plus momentum
Portfolio 3: Four factors in portfolio 1 plus size
Portfolio 4: Four factors in portfolio 1 plus momentum and size
When we add the momentum sleeve to the equally weighted four-factor portfolio to create portfolio 2, because of momentum’s negative or low positive correlations with the other factors, tracking error is reduced by 84 bps (3.40% versus 4.24%) and the information ratio (IR) improves to 0.57 versus 0.46. The trading cost of portfolio 2 is surprisingly lower than that of portfolio 1, 32 bps versus 33 bps, respectively, at the $10B AUM level. After taking into consideration the slightly lower trading cost of a single basis point, the IR net of trading costs of 0.47 is a major improvement over the same measure of 0.38 for portfolio 1.
Adding momentum increases portfolio volume and lowers portfolio tilt, both characteristics that lower trading cost. Because momentum is associated with more liquid stocks, the additional liquidity compensates for the increased turnover. In addition, momentum’s low or negative correlations with other factors leads to trades initiated by momentum’s rebalancing, which cancel out trades initiated by value or other sleeves. As a result, the portfolio turnover increases with the addition of momentum, but much less than expected, which explains the very modest decrease in trading cost.
The advantage of adding the size factor in portfolio 3 comes from its contribution to performance and through lower implementation costs. Adding size to the four-factor portfolio improves the return by 26 bps (13.13% versus 12.87%), while lowering the cost by 7 bps (0.27% versus 0.33%) at the $10B AUM level. Admittedly, the size strategy has the highest volatility of the six factors in our analysis. Thus, by including size, the volatility of the four-factor strategy increases by 0.6%, whereas the low correlation of size with the other factors reduces tracking error by 0.27%, improving the IR.
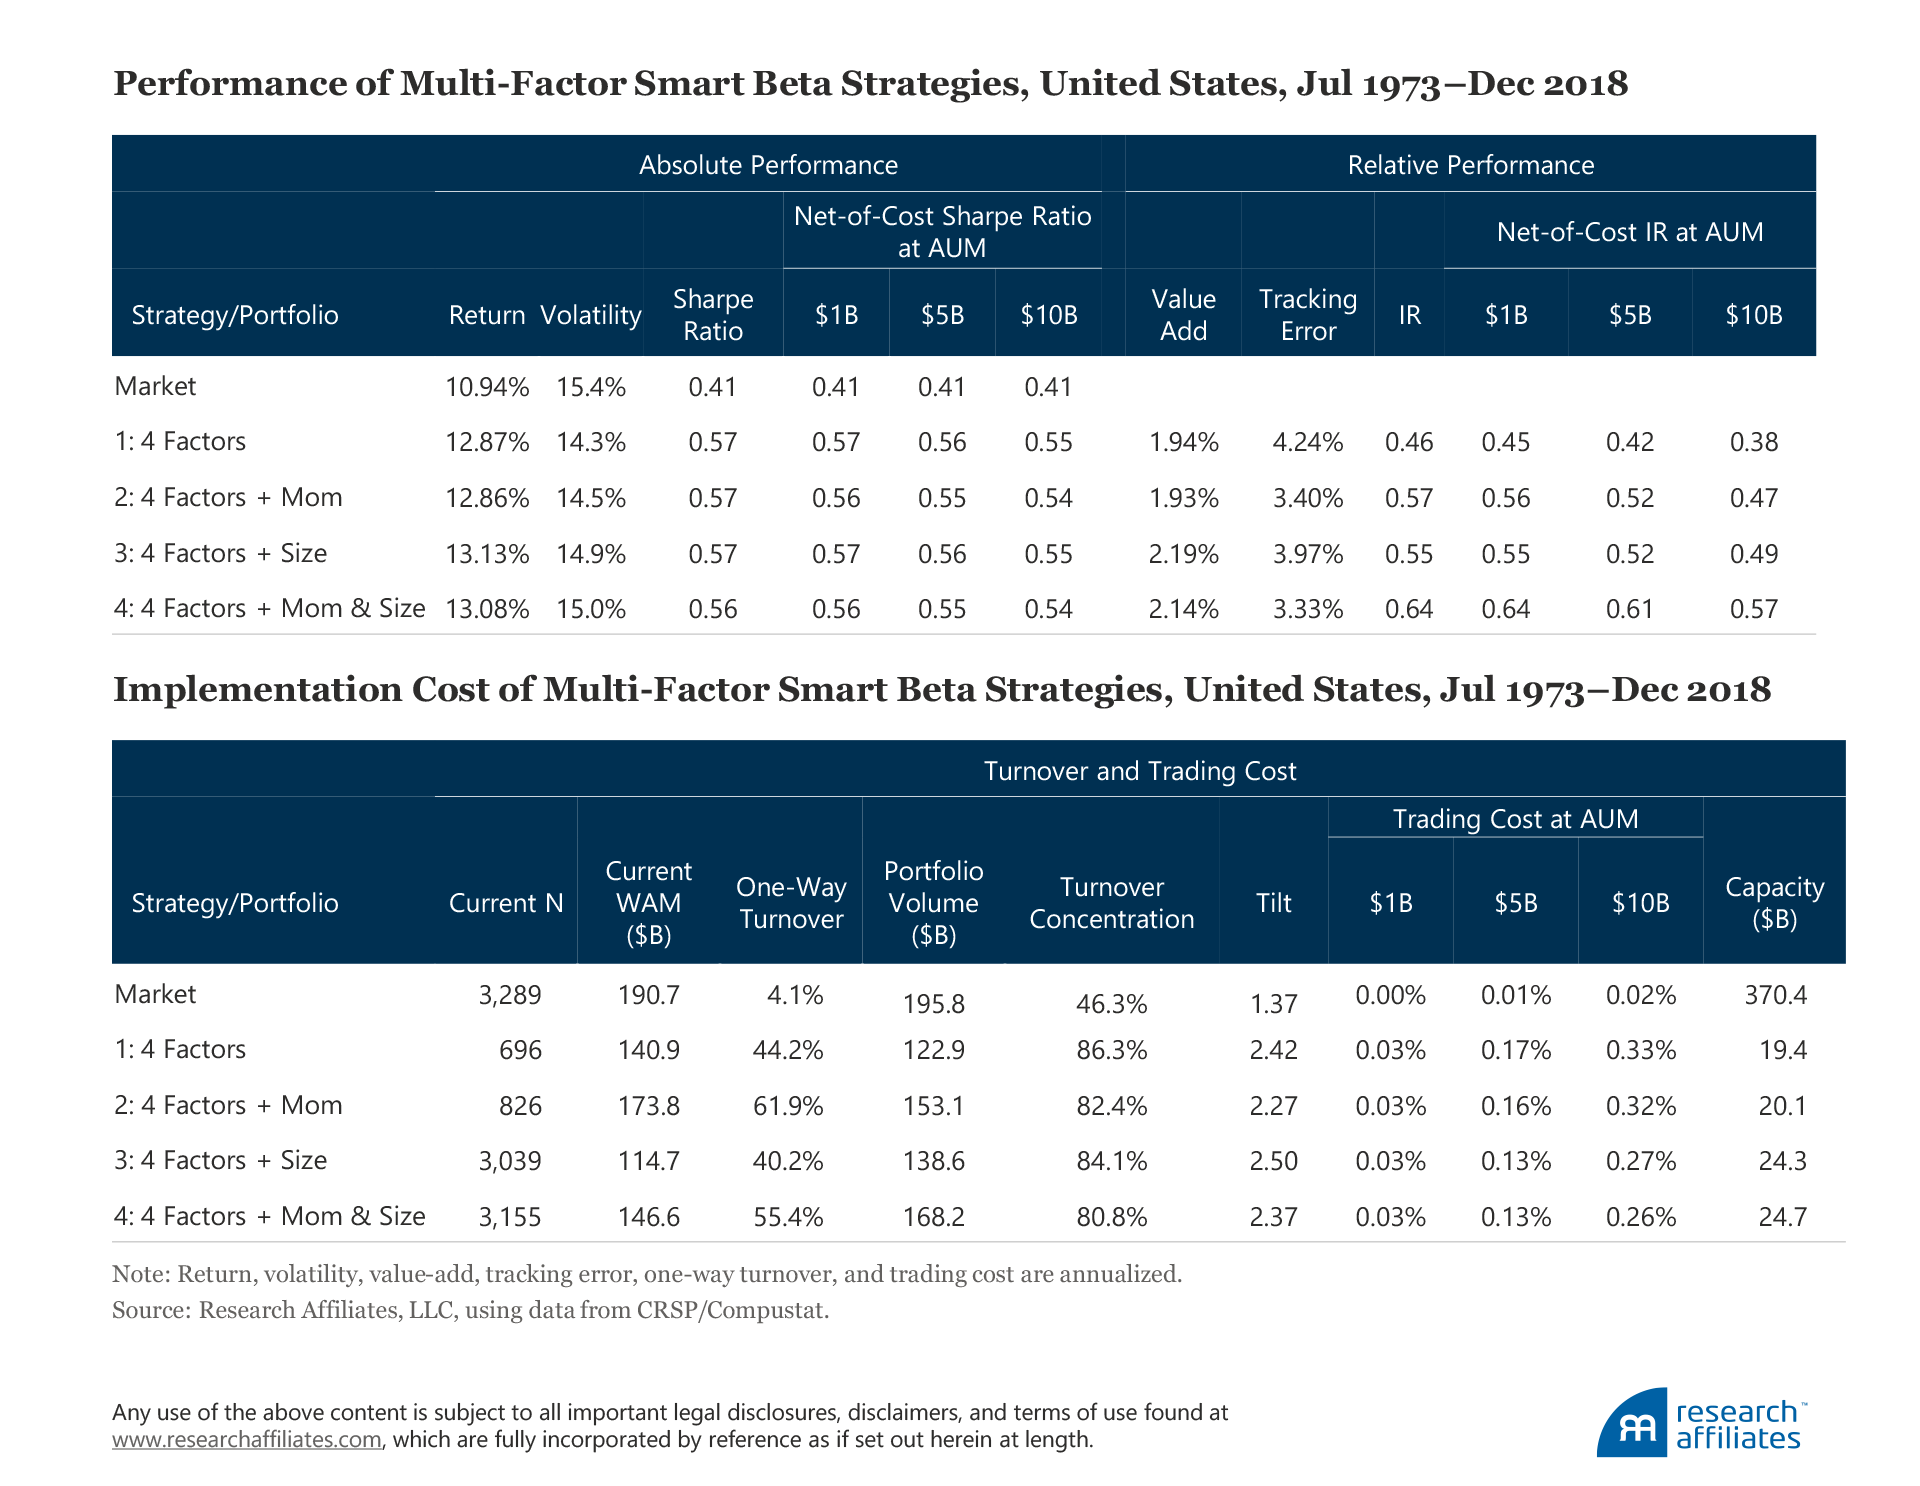
In summary, because the diversification benefit outweighs the increased cost of implementation, we recommend that investors include both the momentum and size factors in a multi-factor strategy. Portfolio 4, which combines momentum and size with value, low beta, profitability, and investment, yields the highest IR of the four portfolios we analyze, both before and after trading costs, 0.64 and 0.57 (assuming $10B AUM), respectively, and only barely lowers the Sharpe ratio from 0.57 to 0.56.
Selecting the Optimal Concentration Level
Intuitively, a certain concentration of stocks would appear necessary to extract the factor premium. Typically, the academic literature finds that quintile portfolios based on a specific signal show a monotonic return pattern; that is, the portfolio formed by selecting the top 20% of stocks based on the underlying signal performs the best, the portfolio of the next 20% of stocks exhibits the next-best performance, and so on, so that the bottom 20% of stocks has the weakest signal and the worst performance.
We construct a multi-factor strategy that combines the value, low beta, profitability, investment, momentum, and size factors at different concentration levels from a 50% cutoff to a 15% cutoff with a step-wise reduction of 5%. The one exception is the size strategy, whose cutoff we hold constant. Following the Fama and French (2016) definition, our small-size strategy consists of all the available stocks in the small-cap universe. We also estimate the implementation costs of the multi-factor strategies and calculate net-of-trading-cost Sharpe ratios and IRs across AUM of $1B, $5B, and $10B.
As the underlying factor portfolios become more concentrated, the return on the multi-factor strategy improves monotonically, which is consistent with academic findings and our forward-looking expectations of those stocks’ future performance. The risks, measured by volatility and TE, also rise with the concentration level, because overconcentration undermines the benefit of diversification and leads to greater idiosyncratic risk.
The risk-adjusted returns do not improve beyond the 25% concentration level even before taking trading costs into account. For example, for the no-cost portfolio, the Sharpe ratio monotonically increases from 0.53 to 0.57 from the 50% to the 25% concentration level, and remains more or less unchanged after that, and the IR increases from 0.50 to 0.68 from the 50% to the 25% level, declining thereafter.
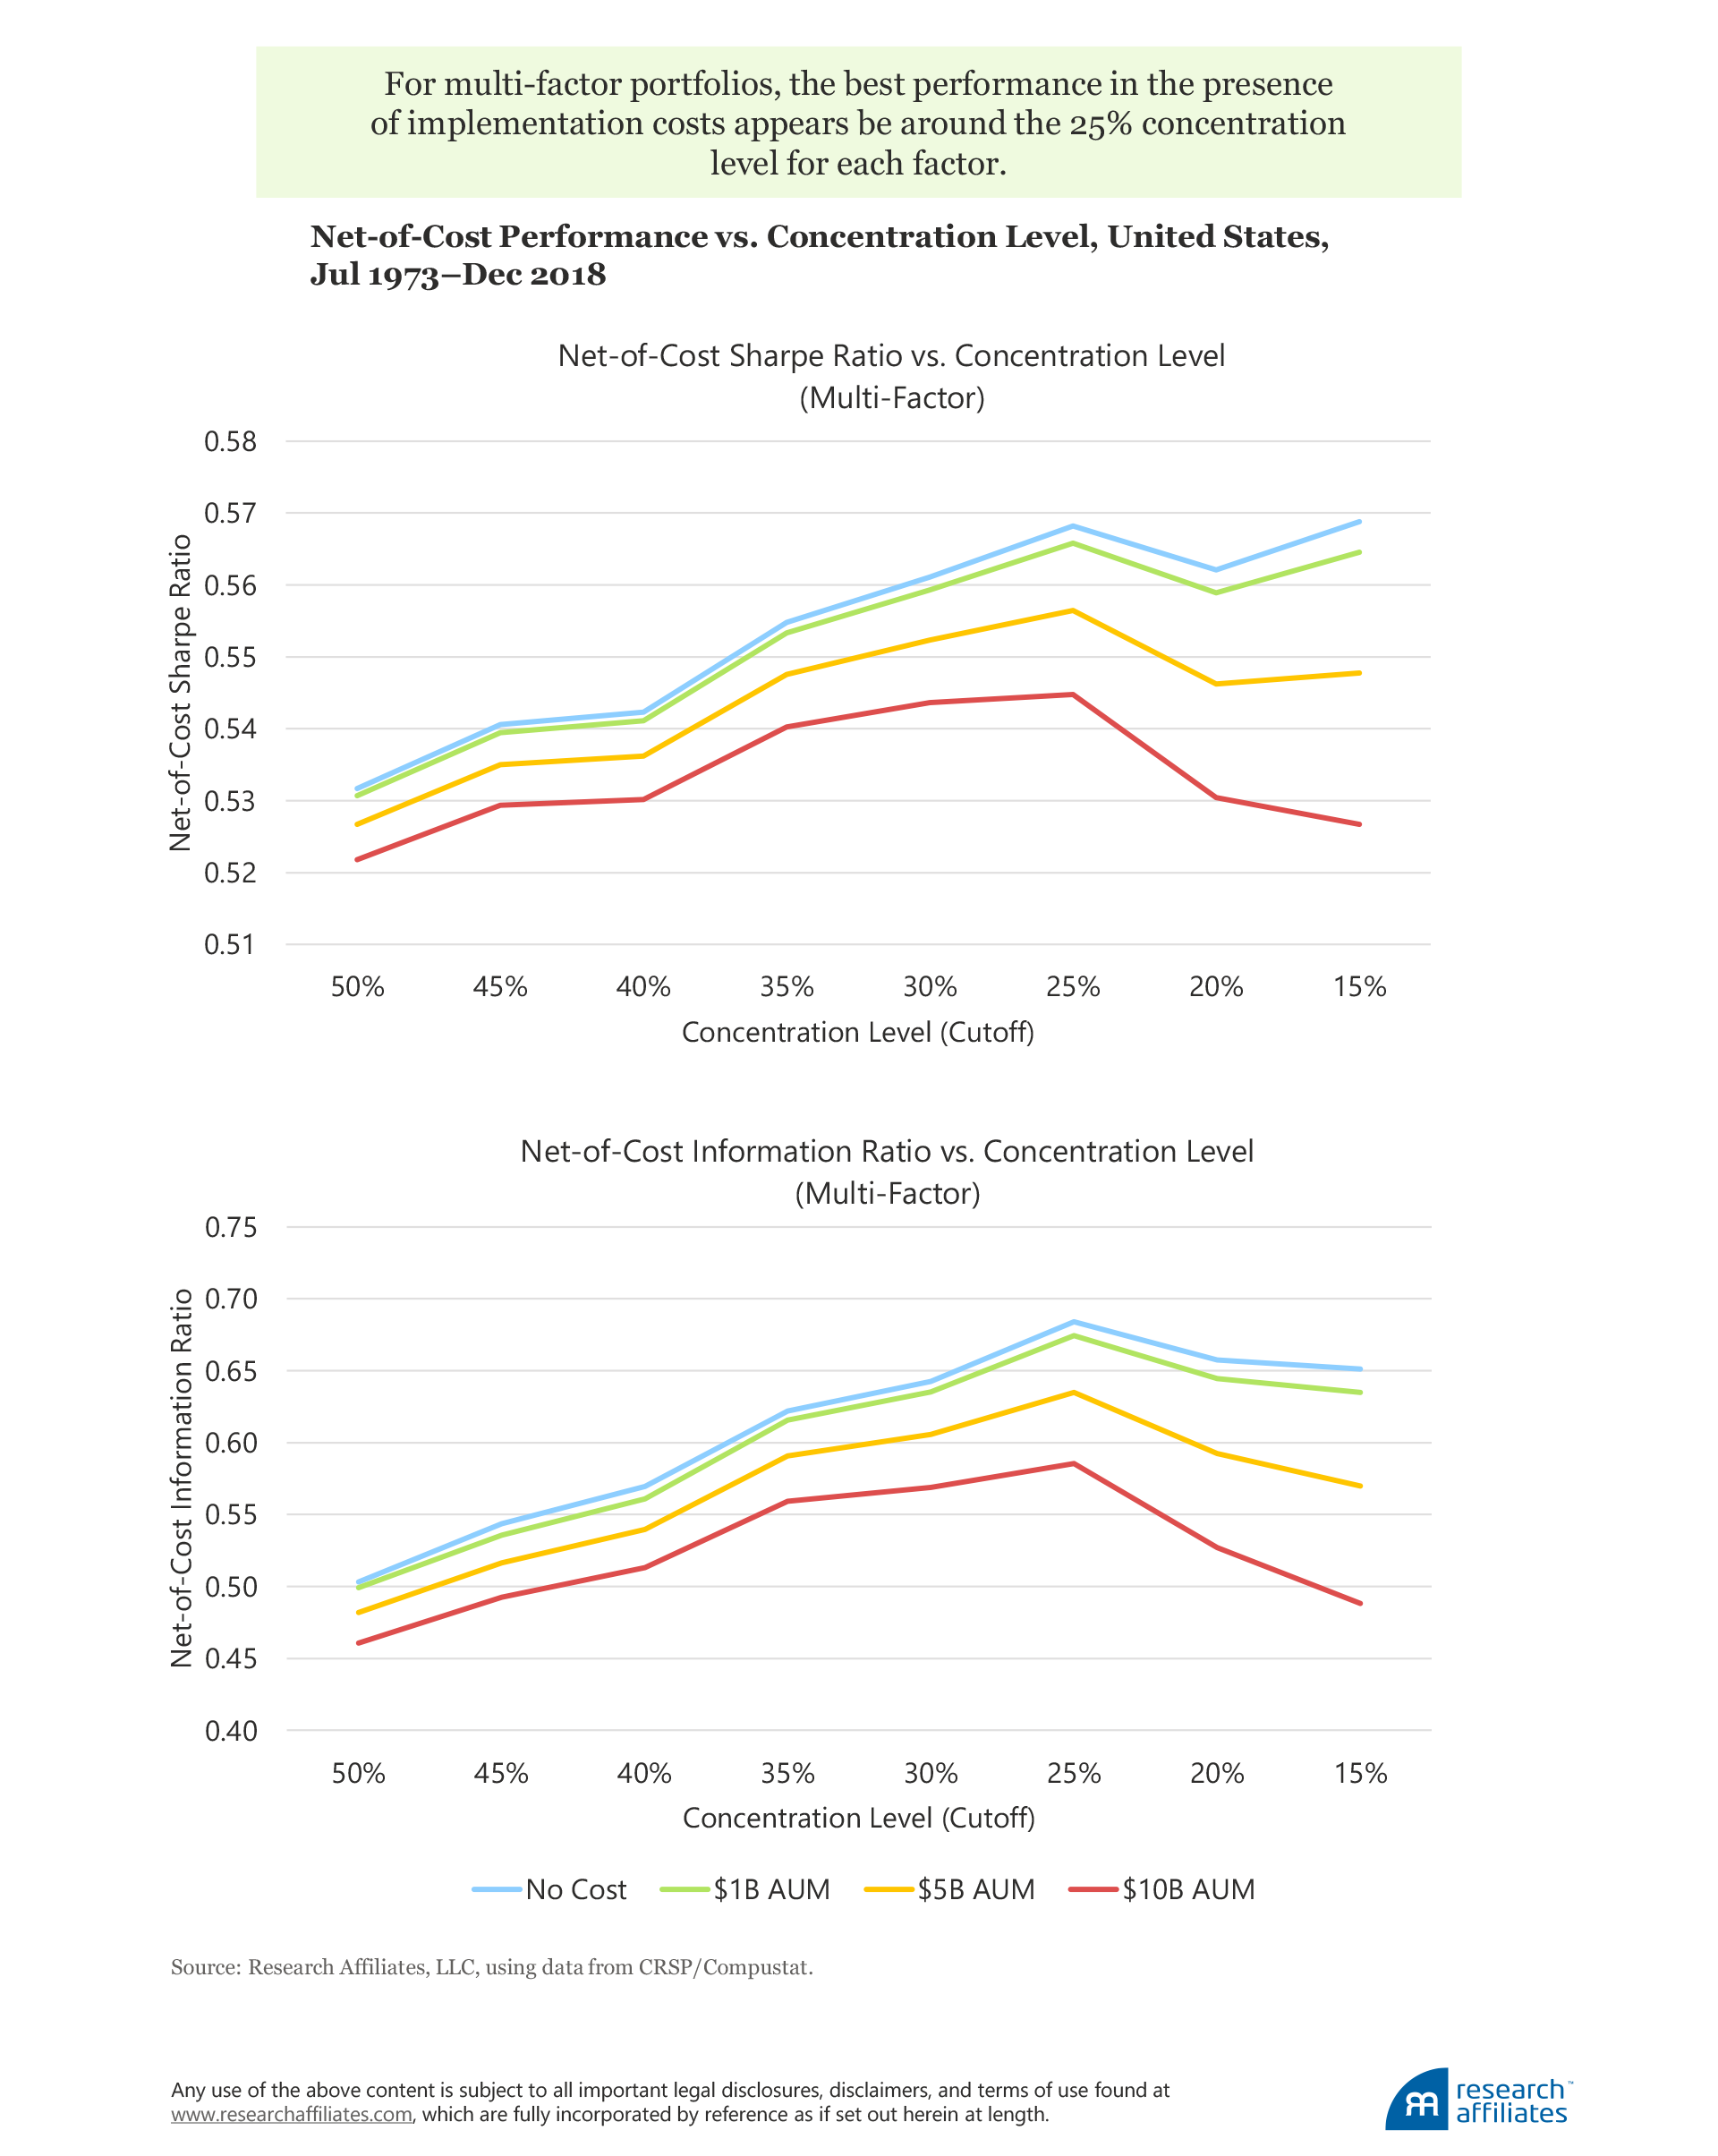
Striking the right balance between performance and implementation cost becomes much more important at higher concentration levels because of the larger impact of trading costs on the Sharpe ratio and the IR. At higher concentration levels, the turnover, turnover concentration, and tilt of the multi-factor strategy all tend to increase, while the portfolio volume decreases, leading to higher implementation costs. Higher concentration levels offer fewer offsetting trades that cancel each other out and, therefore, has less impact on lowering turnover. Consequently, implementation costs take a bigger bite out of performance in more-concentrated strategies, especially at larger AUM. At $1B AUM, the net-of-cost Sharpe ratio monotonically increases from the 50% to 25% concentration level and then flattens out, but at $5B and $10B AUM, declines rapidly beyond the 25% concentration level. And, at $10B AUM, the net-of-cost information ratio is 0.49 for the highly concentrated portfolio (with a 15% cutoff) compared to 0.59 for the less-concentrated portfolio (with a 25% cutoff).

To summarize, based on our analysis, we find the best performance in the presence of implementation costs to be around the 25% concentration level. If we only focus on empirical evidence, the optimal cutoff level may differ across individual factor portfolios. The goal of our analysis, however, is to most effectively capture the factor premium at a reasonable cost through a simple, transparent, and rules-based approach. Lacking a strong reason for the individual factor portfolios to be constructed using different concentration levels, we suggest investors avoid overfitting risk and use consistent coverage across all factors included in the multi-factor portfolio.
Striking the Right Balance
As investors’ interest in multi-factor smart beta investing grows, understanding how to optimally combine factors in the presence of real-world implementation costs is critical for desirable investment outcomes. Our analysis examines how best to gain the excess returns associated with factors balanced against the impact of implementation cost, considering portfolio concentration, turnover, trading cost, and capacity as crucial elements in multi-factor smart beta product design.
The momentum and size factors, perhaps surprisingly, are helpful components in a multi-factor smart beta strategy. A stand-alone momentum strategy’s high turnover generates intimidatingly high trading costs, under reasonably large AUM assumptions, and can wipe out the factor’s typically high expected value-add on paper. A size strategy is normally believed to have high implementation costs because of small-cap stocks’ lower liquidity and higher market impact in trading. When added to a multi-factor strategy, however, these detracting qualities become benefits if we strike the right balance in portfolio construction.
The addition of momentum helps lower tracking error and improves the IR because of negative or low positive correlations with other factors. These benefits are achieved without a large increase in implementation cost because offsetting trades across the factor strategies cancel each other out and because of the improved liquidity of the stocks held in a momentum strategy.
The size factor is actually rather inexpensive to trade because of its relatively broad coverage and low turnover. Thus, adding the size factor to the combination of other factors can improve the performance, and lower the tracking error, of the multi-factor strategy given the low correlation of size with the other factors, resulting in a higher IR together with a reduction in trading cost.
We find that using more-concentrated underlying factor portfolios in constructing a multi-factor strategy can improve the strategy’s performance. These benefits come, however, at the expense of higher volatility, tracking error, turnover, and trading cost. Our analysis suggests that a 25% concentration level for each factor typically produces the best risk-adjusted performance in the presence of implementation costs.
Neither extreme of maximizing paper portfolio performance, while ignoring the trading costs that reduce performance in practice, nor of focusing on low-cost implementation, while missing opportunities for better performance, will produce an optimal result for multi-factor smart beta investors. We strongly advocate the thoughtful design of a multi-factor strategy, which requires a conscious and deliberate decision to find the most advantageous balance between effectively harvesting the factor premium and implementation cost.
This article is based on “Trade-Off in Multifactor Smart Beta Investing: Factor Premium and Implementation Cost,” Journal of Portfolio Management, Quantitative Special Issue, vol. 4, no. 3 (2019):115–124.
Appendix: Factor-Based Smart Beta Construction Methodology
To construct our portfolios in the United States, we use the universe of US stocks from the CRSP/Compustat database. We define the US large-cap equity universe as stocks whose market capitalizations are greater than the median market capitalization on the NYSE, and the small-cap universe as stocks whose market capitalizations are smaller than the NYSE median. The US data extend from July 1973 through December 2018.
The factor-based smart beta portfolios, except the small size strategy, are constructed from the large-cap universe. For each of the factor characteristics in these portfolios, we use the top 30% of the NYSE as a breakpoint. For example, we construct the value portfolio from stocks above the 70th percentile on the NYSE by book-to-market ratio. Our small-size strategy consists of all the available stocks in the small-cap universe. We then capitalization weight the selected stocks except for low beta, which we weight by beta ranking. The portfolios are rebalanced annually each July, except for momentum and low beta, which are rebalanced quarterly.
The signals used to sort the various factor-based smart beta portfolios are:
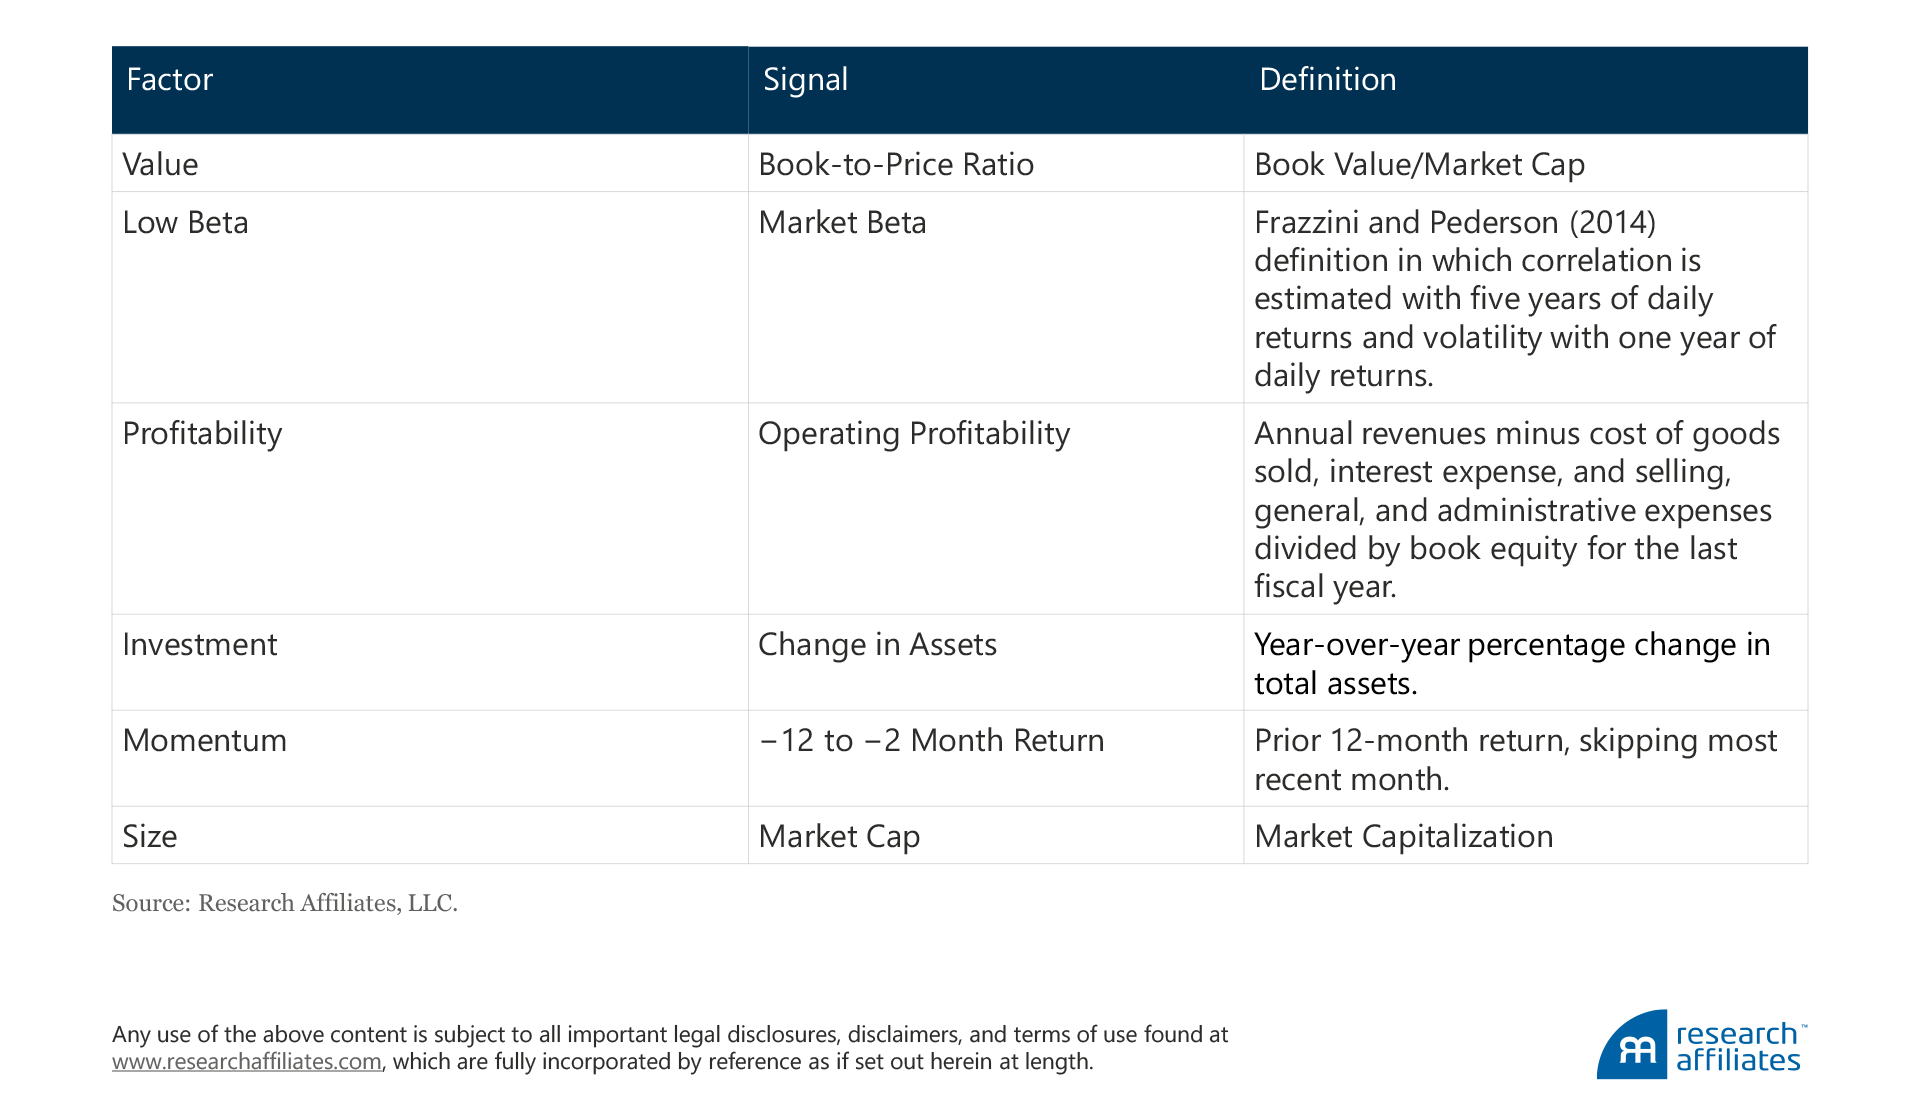

End Notes
1. Among others, Asness, Moskowitz, and Pedersen (2013) and Asness et al. (2015) document the diversification benefit of combining multiple factors with low correlation to each other.
2. We report the recent five-year average of the estimated trading costs instead of the historical average based on the entire sample. The trading volume has been increasing exponentially since the explosion of electronic trading in late 1990s. Therefore, the current estimate is a much better representation of the expected trading cost than the historical average, which should be unreasonably high by today’s standards.
References
Aked, Michael, and Max Moroz. 2015. “The Market Impact of Passive Trading.” Journal of Trading, vol. 10, no. 3 (Summer):5–12.
Asness, Clifford S., Antti Ilmanen, Ronen Israel, and Tobias J. Moskowitz. 2015. “Investing with Style.” Journal of Investment Management, vol. 13, no. 1 (First Quarter): 27–63.
Asness, Clifford S., Tobias J. Moskowitz, and Lasse Heje Pedersen. 2013 “Value and Momentum Everywhere.” Journal of Finance, vol. 68, no. 3 (June): 929-985.
Brightman, Chris, Vitali Kalesnik, Feifei Li, and Joseph Shim. 2017. “A Smoother Path to Outperformance with Multi-Factor Smart Beta Investing” Research Affiliates Publications (January).
Carhart, Mark. 1997. “On Persistence in Mutual Fund Performance.” Journal of Finance, vol. 52, no. 1 (March):57–82.
Fama, Eugene, and Kenneth French. 1993. “Common Risk Factors in the Returns on Stocks and Bonds.” Journal of Financial Economics, vol. 33:3–56.
———. 2012. “Size, Value, and Momentum in International Stock Returns.” Journal of Financial Economics, vol. 105, no. 3 (September):457–472.
———. 2016. “Dissecting Anomalies with a Five-Factor Model.” Review of Financial Studies, vol. 29, no. 1 (January):69–103.
Frazzini, Andrea, and Lasse Heje Pedersen (2014). “Betting Against Beta.” Journal of Financial Economics, vol. 111, no. 1 (January): 1–25.
Hsu, Jason, Vitali Kalesnik, and Engin Kose. 2019. “What Is Quality?” Financial Analysts Journal, vol. 75, no. 2 (Second Quarter): 44–61.
