
We define and study the alternative risk premia (ARP) universe through four distinct core strategy types: equity neutral, volatility, trend, and macro.
We believe that a host of underlying drivers, which include rising price volatility, individual factor investing risks, and implementation shortfall, among others, has contributed to the widespread underperformance of ARP strategies in 2018.
Investors who select investments with robust and straightforward approaches, diversify their exposure across uncorrelated strategies, and appropriately calibrate their shorter-term performance expectations are more likely to exploit the long-term opportunity offered by ARP investing.
“The Chinese use two brush strokes to write the word ‘crisis.’ One brush stroke stands for danger; the other for opportunity. In a crisis, be aware of the danger—but recognize the opportunity.” —John F. Kennedy
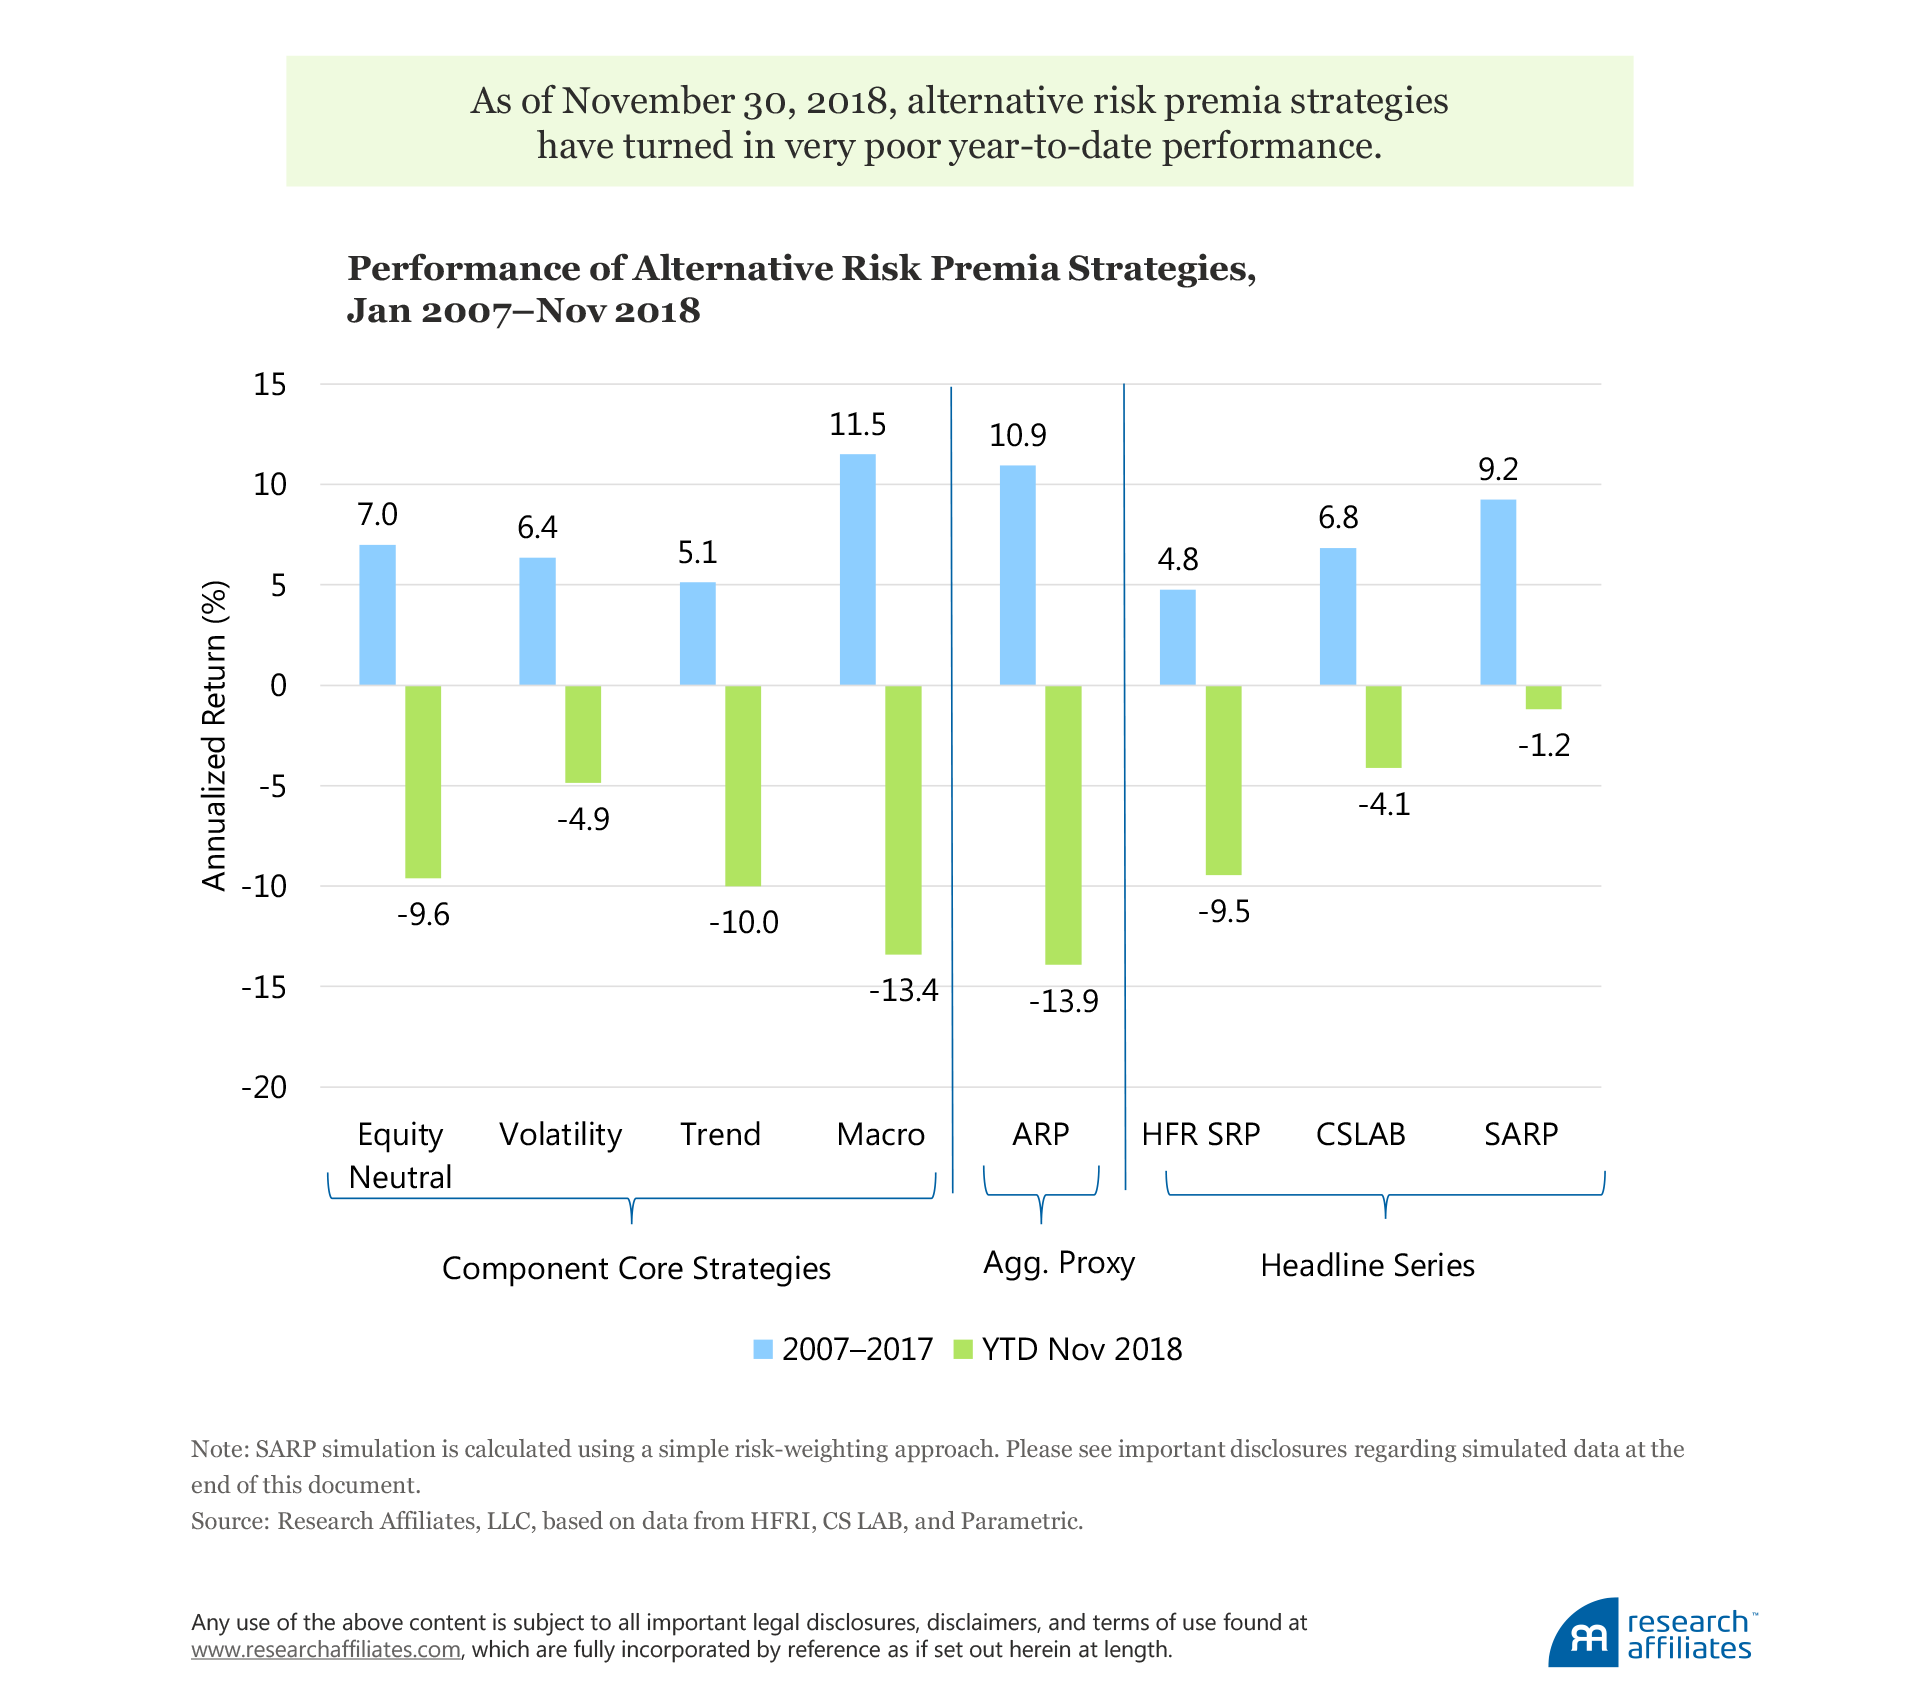
The year 2018 has been a difficult one for the broad alternative risk premia (ARP) market. Not only have these strategies lagged conventional 60/40 investing, their year-to-date negative performance has been widespread within the ARP market. The core strategies of ARP investing—equity neutral, volatility, trend, and macro—are struggling across the board.1 This seemingly pervasive performance rut is disappointing and somewhat unusual, not having previously occurred in any calendar year over the last decade.
Perhaps a reason these results are mysterious and perturbing is that they run counter to promises and expectations. A darling of the investment industry, ARP strategies have been attracting abundant attention and capital in recent years. By harvesting robust risk premia across asset classes and strategies, ARP proliferators tout the ability to deliver strong risk-adjusted returns with low correlations to traditional asset classes, all at far lower costs and greater transparency than hedge funds.
We owe it to ourselves to try to understand what underpins the returns provided by core ARP strategies. A clearer understanding can be a guide for better decision making, particularly in times that are conducive to knee-jerk reactions to portfolio underperformance. Accordingly, we view the extensive ARP universe as categorized into four distinct strategy types commonly employed by ARP solutions. Building representative proxies of these strategy types based on publically available data allows us to study the proxies’ underlying return drivers.
Our exploration leads us to a few overarching takeaways. We believe that to maximize the long-term benefits of ARP investments, investors should select strategies with a robust and straightforward approach, diversify their exposure across uncorrelated investments, and carefully calibrate their expectations around shorter-term outcomes.
Core ARP Strategies: Data, Categorization, and Construction
One of our goals is to identify key return sources underlying the sprawling ARP universe. We begin with the sources of data used in our exploration. We then discuss both why and how we study the ARP universe within a framework of four core strategy groups: equity neutral, volatility, trend, and macro.
To survey a wide universe of liquid hedge fund returns and risk premia strategies, we turn to two well-established index benchmark providers for the alternative index arena: Credit Suisse and Hedge Fund Research (HFR). The Credit Suisse Liquid Alternative Beta Index (CS LAB) series is a set of methodical, liquid strategies that seeks to replicate the return of the overall hedge fund industry. The series reflects the combined return of six Credit Suisse strategy indices: Event Driven Liquid Index, Global Strategies Liquid Index, Long/Short Liquid Index, Managed Futures Liquid Index, and Merger Arbitrage Liquid Index.
The HFR Bank Systematic Risk Premia Indices (HFR SRP) reflect the performance of an aggregate of investible risk premia strategies. Purporting to represent over 1,100 strategies offered by a range of investment banks and asset managers, the strategies are categorized across six main asset classes: commodity, credit, currency, equity, rates, and multi-asset. Within each of the six asset classes, our focus is on the volatility, carry, momentum, and value subseries. We winnow down the list of 43 substrategies to 29.
Armed with individual index series data, we organize the ARP universe into core strategy types, each exhibiting a reasonably similar set of return drivers and construction characteristics. Fortunately, a traditional hedge fund classification system offers a natural starting point. We begin with the main strategy types of the HFR hedge fund classification system: equity hedge, event driven, relative value, and macro.2
Our first core strategy group is a simple renaming of the equity hedge category to equity neutral. The strategies within this core strategy group exploit empirically and academically robust cross-sectional factors within equity markets. These factors include value, momentum, quality, low beta, size, and investment. We actively monitor and forecast each of these factors in the US, developed, and emerging markets in the Research Affiliates Smart Beta Interactive (SBI) tool.
For our second core strategy group, we combine the event driven and relative value strategies and refer to this as volatility. Why? We observe highly correlated long-term returns between these strategy types, which suggests a common return driver: price volatility. Academic research findings support the idea that various hedge fund strategies, particularly those labeled as event driven, merger arbitrage, global strategies, volatility, or relative value, largely derive their returns from selling volatility. Lo (2001) outlines such an investment strategy, employed by a hypothetical hedge fund called Capital Decimation Partners, LP, which sports the track record of what seems to be a widely successful hedge fund.3 Who would have guessed this strategy simply involves collecting an insurance premium through shorting out-of-the-money puts? Indeed, as Lo discusses, the lack of position transparency offered by hedge fund managers masks the truth that many hedge funds are based on straightforward volatility-selling approaches. Likewise, many arbitrage strategies, which are generally rewarded upon the successful completion of an announced merger, derive their return by selling volatility.4
Next, in contrast to aggregating the event driven and relative value strategies into a single volatility category, our third and fourth core strategy groups are derived from disaggregating the HFR macro classification into a trend strategy group and a macro strategy group. The trend strategy group consists of managed futures, trend-following, and commodity trading advisor strategies. Such strategies are built around the characteristics of time series momentum,5 which leads to highly variable market beta exposure. Finally, the macro strategy category comprises all remaining cross-sectional6 macro strategies that seek to exploit carry, value, and momentum premia within structures having market beta (and net) exposure of zero or close to it.
To construct the representative proxies for each core strategy, we use the applicable underlying series from Credit Suisse and HFR, scaling each constituent series to equal levels of volatility. From there, we equally weight each constituent to form each core strategy’s return series, which is again scaled to a 10% volatility level. We then derive an aggregate proxy for the full ARP universe (which we refer to as the alt risk premium) as an equal volatility–weighted series of these four strategy returns. We provide the methodology and constituent weights of the alt risk premium proxy in the appendix.
Lastly, we study three multi-asset, multi-style headline series. The first two are the HFR and the Credit Suisse headline indices scaled to 10% volatility, which we refer to as HFR SRP and CS LAB. The third is the Research Affiliates Systematic Alternative Risk Premia (SARP) strategy.7 In short, SARP harvests the returns offered by three of the four core ARP categories8 by allocating to carry, value, and trend premia across stock, bond, currency, commodity, and volatility markets (Brightman and Shepherd, 2016).
Results: Performance Characteristics
Our study begins in 2007. Although we would prefer a horizon longer than 10 years, we are limited by data availability. Many of the underlying HFR index series returns are available only within the last decade. Moreover, most of the return series we observe are prior to the issuance of the index series and are backfilled to generate a longer, but uninvested, history. Readers would be wise to keep this in mind if tempted to extrapolate this historical experience into the future.
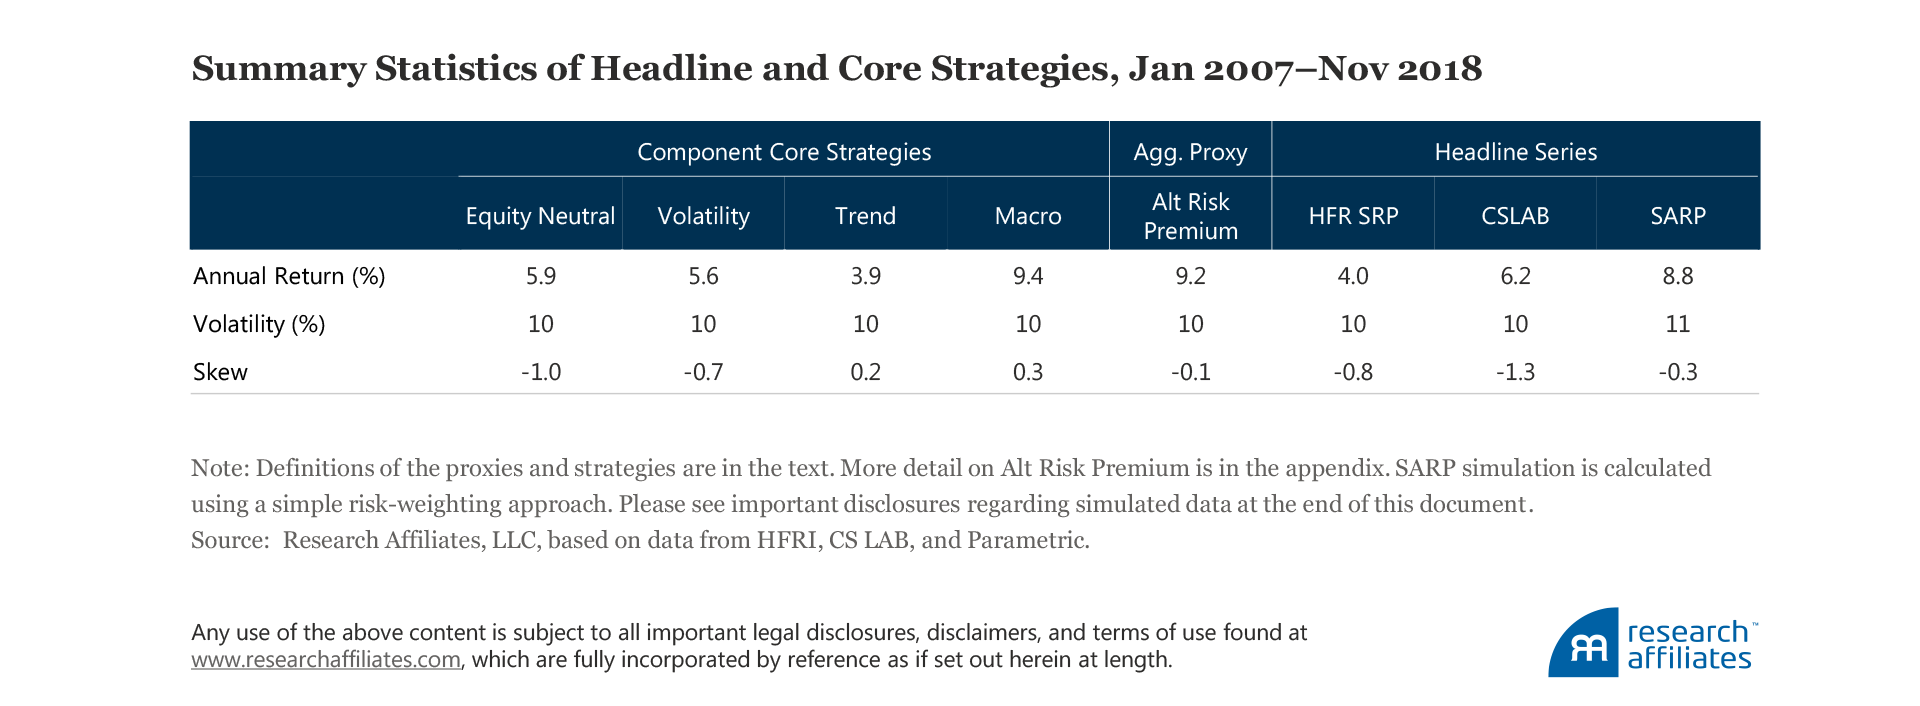
Over the 10-year span, each of the four component core strategies generated a respectable annualized return, ranging from 3.9% (trend) to 9.4% (macro). The alt risk premium proxy (9.2%) and the other headline series delivered annualized returns ranging from 4.0% (HFR SRP) to 8.8% (SARP). In contrast, a conventional global 60/40 portfolio delivered a return of 4.8% a year over the same time span.9
When we narrow the aperture to year-to-date November 30, 2018, the returns of each core and headline strategy paint a dismally different picture. All four core component strategies delivered negative returns, from −4.9% (volatility) to −13.4% (macro), and the ARP proxy and two headline series are on track to deliver their worst calendar-year losses since the global financial crisis. The SARP strategy is not immune to disappointing results either: its slightly negative return through November 2018 falls well short of the historical average. Later, we will return to the performance of SARP and the headline series, but now we will look more closely at each core ARP strategy.
Return Drivers of Core ARP Strategies
The often-vaunted benefit of ARP investments is that they are internally, as well as, externally diversified. In other words, not only do investors expect ARP investments to serve as a diversifying return driver, complementing the traditional assets that typically make up the bulk of their portfolios, but they also expect the substrategies to exhibit low, and even negative, correlation to each other. Naturally, the substrategies’ synchronized underperformance in 2018 raises doubt around this statement, so let’s review each core strategy group within the ARP universe.
Equity neutral strategies
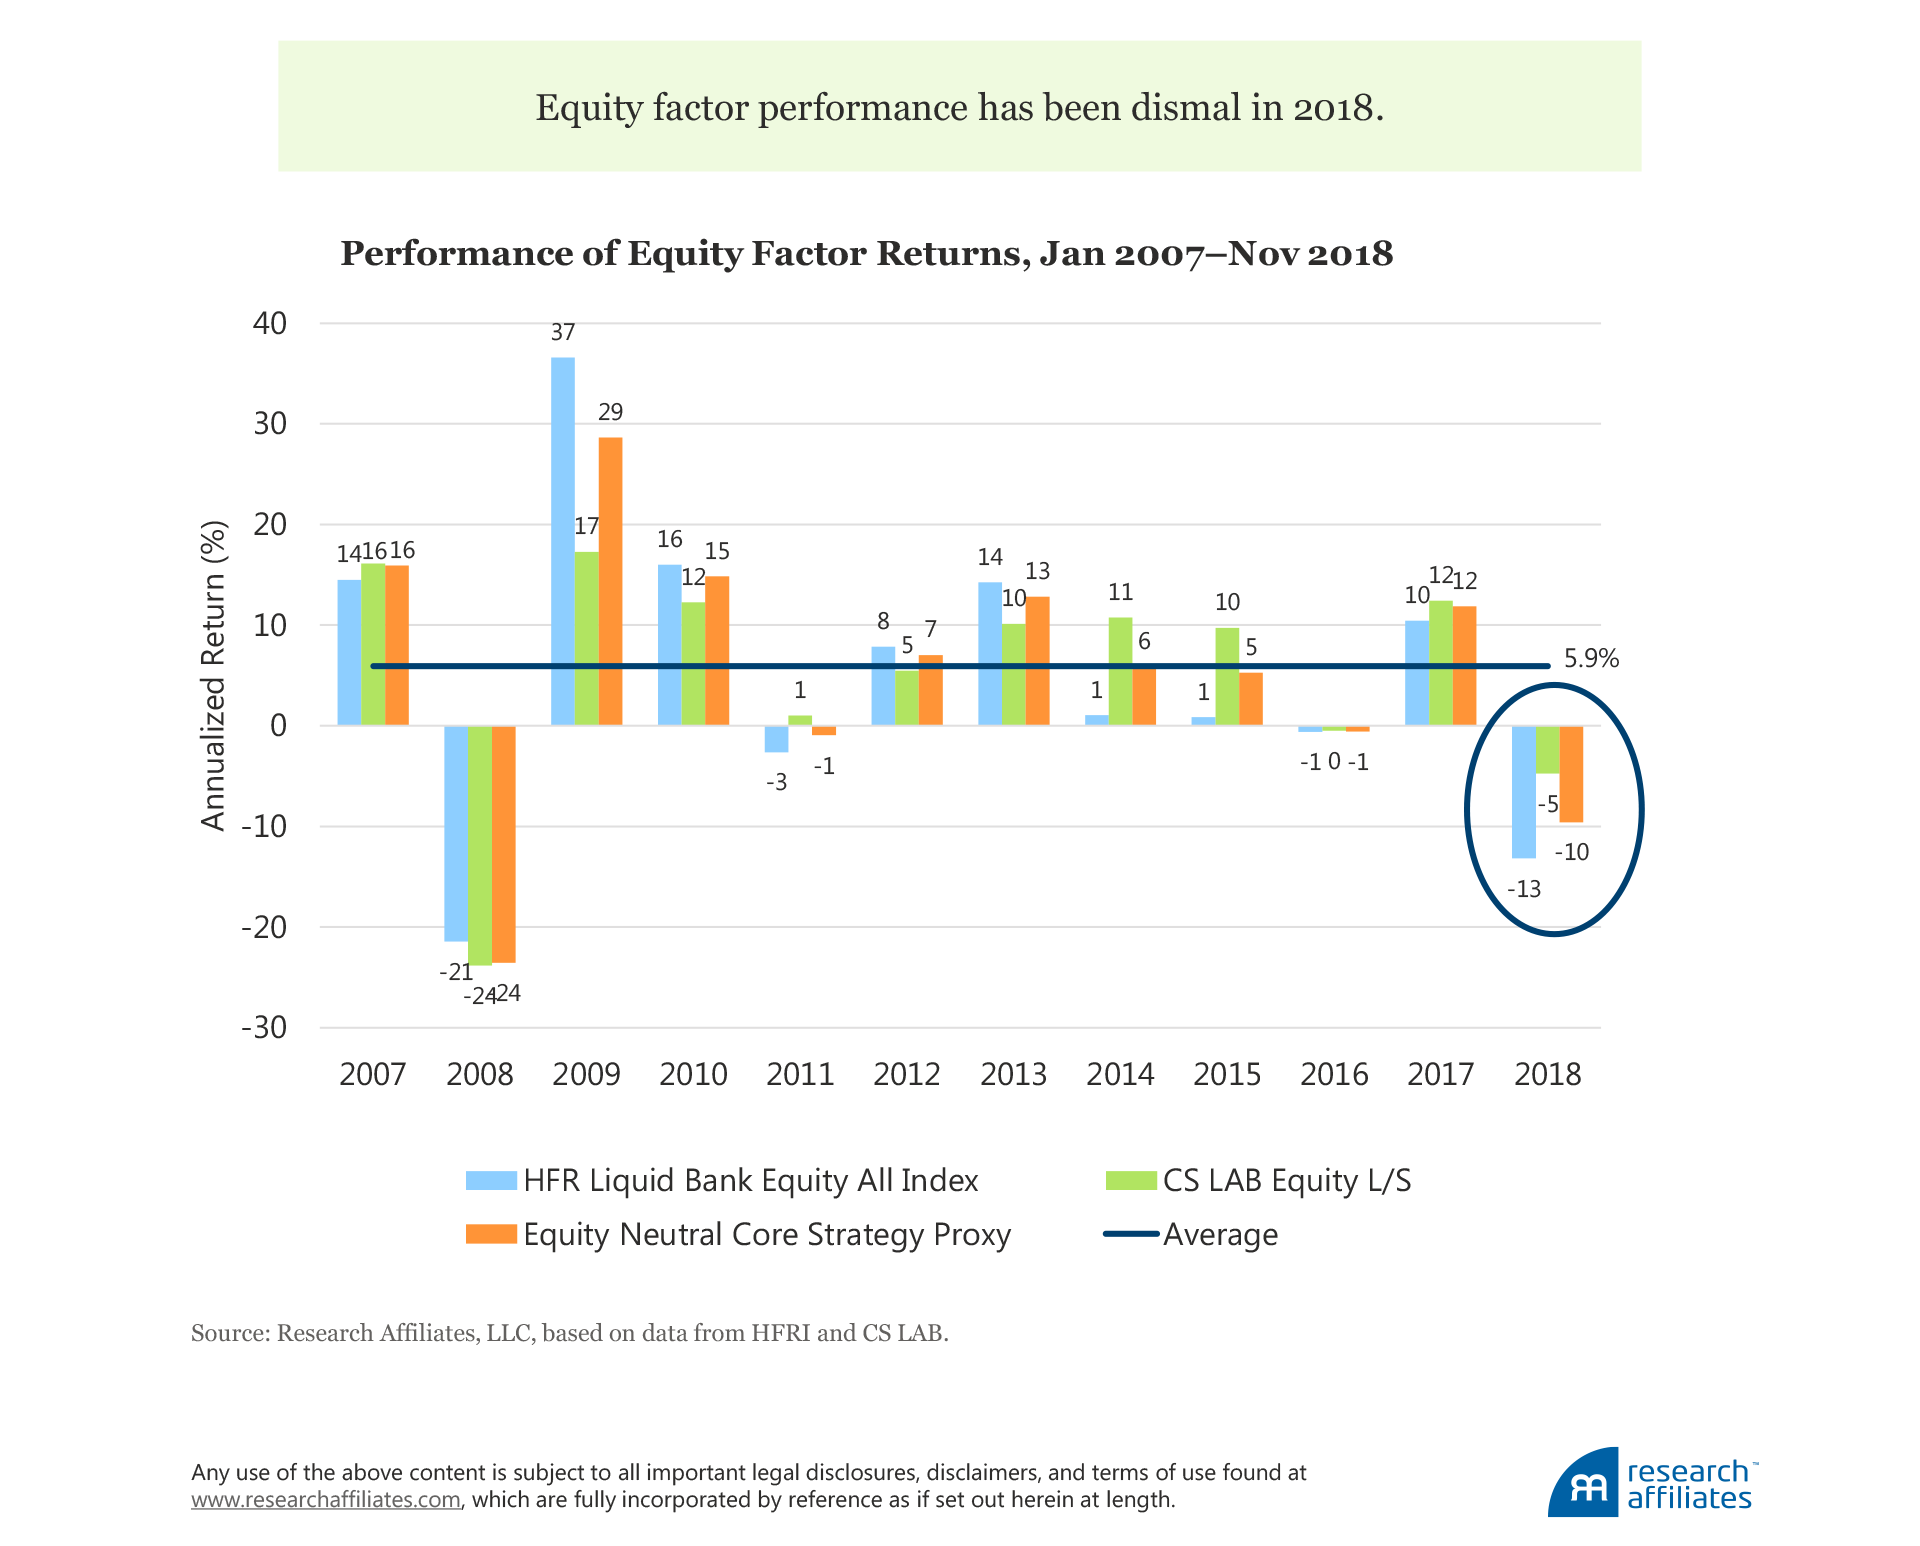
The first core ARP strategy group, equity neutral strategies, is represented by the Credit Suisse (CS) Long/Short Liquid Index and the HFR Bank Systematic Risk Premia Equity Index. The CS series represents long–short equity hedge funds in the CS Hedge Fund Index. The HFR SRP Equity Index series is a composite of HFR SRP equity styles: low beta, low volatility, momentum, multi-style, quality, size, smart beta, value, and volatility.
Since 2007, the average annualized return of the equity neutral category is 5.9%. This full-horizon performance stands in sharp contrast to November 30, 2018, year-to-date losses of −9.6% for the category; the constituent returns for the year-to-date period are roughly −5.0% for the CS Long/Short Liquid Index and −13.0% for the HFR SRP Equity Index. The performance of both sub-indices through the first 11 months of 2018 falls within or hovers near the worst decile rank of all historical 11-month rolling returns over the past decade.
When we view performance results within the context of the potential risks inherent in equity factor investing, recent outcomes are not as alarming as they appear. As our colleagues Kalesnik and Linnainmaa (2018) highlight, the return distributions of various equity factors generally exhibit negative skew and fat tails, and factor returns tend to be serially correlated. Combinations of equity factors can still result in extensive and severe periods of underperformance because correlations across factors are not constant over time and many factors may be exposed to similar risk drivers. Finally, factor-based strategies are not immune to data mining, definition sensitivity, or the negative impact of trading costs and high turnover, the last two being traits notoriously associated with the momentum factor.
Despite these inherent risks, we maintain conviction that robust, properly combined, and efficiently implemented equity factors have the potential to deliver value for the patient investor. Our colleagues have written extensively on the link between factor valuations and subsequent excess return potential.10 While 2018 has brought underperformance in the factors we track, valuations have cheapened for factors such as value and quality.
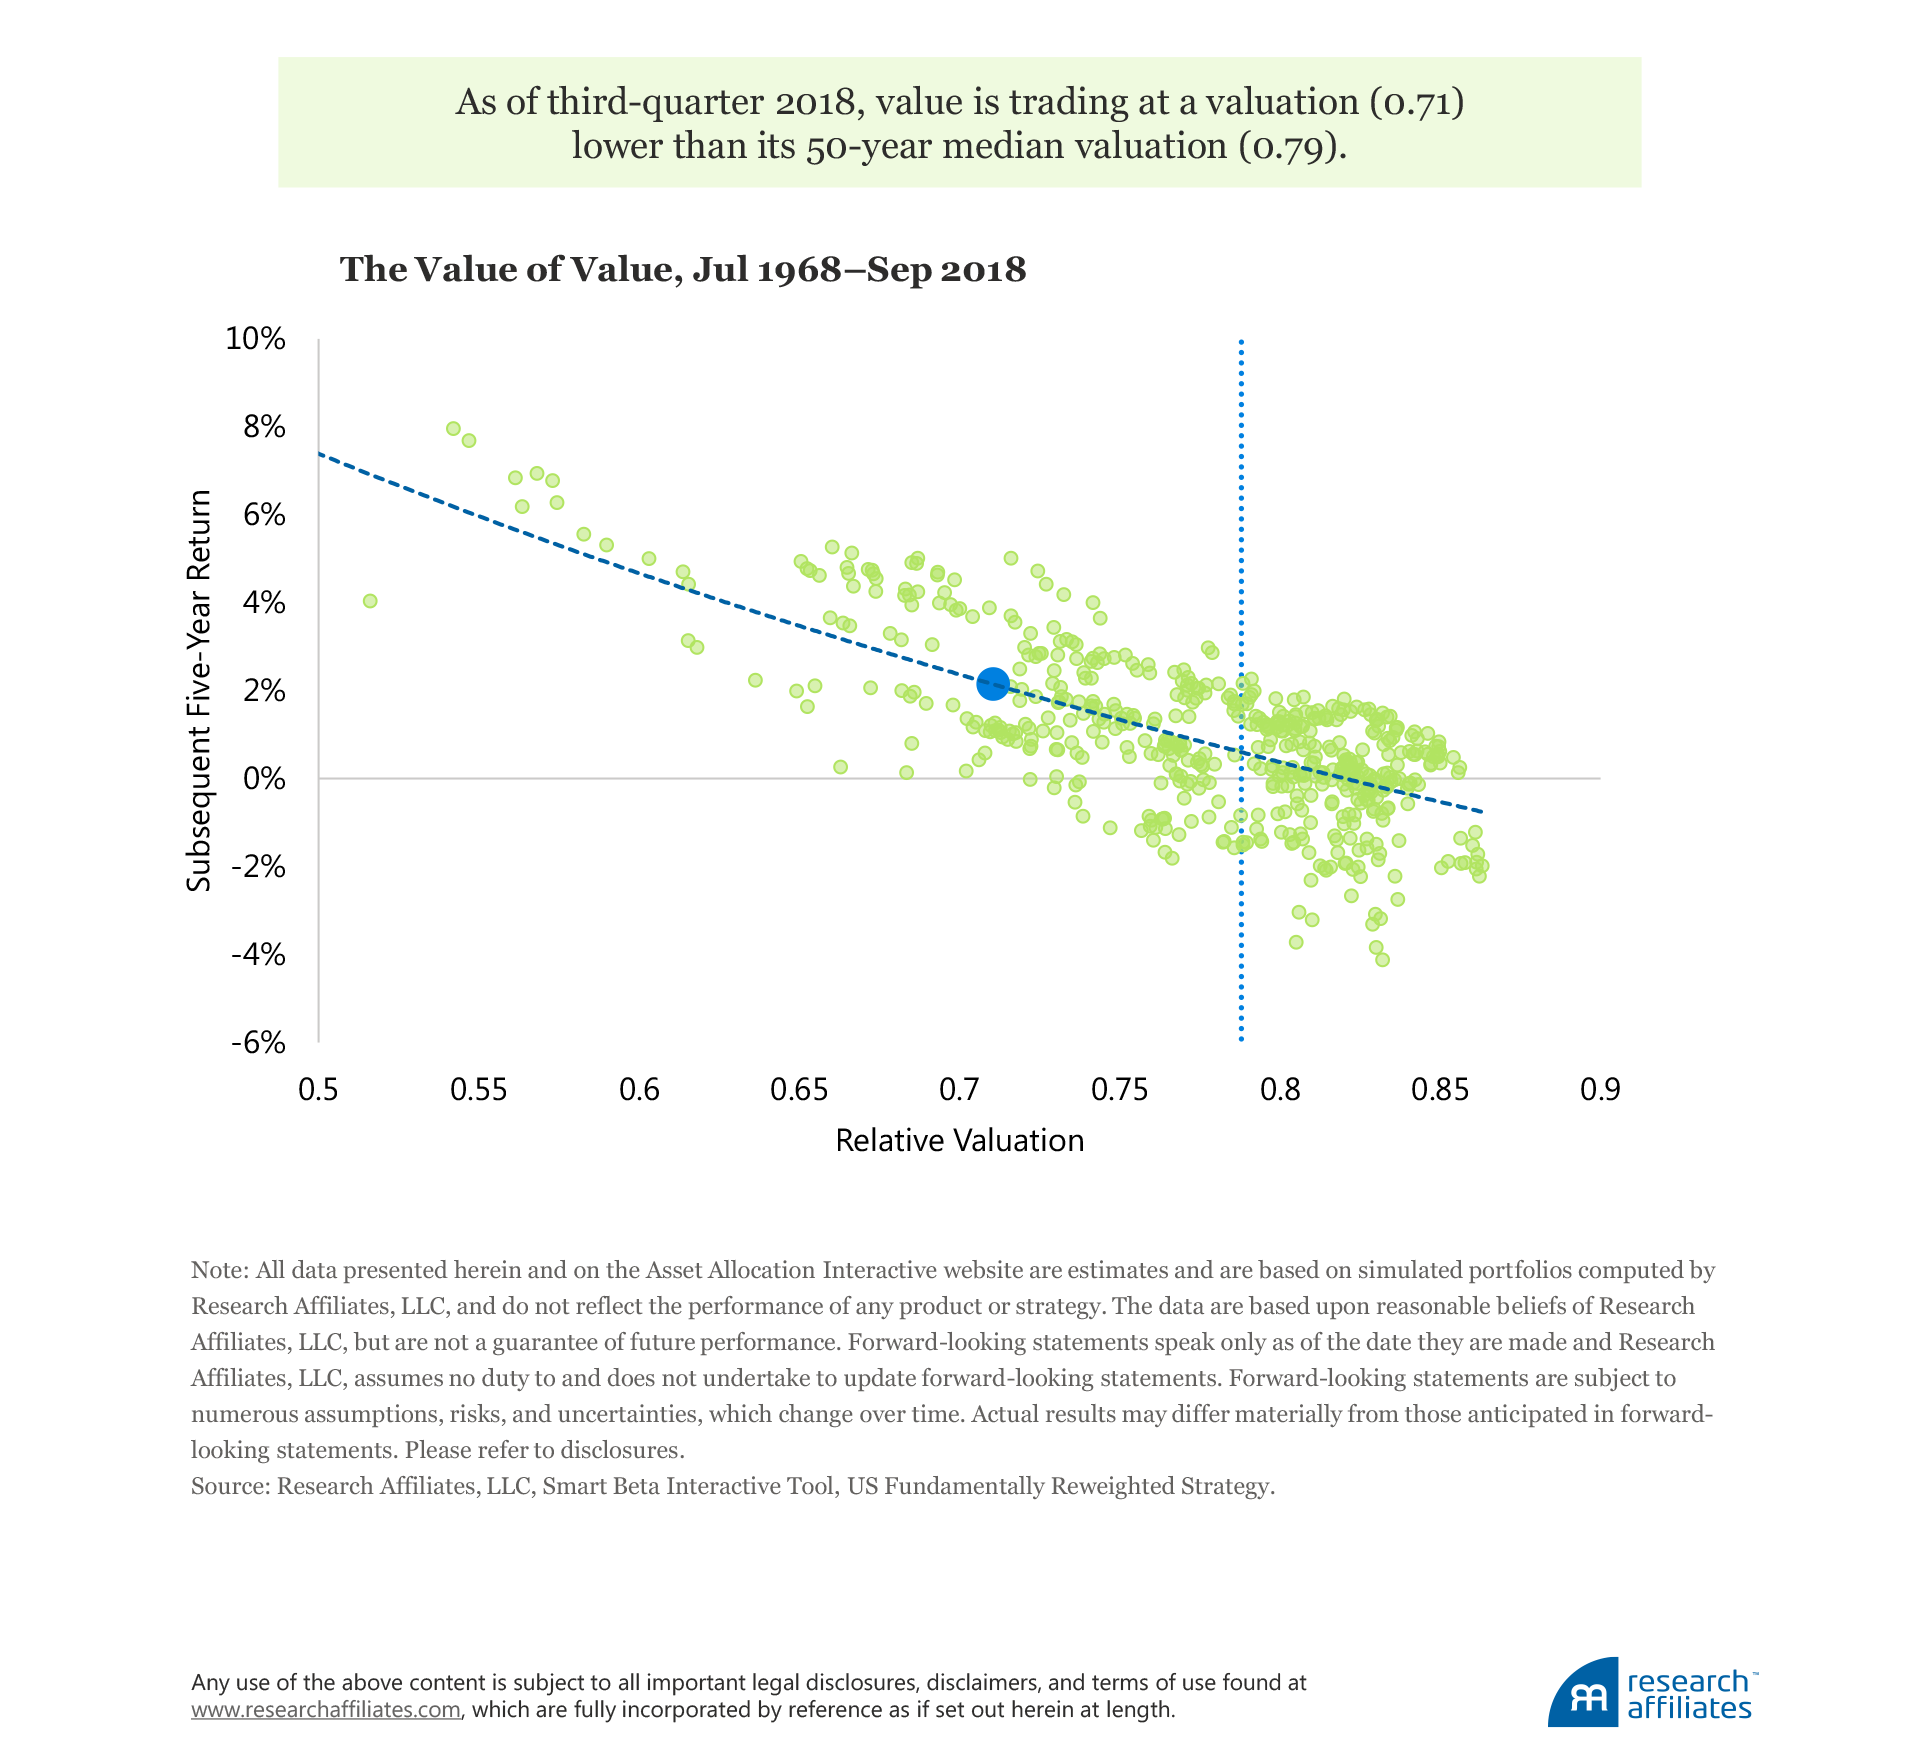
Consider the current valuation for a composite derivation of an investable US value strategy, as tracked by the Smart Beta Interactive (SBI) tool. As of September 30, 2018, the valuation of such exposure was 0.71.11 In other words, this value-oriented approach traded at 71% of the valuation of the capitalization-weighted benchmark. Of course, value strategies should always trade at a discount to the growth orientation of passive exposure, but the current valuation is materially lower than its 50-year median of 0.79. Today’s elevated valuation discount implies a forward-looking five-year annualized return of nearly 2.5% over the passive benchmark. Similar analysis is available for other equity strategies on SBI. As of September 30, 2018, quality strategies also appear to be attractive, but low volatility and momentum strategies are, on average, priced for potential return headwinds.
Craftsmanship in investing, which includes harvesting robust and attractively priced equity factors in a friction-sensitive way, matters. Inclusive of borrowing, transaction, and implicit trading costs, we forecast that a well-designed multi-factor strategy should deliver an annualized information ratio of approximately 0.7 over the next five years.12
Volatility strategies
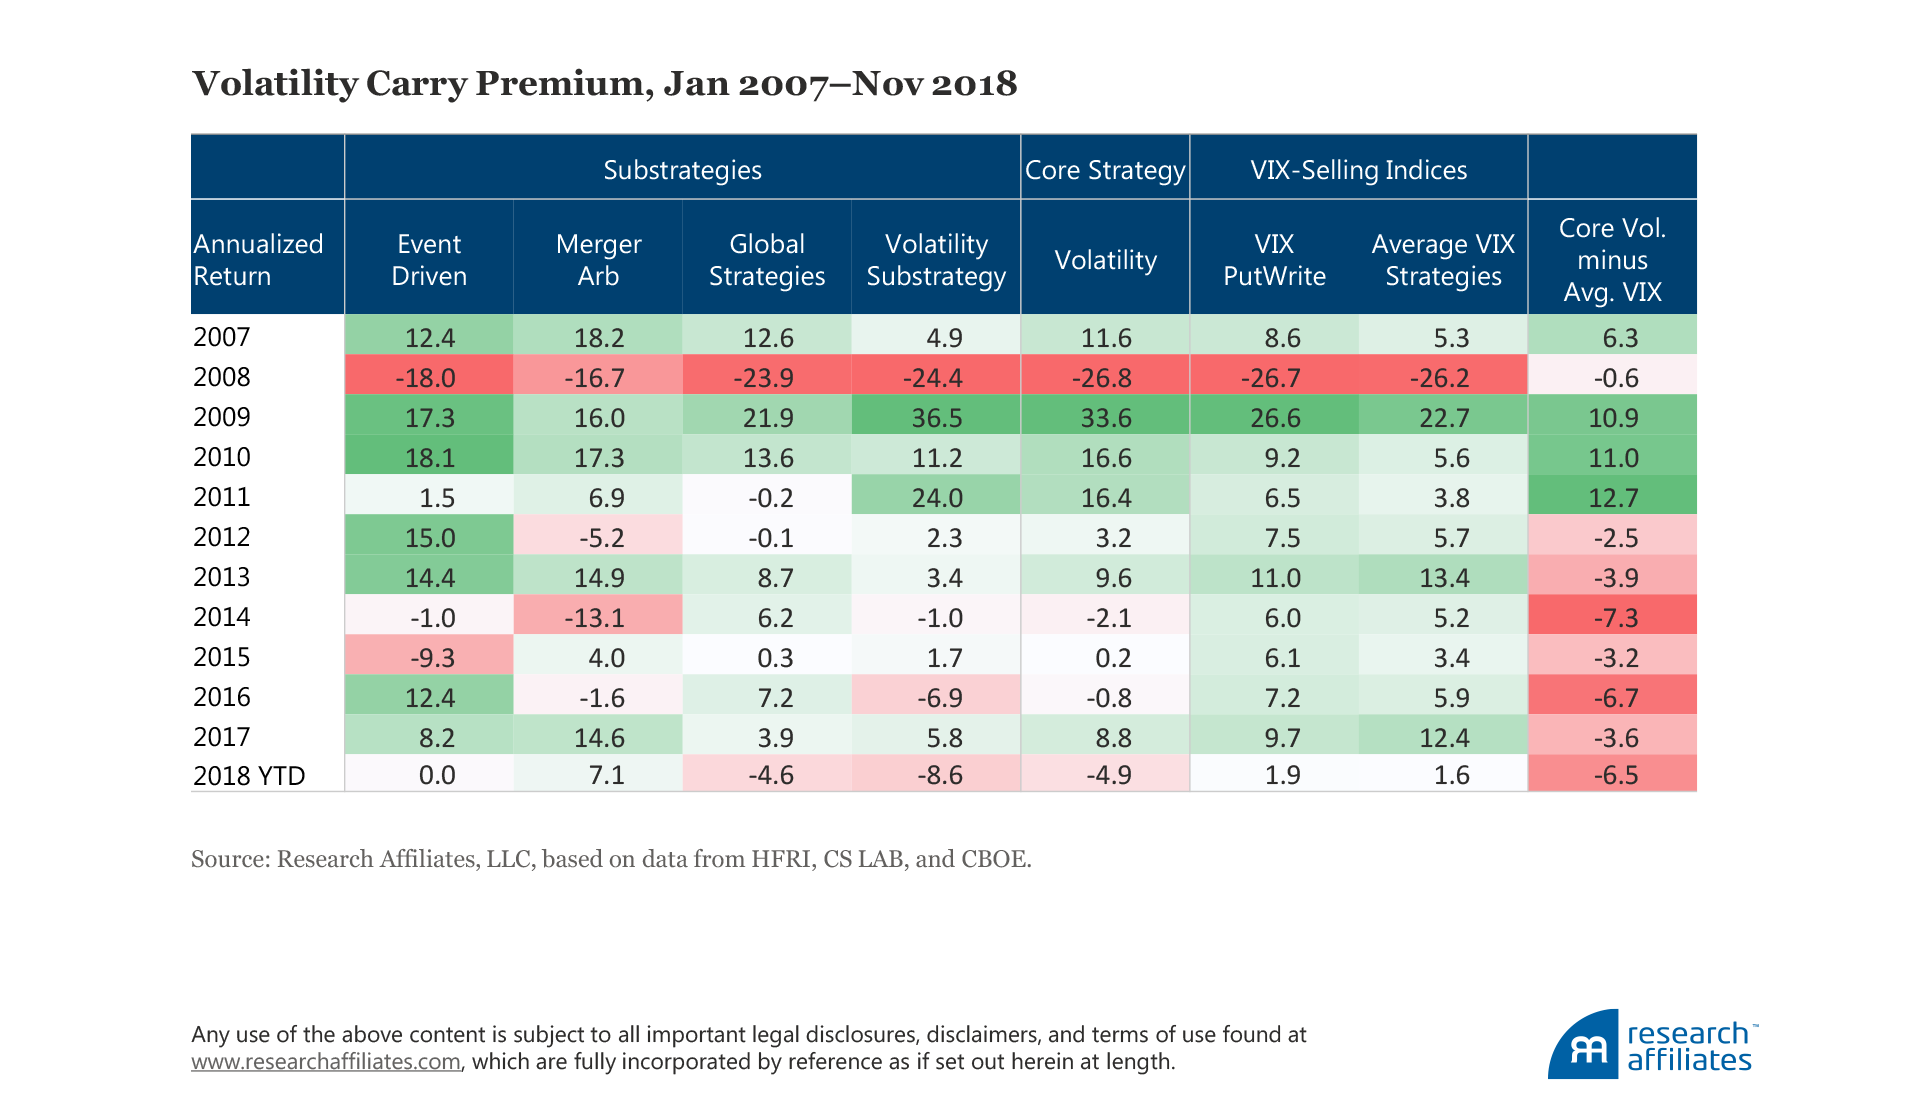
As of November 30, 2018, returns of the volatility category have been disappointing, ranging from low- to mid-single digits. A key driver of returns for this group of strategies is price volatility. As market-volatility levels rise and trading activity increases, investment banks tend to profit, but neither (at least initially) rewards volatility strategies. We combine the individual returns of the volatility-related CS LAB series (event driven, merger arb, and global strategies) with the HFR SRP volatility subseries to create a proxy for the core volatility strategy. We outline the technicalities of the proxy construction in the appendix.
The CBOE Options Exchange (CBOE) publishes the returns of a strategy similar to Lo’s (2001) Capital Decimation Partners, LP, (CDP) strategy called the VIX PutWrite Index (PUTSM), which sells at-the-money S&P 500 Index put options and invests cash in Treasury bills. We compare the performance of the VIX PutWrite Index and the average of various volatility-selling strategies,13 which we call Average VIX Strategies, with the core volatility strategy proxy and its constituent substrategies over the period January 2007 through November 2018.
A striking observation is that while volatility strategies (in aggregate) outperformed during the three years, 2009–2011, following the global financial crisis, they have consistently lagged the VIX-selling benchmark indices every year thereafter. The negative performance impact of material implementation costs required to gain live exposure is one rational explanation. In our view, the majority of investment banks and asset managers rarely fully capture the impact of such costs in their backtests. Invested dollar implementation includes not only hard brokerage costs and management fees, but also implicit transaction costs (i.e., market price impact).14Options, which are commonly used in volatility trading, have an order of magnitude of transactional volume below their underlying securities. Therefore, a volatility-selling strategy becomes more expensive to implement at allocation sizes of interest to institutional investors.
Regardless of the explanation for relative underperformance, the key contributor to the negative returns for this category and its constituents is rising volatility. For example, the VIX Index (often called the “fear gauge”), a common barometer of the market’s pricing of volatility, began 2018 at a historically low level of 9.2%. Since then, the VIX has spiked significantly and on multiple occasions, climbing from 12.1% to 21.2% in the month of October 2018 alone. Volatility has also risen in rates, commodities, and currencies this year, with increases ranging from one-tenth to one-half their respective starting levels.
Given that most of the last decade was characterized by either stable or falling market volatility, being lured into unconditional allocations to the volatility category is understandable. But as evidenced by last February’s and October’s core volatility strategy returns of −4.2% and –1.7%, respectively, providing insurance (or liquidity) to the market during initial sharp spikes in volatility are this category’s Achilles’ heel. As such, rather than unconditionally allocating to volatility strategies, we suggest erring on the side of caution by precluding such exposure when the premiums collected are too skinny to justify the exposure or volatility is spiking.
Trend strategies
Trend strategies are represented by the Credit Suisse LAB Managed Futures Liquid Index, which exhibits broad exposure to managed futures strategies across various asset classes, including equities, bonds, commodities, and currencies. Year-to-date through November 30, 2018, these strategies collectively delivered a cumulative loss of about 10%. This year’s losses surpass any other “down year” delivered by trend strategies in the last decade, including a −4% return in 2011 and a −8% return in 2012.
A powerful diversifying characteristic of trend strategies is their variable market beta. On the one hand, when asset prices fall or rise consistently, and for a sufficiently long period of time, these strategies tend to perform well. On the other hand, when markets oscillate, mean revert, or finish close to their starting levels, these strategies generally suffer. In 2018 we have experienced more the pattern of short-term vacillation, similar to the market conditions we witnessed at the end of the previous market cycle in 2007. As tempting as it may be to allocate to trend strategies that have not suffered in environments like 2018, investors should recognize in doing so they risk removing the downside protection trend strategies can provide in acute bear market sell-offs. This downside protection has not been needed this year, but over a full market cycle investors who maintain exposure to these time-varying beta strategies are likely to be rewarded.
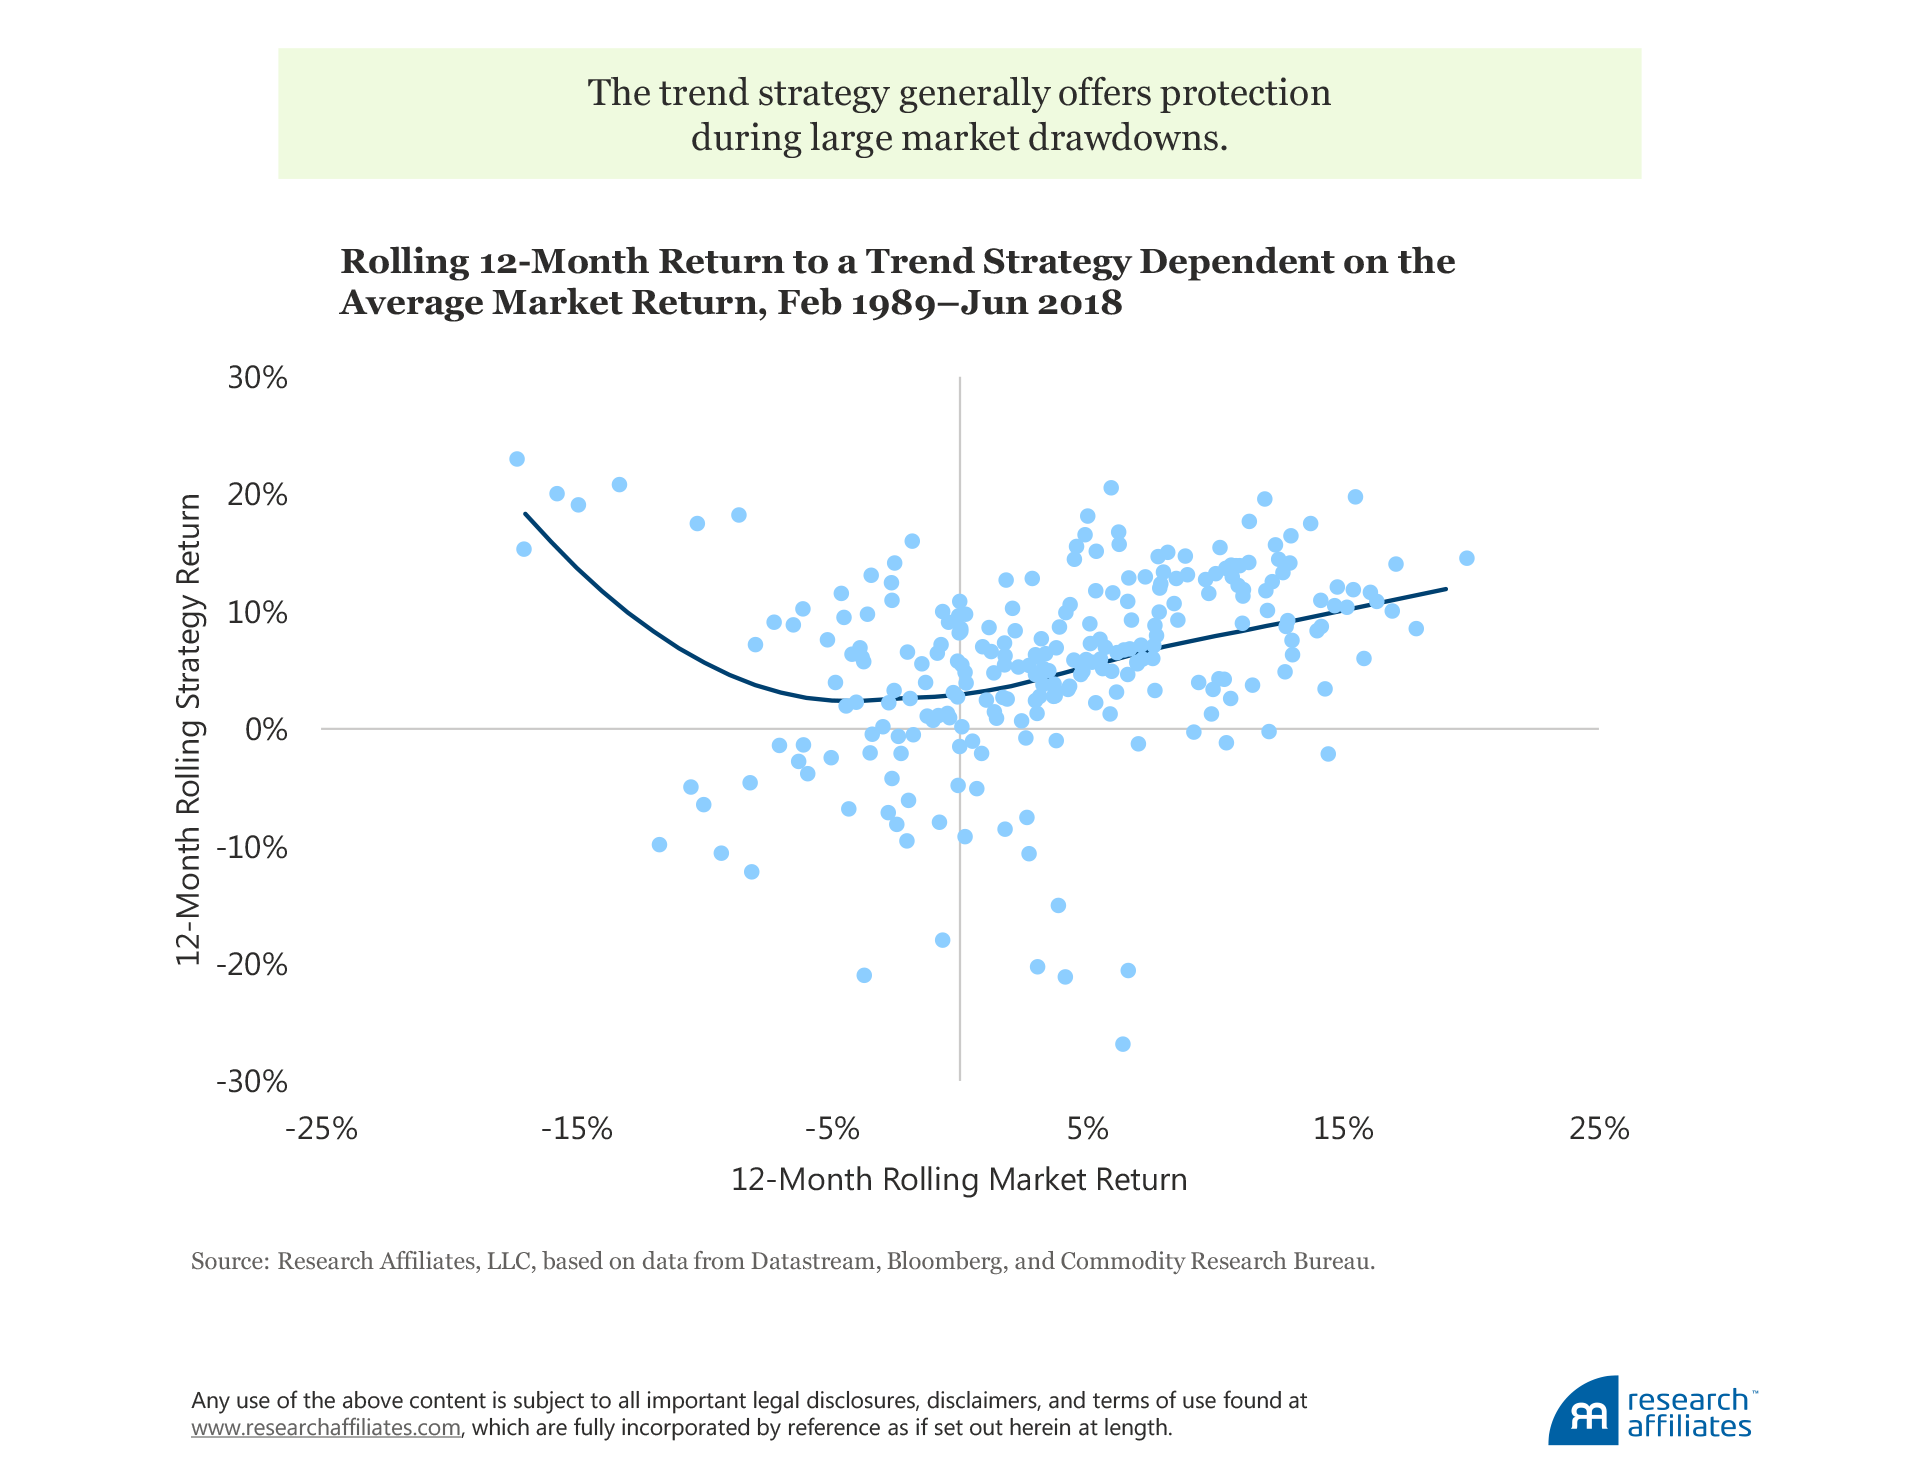
In the figure above, we illustrate the variable return characteristics of a simple 12-month momentum strategy across equity, rates, commodities, and currencies over the period February 1989–June 2018. The average rolling 12-month market return uses an equal-risk allocation of a diversified set of country and commodity indices within each of four asset classes—equities, bonds, currencies, and commodities. They-axis is the rolling 12-month return of a trend momentum strategy, going long and short depending on the sign of the historical 12-month return of each index.15 We observe that the strategy generally offers protection during large market drawdowns and delivers positive, yet lower-than-market returns, during rising market environments. As evidenced by the smoothed payoff function,16 poor returns to the strategy most likely occur when general market returns are in the range of approximately +/−5.0%.
Given that time-varying beta strategies can provide downside protection in market conditions when investors’ portfolios need it most (i.e., sharp bear market sell-offs), investors should try to avoid overreacting to the most recent disappointing returns. Instead, investors can confidently harvest the long-term returns offered by trend strategies by increasing their scrutiny around the ways these strategies are constructed. For instance, seeking strategies characterized by robust approaches and highly disciplined trading mechanisms is of the utmost importance. As Research Affiliates’ research findings affirm and investment beliefs support, investors who pursue thoughtfully designed strategies tend to avoid the consequences of a host of ills, such as unintentional data mining, overfitting, overconfidence, and costlier implementation, which tend to afflict strategies with overly complex, opaque designs. In short, seemingly negligible product design and implementation features can have a measurable impact on investor outcomes.
Macro strategies
The composition of macro strategies is diverse. Traditionally, managers of macro strategies seek to profit from the effects of local governments’ management of their economies and capital markets. We posit that this group of strategies reasonably encompasses a variety of carry, value, and momentum substrategies designed to exploit opportunities that arise from such intervention.17
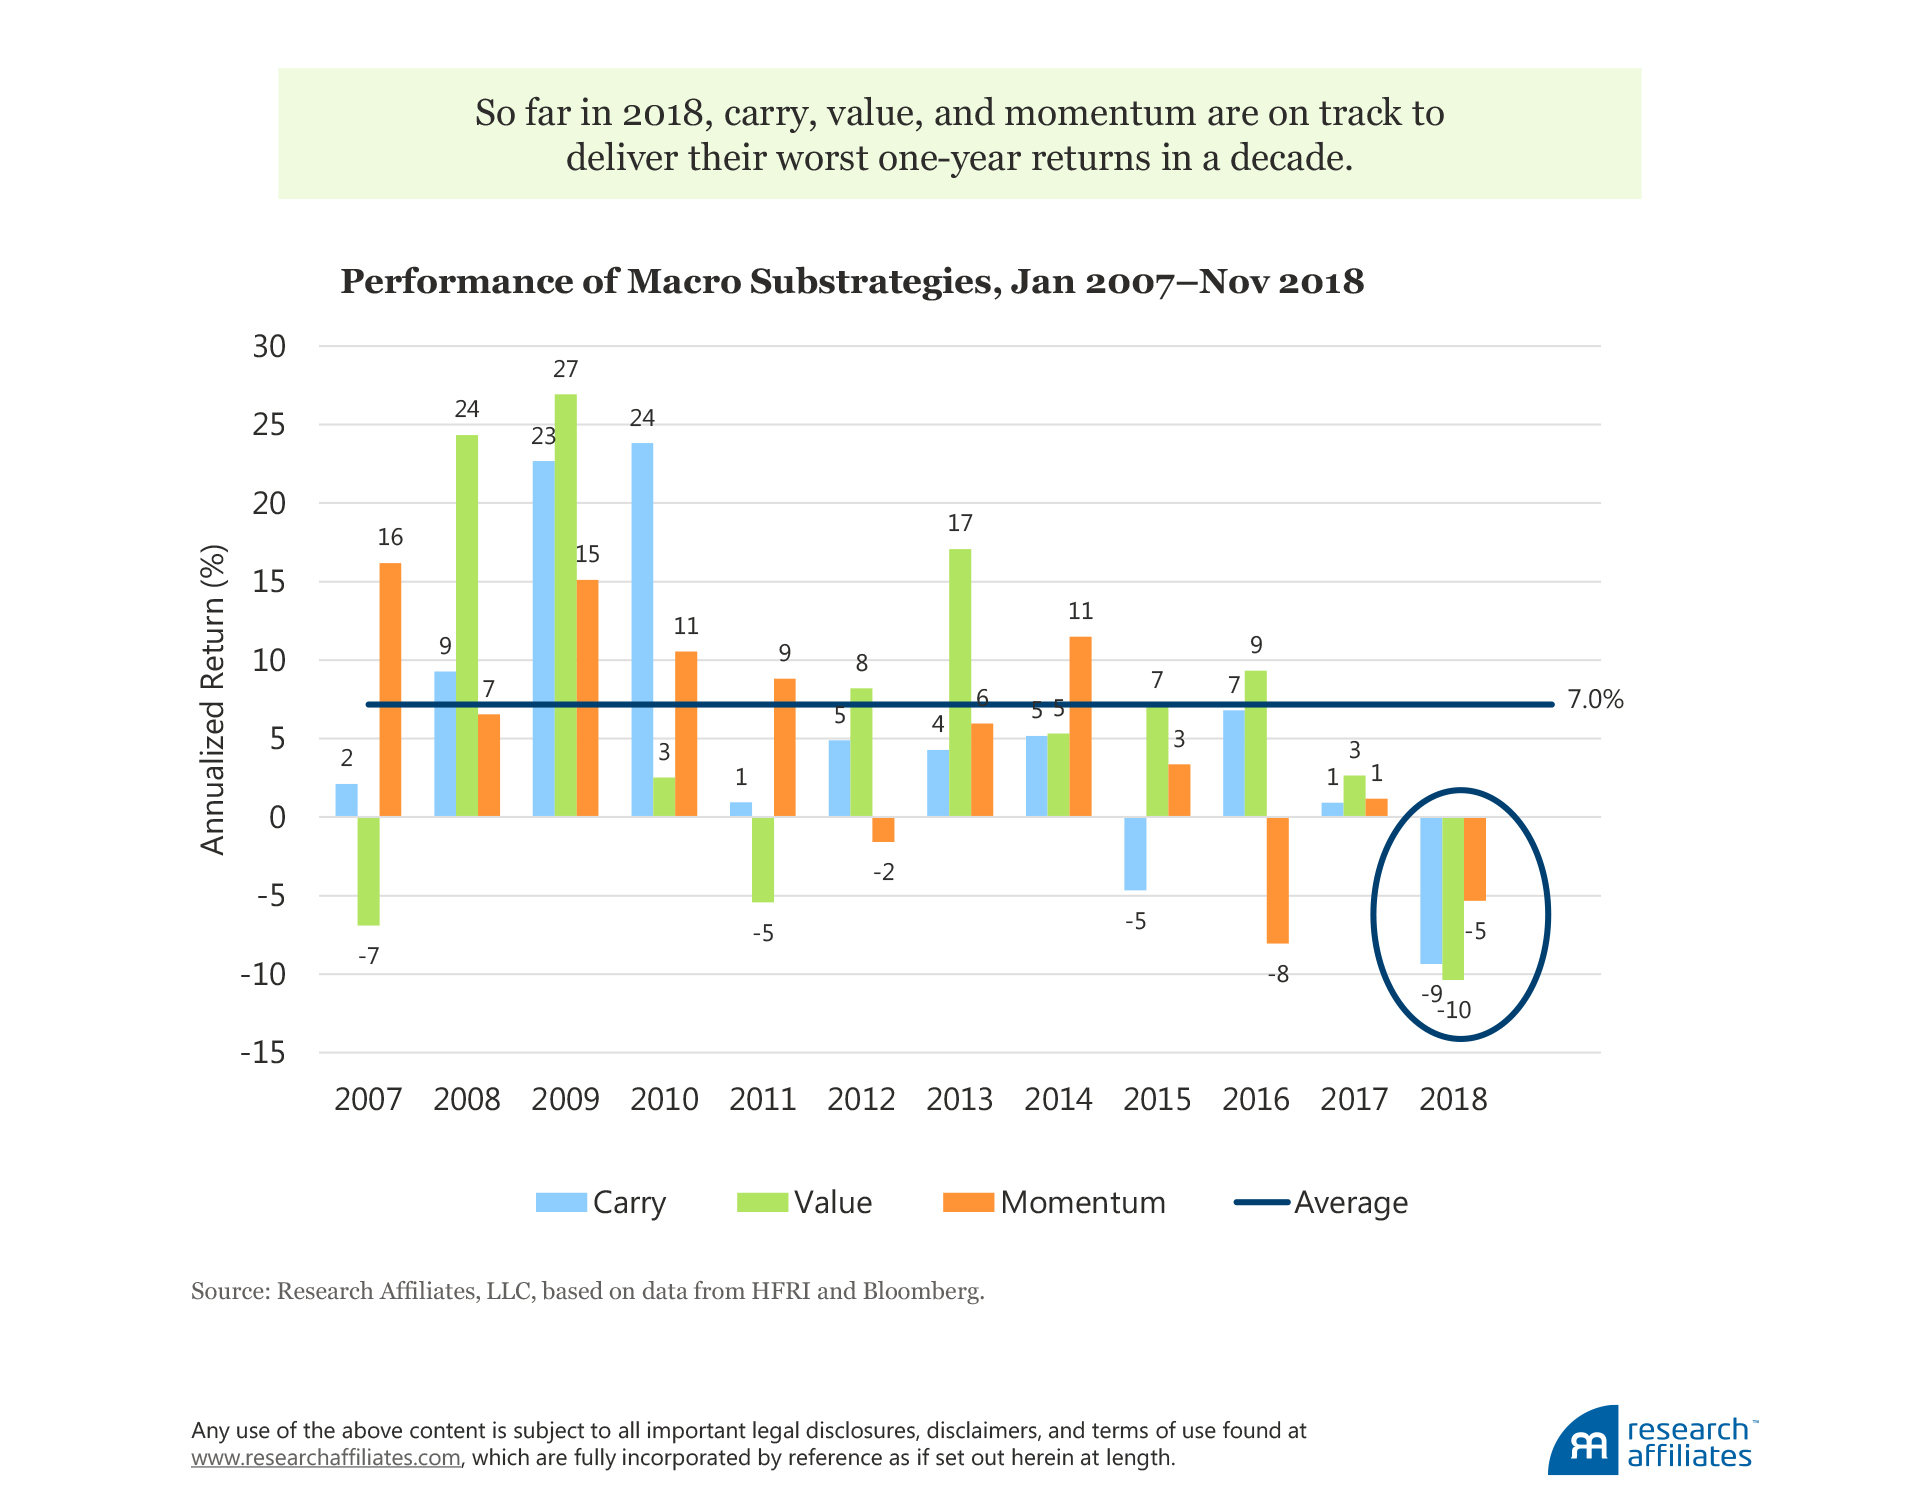
Similar to the other core ARP strategies, macro strategies have been experiencing a poor performance year, with some substrategies delivering their worst returns in more than a decade. On average, macro strategies generated a 7% annualized return over the full span, with 2018 year-to-date returns falling woefully below that return. For the 11 months ending November 30, 2018, the carry and value substrategies delivered returns of −9 to −10%, exceeding the lows experienced by the value substrategy in 2011 and 2007. Furthermore, 2018 is the first year of the last 12 in which all three substrategies underperformed; historically, in a single year no more than one strategy has produced a negative return.
Against a sea of bleak outcomes, our human nature naturally questions the benefits of the macro category. Of all the core ARP strategy groups, however, we believe the macro category offers the most compelling long-term diversification potential for an ARP investor’s portfolio. First, the substrategies composing the macro strategy group exhibit low correlation to one another, suggesting that the underlying substrategies are natural complements to each other. Notably, the cross-correlation levels of the underlying substrategies over the last decade have averaged 0.2. Second, we find a meaningfully larger amount of macro strategy risk can be mixed with the preceding strategies because of its advantageous correlation behavior. While a discussion of our findings is beyond the scope of this article, we provide evidence of a meaningful diversification impact within the macro strategy in the appendix.
Finally, beyond the empirical evidence, underlying theory implies strong diversification potential. As discussed by Brightman and Shepherd (2016), although each of the factors exploits a behavioral bias, their return drivers are not aligned. For example, momentum investing requires maintaining positions over the short run, while value investing requires contra trading over longer-time horizons.
Although the component strategies in the macro category are natural complements to each other, 2018 reminds us they are not immune from concurrent drawdowns. As outlined by Shepherd, Ko, and Kunz (2018), the average pairwise correlation of the carry, value, and momentum strategies across asset classes is 0.03, which means they are, on average, uncorrelated. Nevertheless, despite low average pairwise correlations of between −0.10 and +0.10 over rolling 22-day periods, meaningful correlation spikes have occurred in the last 10 years. These short-lived correlation spikes are a warning sign of the risk and leverage dangers inherent in these strategies and a reminder they should be adopted with a degree of humility, not with blind adherence to the historical data and the output of overly calibrated models.18
The tumultuous storm that the macro category has experienced in 2018, while unusual, should not be overly surprising to ARP investors. After all, the components of this category are not risk-free arbitrage opportunities, but strategies offering compensation for the potential realization of the very risks which have materialized across global markets in 2018.
—Value investing seeks to capture the tendency of relatively cheap investments to outperform relatively expensive ones. Such an approach leads to favoring exposures feared by market participants and shunning more comfortable exposures. Over a full market cycle, value investing can provide compensation to the investor for bearing these uncomfortable contrarian positions.
—Carry investing aims to take advantage of the tendency for higher-yielding assets to provide better returns than lower-yielding assets. Such an approach is akin to selling insurance to hedgers who are seeking protection against price volatility. Whereas being able to capture this compensation for “crash risk” can provide longer-term value-add, not being able to collect such a premium in shorter-term “flight to quality” environments is an inevitable risk of the strategy.
—Momentum investing attempts to capture cross-sectional momentum premia across asset classes. This approach provides compensation for relative outperformance until changing risk appetites or news surprises—among other possibilities—cause asset price reversals and concurrent losses.
While these three underlying substrategies have delivered lackluster results across most asset classes through November 30, 2018, the underperformance of certain markets comes with opportunities for investors to reposition themselves for future outperformance. As global financial markets and their constituent countries shift from being in an unprecedented liquidity environment to another economic regime, capital will shift based on the respective actions of the country’s monetary, fiscal, and trade policies. As new economic regimes present themselves, patient providers of diversified risk capital stand to profit as macro factors systematically shift exposure into newly attractive arenas. Just as cheapening valuations are indicative of elevated equity-factor return potential, country and commodity markets that offer higher carry, more attractive valuations, and/or fresh tailwinds from momentum are increasingly likely to deliver attractive risk-adjusted returns.
Return Drivers of Headline ARP Series
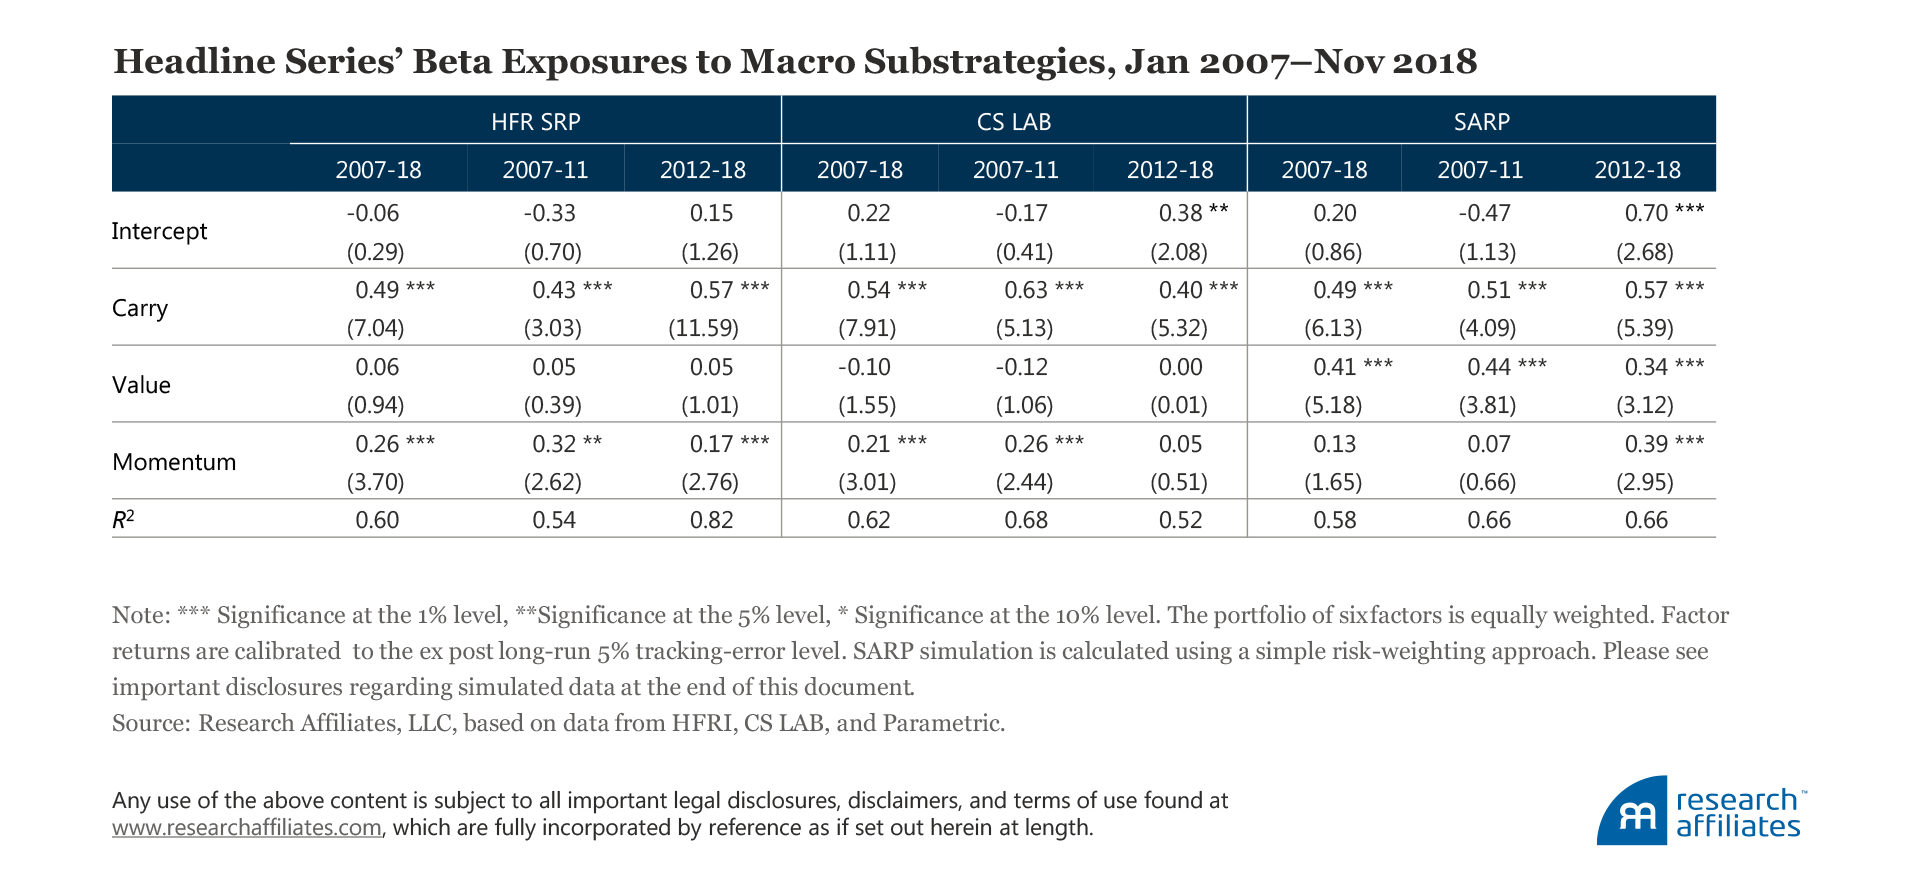
The year-to-date November 30, 2018, returns of the three headline multi-asset, multi-factor ARP series—HFR SRP, CS LAB, and SARP—are −9.5%, −4.1%, and −1.2%, respectively.
We regress each of the series against the individual returns of the core equity neutral, volatility, trend, and macro strategy groups. Both the HFR SRP and CS LAB series have, not surprisingly, exhibited statistically significant exposure to the equity neutral, volatility, and trend core categories. Whereas the HFR SRP series has statistically significant full-sample exposure to the macro category, the CS LAB series does not. Also, it appears that both the HFR SRP and CS LAB series have recently increased their exposures to the macro category, perhaps as recognition of the powerful diversification it offers has increased and has led to additional constituent offerings. Importantly, regardless of the return horizon over which we run the regression, the vast majority of the return variation in the headline series is explained by the four core strategy groups, as evidenced by a high R2.
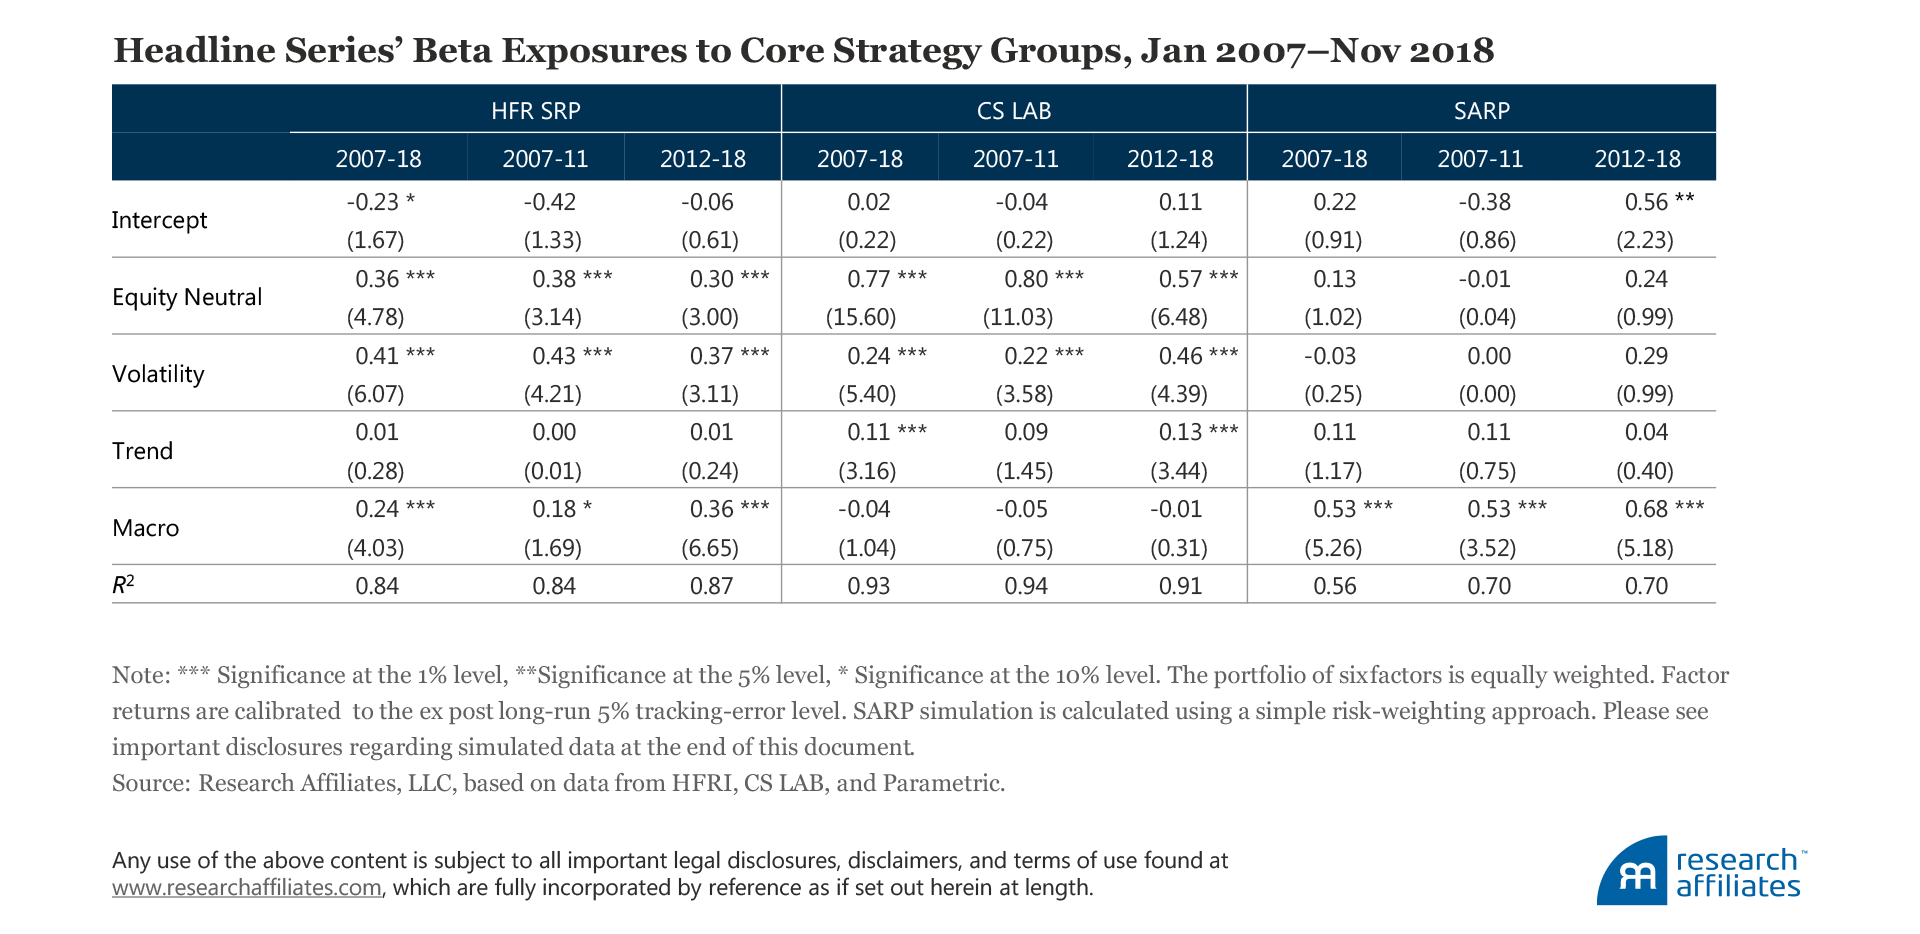
In contrast, SARP has high, constant, and statistically significant full-sample exposure to the macro category, recent statistical significance on the trend category, and insignificant exposure to the other categories. These observations do not imply that SARP does not incorporate volatility or trend substrategies, but rather that its design of, exposure to, and/or implementation within these categories is unlike typical approaches; hence, it has a significantly lower full-period R2 and correspondingly higher intercept.
Further analysis of SARP’s high and statistically significant exposure to the macro category reveals another dimension of differentiation. When we regress the long-term exposures of the HFR SBI and CS LAB series on the macro substrategy return sources, both series exhibit negligible and even negative exposures to the value substrategy and significantly positive exposure to the trend substrategy. These outcomes differ from SARP, which exhibits material and statistically significant exposure to the value substrategy, both over the full span of our study and over the last almost seven years (January 2012–November 2018).
This observation serves as a reminder of the unintended consequences of avoiding sufficient exposure to the value substrategy. While value exerts its influence more slowly than other factors, tilting away from its diversifying characteristics can lead to more downside risk in environments such as the one we are experiencing in 2018. We believe the year-to-date relative outperformance of SARP versus the headline indices we use in our analysis is a function of the strategy’s holding relatively more exposure to the macro value subcategory, its conditional avoidance of volatility-selling exposure, and its robust construction leading to reduced return slippage and implementation costs.
Conclusion
The recent performance difficulties within the ARP universe have left many investors wondering how to make sense of such results. Describing the first 11 months of 2018 as a “crisis” for ARP strategies is a matter of interpretation, but these historically large and widespread losses are unparalleled, particularly relative to the years following the global financial crisis. As John F. Kennedy once advised, “In a crisis, be aware of the danger—but recognize the opportunity.”
By creating a framework for the vast ARP universe and by seeking to better understand the drivers of return across the four core strategy groups in the framework, our analysis aims to put the experience of 2018 into perspective. If we can equip investors with a better understanding of the specific underlying return drivers of ARP strategies, we believe investors will have the information they need to improve their odds of maximizing the long-run investment opportunity of ARP investing—turning what appears to be a crisis into an opportunity.
Appendix
After reviewing and studying the research of Fung and Hseih (1997, 2002, 2003), we built the proxies for the various ARP strategies from two publically available series: the Credit Suisse Liquid Alternative Beta indices and the HFR Bank Systematic Risk Premia Indices.19 The risk weightings of each subseries of the strategy proxies follow:
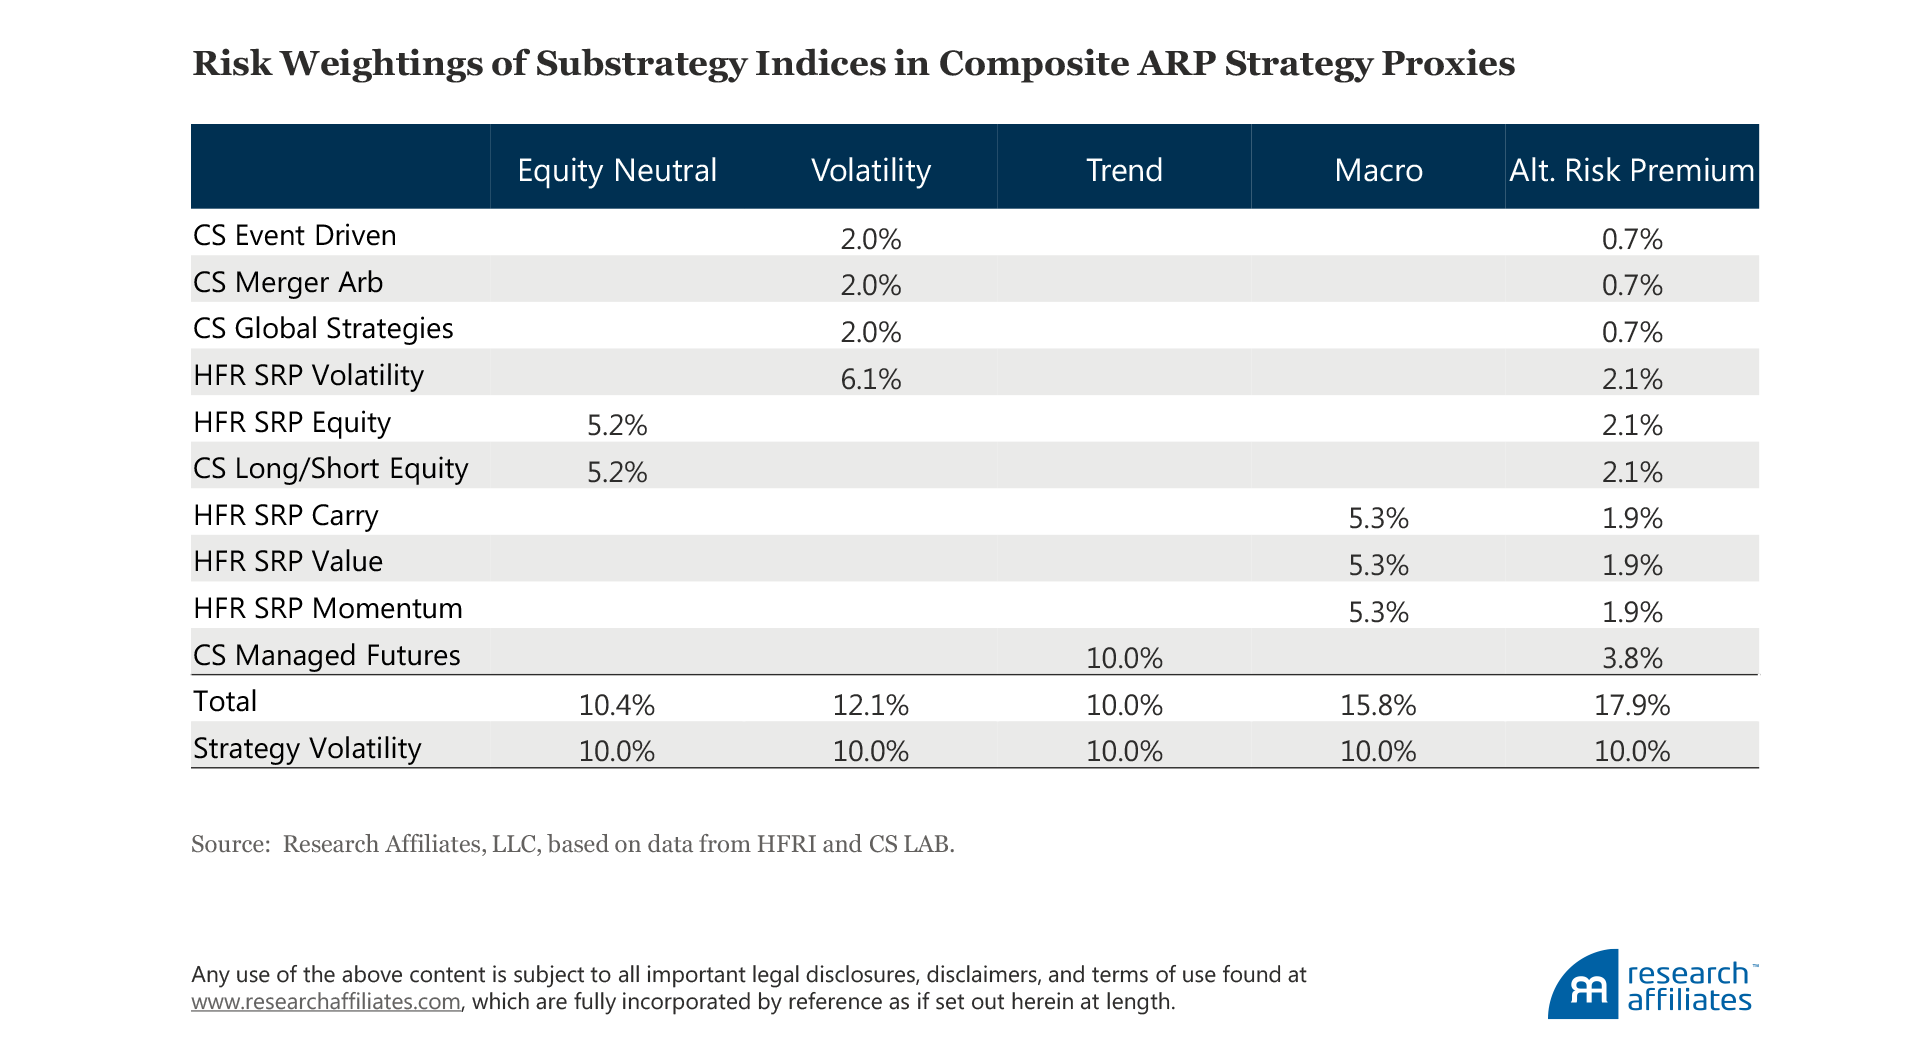
We adjust each substategy to have the long-term annual volatility level, or risk weighting, as shown. We adjust the risk weightings of each core strategy proxy to yield a composite strategy performance with a long-term volatility of 10.0% a year. For example, the equity neutral strategy is composed of the HFR Equity Strategies Index and Credit Suisse LAB Long/Short Equity Index, each scaled to an annualized volatility of 5.2%. We show the simple addition of the substrategies’ volatility levels for each core strategy proxy. These total volatility levels are generally greater than the 10.0% volatility level of the core strategy proxies, because the substrategies are not perfectly correlated with each other.
For example, the macro strategy’s underlying substrategy volatility level is 15.8%, but a diversification effect mitigates its overall strategy volatility to 10.0%. The degree of diversification within the volatility and equity neutral strategies is lower, as reflected by the underlying substrategy volatility levels of 12.1% and 10.4%, respectively. Across all four core strategy groups, pair-wise correlation levels are even lower, and thus the diversification potential is greater; for the alt risk premium strategy proxy, a total of 17.9% substrategy volatility diversifies and lowers the overall strategy volatility level to 10.0% a year.
The composition of the substrategies is generally self-explanatory. All subseries beginning with CS are the Credit Suisse LAB subindices. The HFRI substrategies are calculated as a simple risk weighting of the HFRI Systematic Bank indices’ underlying series within each strategy type. For example, the HFRI carry substrategy combines all carry subseries within five asset classes: commodities, credit, currency, equity multi-asset, and rates. We apply the same approach for the HFRI value, momentum, and volatility substrategies. The HFRI equity series is represented by the HFR Bank Systematic Risk Premia Equity Index.
A Longer History
To analyze results over a longer history than the data available from the Credit Suisse LAB subindices and the HFRI Systematic Bank indices, we extend the return series, using the following:
- For equity neutral strategies prior to 1998, we use the risk-weighted average of the US large-cap equity factors from the Research Affiliates Smart Beta Interactive tool.
- For the volatility strategies prior to 2009, we use the VIX PutWrite strategy less 5%.
- For trend strategies prior to 1998, we use the Research Affiliates series of 12-month time series momentum in commodities, currency, equity, and rates.
- For macro strategies prior to 2009, we use the Research Affiliates factor series for carry, value, and momentum in commodities, currency, equity, and rates.20
With these additional extensions of the return history, we report the calendar-year performance results of the four core strategy types and an aggregate ARP strategy over the last 28 years:
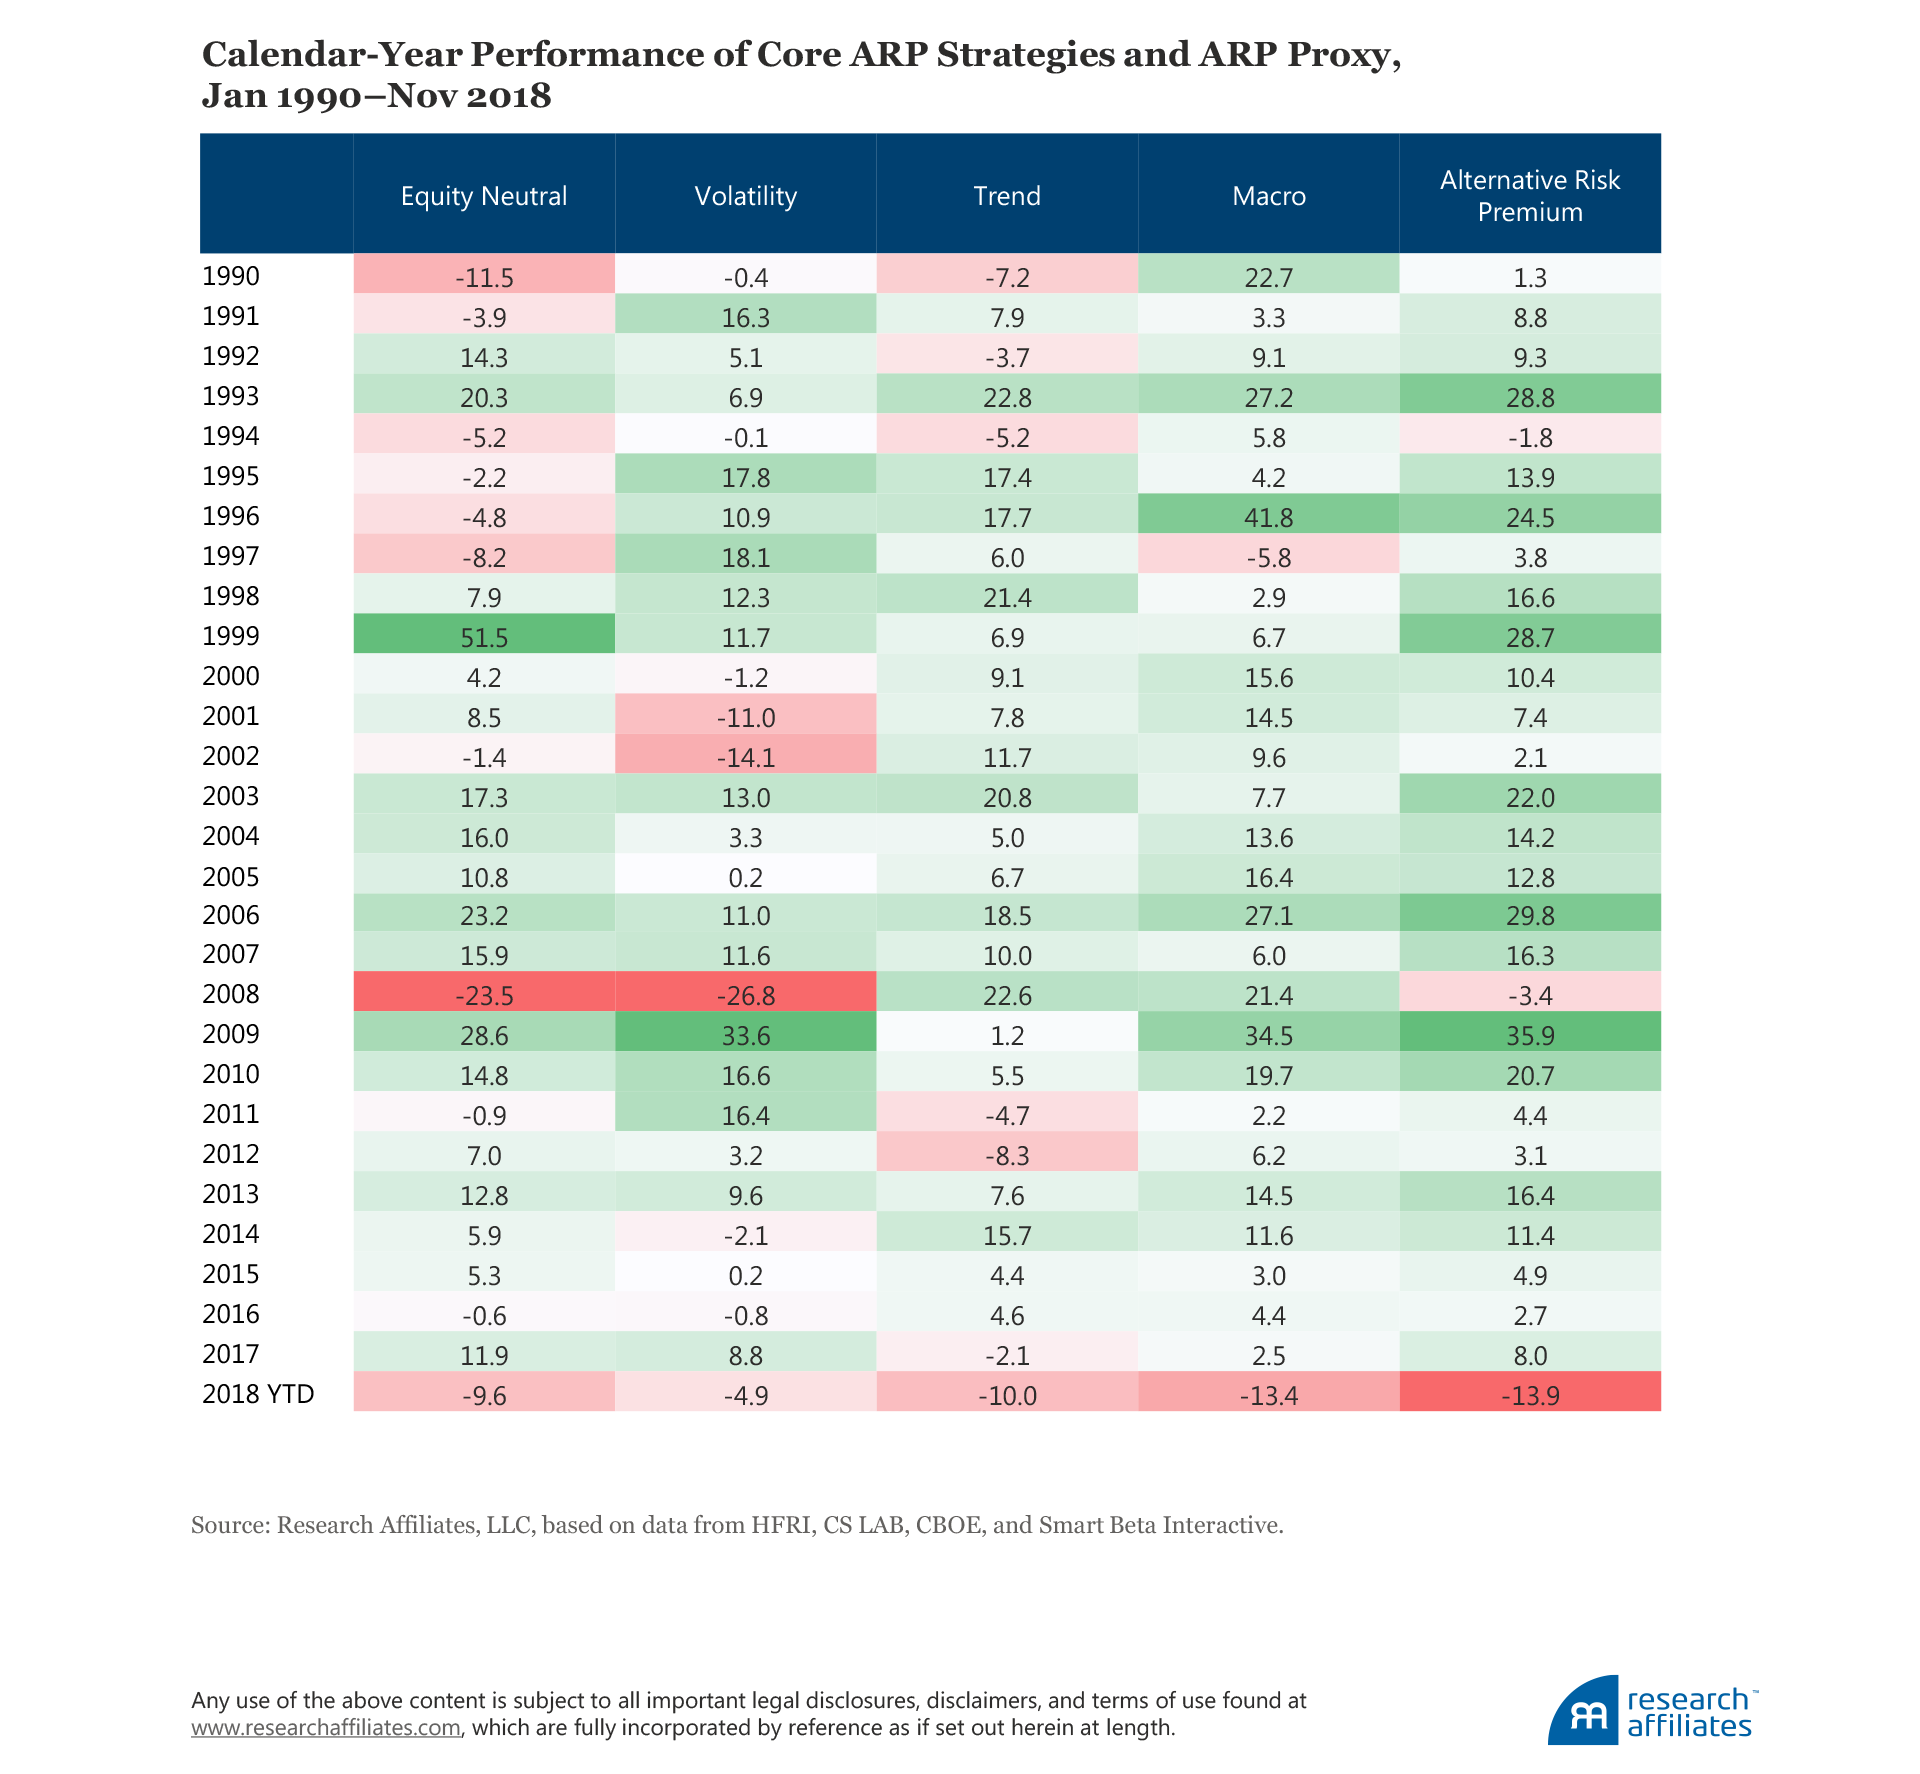
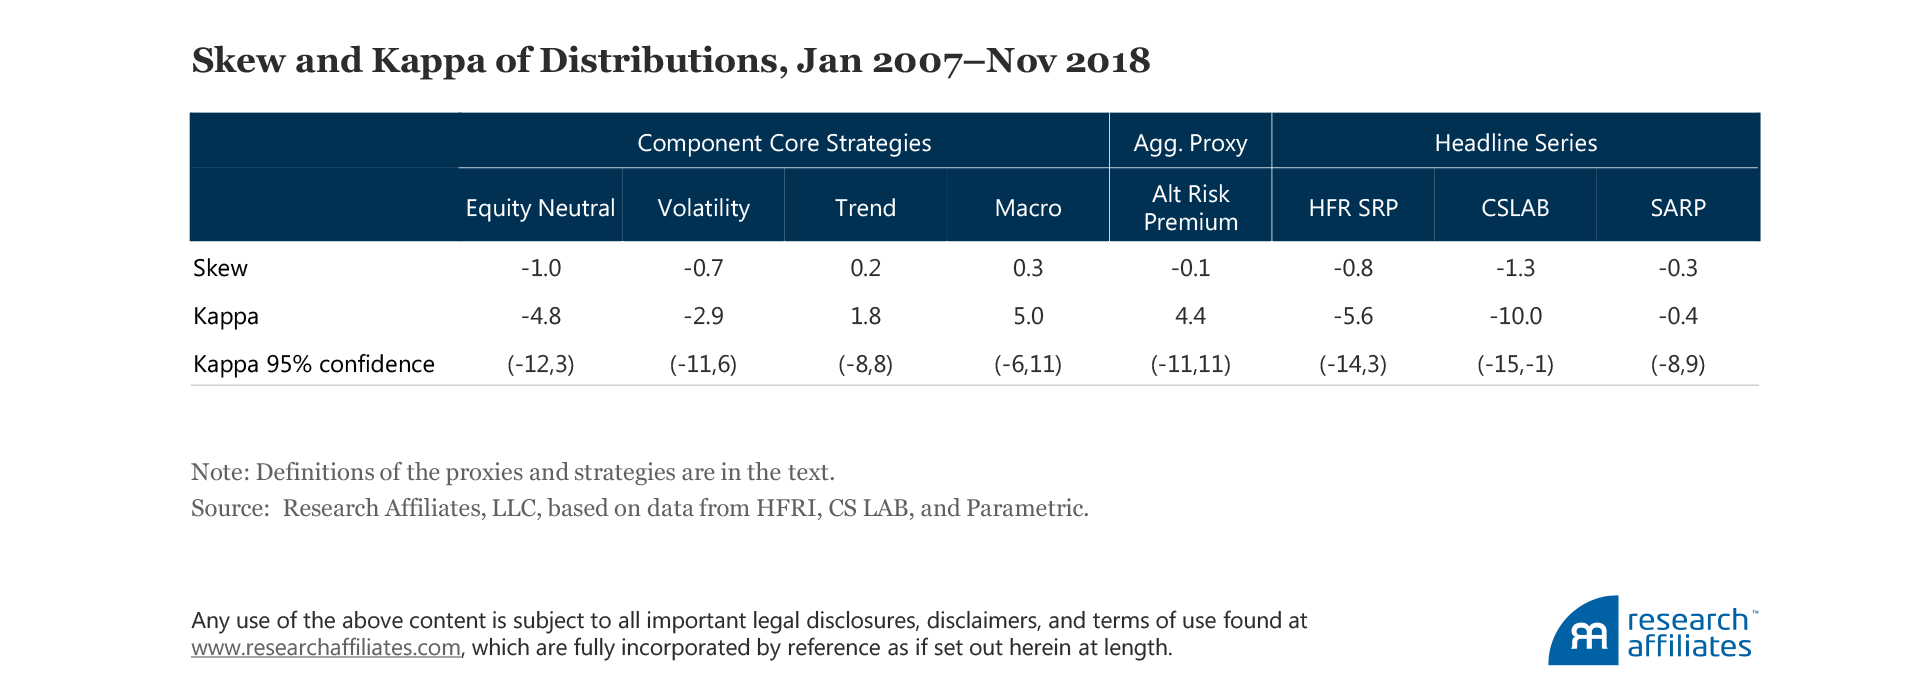
Consider a common characteristic of return distributions, the skew statistic.21 We caution against relying on the accuracy of a skew statistic, but nevertheless we report what we consider to be a better, but still fraught, measure of the skew known as kappa.22 Kappa is scaled to have a value of one when the monthly wealth gain is log-normally distributed, and zero when it is symmetric, or normally distributed. We also report the 95% confidence interval23 of kappa to show the substantial difficulty in determining nonsymmetry in strategy, or asset return, data when confronted with time series data. The sign or direction of the skew or kappa statistic suggests that volatility and equity neutral strategies display short-volatility characteristics, while macro and trend strategies display long-volatility characteristics. We view these results as being consistent with our intuition; arbitrage and equity neutral strategies generally bet on opportunities related to companies and those opportunities primarily focus on profit or wealth maximization. In contrast, macro and trend strategies take positions on countries and government-level entities that generally seek to maximize aggregates other than profit, such as price stability or employment.
Please read our disclosures concurrent with this publication: https://www.researchaffiliates.com/legal/disclosures#investment-adviser-disclosure-and-disclaimers.
Endnotes
1. If you haven’t done so yet, we encourage you to read these excellent pieces in the AQR Cliff’s Perspective series: “Liquid Alt Ragnarök?” (September 7, 2018) and “But What About October?” (November 23, 2018). Cliff Asness’s discussion on investor psychology during painful times, and on the evidence and intuition of liquid alternative investments, resonates with us. We choose not to spend time on these aspects of ARP investing in this article. We recognize these aspects as being important (they are crucial), but our goal is try to gain a better understanding of recent performance across the ARP universe by studying what we view as the core strategies that compose it. Our aim is to contribute to the overarching ARP discussion.
2. The HFR hedge fund classification system also includes fund of funds, risk parity, and blockchain. We exclude these classifications from our study because they are niche categories and, in our view, inadequately represent the ARP space.
3. From 1992 to 1999, Capital Decimation Partners, LP (i.e., an investment strategy that shorts out-of-the-money S&P 500 put options on monthly expiration dates for maturities less than or equal to three months with strikes approximately 7% out of the money) boasted an annual Sharpe ratio that approached 2.0 and an average annual return exceeding 40% (Lo, 2001).
4. As discussed by Mitchell and Pulvino (2001), at the announcement of a merger between two companies, the share prices of the companies’ securities begin to trade at a premium in anticipation of successful completion of the transaction. While many idiosyncratic reasons can lead to a failed merger, share price movements are a common factor. Because a merger is determined at share prices that are current at the time of the bid, large deviations in share prices (or heightened market-price volatility) generally cause one of the companies to pull out of the transaction. The merger spread is well modeled by the simultaneous writing of a call and a put option struck at the merger price. Naturally, these arbitrage strategies tend to thrive when market volatility is stable or falling.
5. The seminal article “Time Series Momentum” by Moskowitz, Ooi, and Pedersen (2012) provides an explanation of time series momentum.
6. Cross-sectional strategies employ the same dollar, beta, or risk long as they do short. They are named cross-sectional because they generally seek to profit from the relative movement between investments of a similar asset class within a given time period, such as a month. An example of this would be to have an equal, long exposure to three commodities and offsetting equal short exposure to three different commodities. If each position had a magnitude of 50%, the dollar net position would be zero (150% − 150% = 0%), but the gross position would be the sum of absolute value of the positions, 600% (6 x 50%).
7. We recognize that including one of the Research Affiliates strategies could be regarded as self-interested. That isn’t our intent. The leading impetus behind this article is to share our findings on our exploration of the underlying drivers of return within the ARP arena. We share strategy-specific results, as it relates to this framework, for those readers interested in understanding our intuition and our thinking behind our product design. Our hope is that these ancillary points do not distract, but rather inform.
8. SARP currently excludes exposure to the equity neutral category and the accompanying micro (security-level) equity factors it exploits. By harvesting only macro (index-level) risk premia, SARP can employ less leverage in seeking to achieve its desired return profile, and implementation costs can be kept significantly lower. Further, the exclusion of equity neutral and micro equity factors leads to improved transparency in portfolio positioning and return attribution as well as reduced due diligence and ongoing monitoring costs.
9. Our 60/40 proxy is the Global 60/40 Index, which is composed of 60% MSCI World Net Index and 40% Barclays Global Aggregate Index.
10. For more information, we refer you to Arnott et al. (2016) and Arnott, Beck, and Kalesnik (2016a,b).
11. We are using the Fundamentally Reweighted definition of value, but similar results hold for most definitions of value, across not only the US market, but also developed and emerging markets.
12. The forward-looking information ratio of the US RAFI Multi-Factor™ strategy, equivalent to a Sharpe ratio in a long–short setting, is 0.71 as of September 30, 2018.
13. Cboe S&P 500 PutWrite Index, Cboe S&P 500 95-110 Collar Index, Cboe S&P 500 2% OTM BuyWrite, Cboe S&P 500 30-Delta BuyWrite Index, Cboe S&P 500 Iron Butterfly Index, Cboe S&P 500 Zero-Cost Put Spread Collar, Cboe S&P 500 Covered Combo Index, Cboe S&P 500 Iron Condor Index, and Cboe S&P 500 5% Put Protection Index.
14. Aked (2016) provides a discussion of the significant implicit transaction costs in equity investing. The issues multiply significantly in less-liquid securities or strategies employed by ARP managers.
15. The data used in this analysis are from February 1989 through June 2018 with instruments added as the data became available. In aggregate, our analysis incorporates 53 different instruments and just over 17,000 data points.
16. We use a LOESS smoothing function with a smoothing parameter of 0.75. The curve is robust to differential smoothing parameters.
17. These strategies are represented by an aggregation of the respective carry, value, and momentum series from the HFR SRP family of indices. For dates before the inception of the HFR SRP series, we calculate our own series of macro strategies. We calculate the performance difference between a long portfolio, consisting of the one-third of the market with the best signal (e.g., value, carry, or momentum), and a short portfolio, consisting of the one-third of the market with the worst signal. The underlying markets include bonds, currencies, equities, and commodities. No adjustment is made for transaction costs, missed trades, cost of leverage, cost of borrowing stock for the short portfolio, or fees.
18. Arnott, Harvey, and Markowitz (2018) offer a seven-point protocol for assessing how statistical tools are applied in backtests.
19. The definitions of the series can be found at https://www.hedgefundresearch.com/family-indices/hfr-bank-systematic-risk-premia and https://lab.credit-suisse.com.
20. To represent the value, carry, and momentum strategies, we calculate the performance difference of a long portfolio, consisting of the one-third of the market with the best signal (e.g., value, carry, or momentum), relative to a short portfolio consisting of the one-third of the market with the worst signal. The underlying markets include bonds, currencies, equities, and commodities. No adjustment is made for transaction costs, missed trades, cost of leverage, cost of borrowing stock for the short portfolio, or fees.
21. A perfectly symmetric return distribution has a skew of zero. Negatively skewed distributions have a longer left tail, which suggests that extreme negative outliers are more likely (and vice versa).
22. Kappa has been calculated as the ratio of the difference between the monthly mean and the monthly median wealth and one-half of the monthly variance. The wealth is the month-end value of an investment divided by the month-beginning value. For mathematicians, it is expressed as  where the hat accent follows the normal substitution-of-population-for-sample procedure. We use the difference in the mean and the median rather than a direct measure of the skew, scaled by the expected skew of a log-normal distribution, because of the impact heavy tails have on the skew measure. Given that the majority of asset market returns are better explained by a degree of freedom five t-distribution than a normal distribution, the confidence interval of a kappa using a skew measure is far wider than presented in the table “Skew and Kappa of Distributions.”
23. We calculate the confidence interval from the empirical distribution of a 1,000-sample bootstrap of the kappa statistic. We have 143 monthly data points and round the confidence intervals to the nearest integer. To gain confidence intervals closer to unit one would likely require centuries of data rather than decades.
References
Aked, Michael. 2016. “The Dirty Little Secret of Passive Investing.” Research Affiliates Publications (January).
Arnott, Rob, Noah Beck, and Vitali Kalesnik. 2016a. “To Win with ‘Smart Beta’ Ask If the Price Is Right.” Research Affiliates Publications (June).
———. 2016b. “Timing ‘Smart Beta’ Strategies? Of Course! Buy Low, Sell High!” Research Affiliates Publications (September).
Arnott, Rob, Noah Beck, Vitali Kalesnik, and John West. 2016. “How Can ‘Smart Beta’ Go Horribly Wrong?” Research Affiliates Publications (February).
Arnott, Rob, Campbell Harvey, and Harry Markowtiz. 2018. “A Backtesting Protocol in the Era of Machine Learning.” Available on SSRN.
Asness, Cliff. 2018. “Liquid Alt Ragnorök?” AQR (September 7).
———. 2018. “But What About October?” AQR (November 23).
Brightman, Chris, and Shane Shepherd. 2016. “Systematic Global Macro.” Research Affiliates Publications (December).
Fung, William, and David A. Hsieh. 1997. “The Information Content of Performance Track Records: Investment Style and Survivorship Bias in the Historical Returns of Commodity Trading Advisors.” Journal of Portfolio Management, vol. 24, no. 1:30–41.
———. 2002. “Asset-Based Hedge-Fund Styles Factors for Hedge Funds.” Financial Analysts Journal, vol. 58, no. 5 (September/October):16–27.
———. 2003. “The Risk in Equity Long/Short Hedge Funds.” Working Paper, London Business School and Duke University.
Kalesnik, Vitali, and Juhani Linnainmaa. 2018. “Ignored Risks of Factor Investing.” Research Affiliates Publications (October).
Lo, Andrew. 2001. “Risk Management for Hedge Funds: Introduction and Overview.” Available on SSRN.
Mitchell, Mark, and Todd Pulvino. 2001. “Characteristics of Risk in Risk Arbitrage.” Journal of Finance, vol. 56, no. 6 (December):2135–2176.
Moskowitz, Tobias, Yao Hua Ooi, and Lasse Pedersen. 2012. “Time Series Momentum.” AQR (May 1).
Shepherd, Shane, Amie Ko, and Brandon Kunz. 2018. “Alternative Risk Premia: Valuable Benefits for Traditional Portfolios.” Research Affiliates Publications (September).
