
Investors seeking to add smart beta and factor strategies to their portfolios should consider the four craftsmanship elements of product design: 1) universe coverage and weighting mechanism, 2) signal definition, 3) measurement period, and 4) rebalancing frequency.
Design decisions guided by these craftsmanship elements can help preserve a portfolio’s performance potential by reducing implementation costs.
Introduction
In the previous article in this series, our colleagues John West and Trevor Schuesler explained the challenges of seeking positive alpha through manager selection. In this article, we highlight how financial advisors may add value with due diligence efforts on, perhaps, a more reliable source of excess return—product craftsmanship.
Technology today pushes us to move faster in almost every area of our life. We are encouraged to consume our news in 140-character bites, race through podcasts on 1.5x speed, and make every effort to “10x” our efficiency, condensing what we used to accomplish in 40 hours into a 4-hour workweek. Overawed with big data, we tend to be impressed by the glitter of complexity, and let slip from sight an appreciation for the simple beauty of the straightforward. When we rush at warp speed, much can be lost. In the investment industry, the application of nuanced, masterful strokes of design and development are rapidly becoming a fading art.
Investors face a dizzying array of decisions as they navigate the hordes of “latest and greatest” factor and smart beta strategies and new product launches. Many clients are seeking specific long-term factors as robust drivers of returns, without recognizing that the world is constantly changing, that mean reversion can flip historical alphas on their heads, and that equilibrium relationships are themselves not static. We suggest shifting due diligence efforts to a critical, and often underappreciated, awareness of what we and others call craftsmanship1—the product design and implementation elements that are tangible, measurable, and impactful.
We begin by explaining what qualifies as a robust factor and then what we believe are the essential dimensions of quality craftsmanship in smart beta strategies. Whereas we focus on one of the most commonly accepted robust factors—value, as represented by the Fundamental Index™ approach—the underlying lessons and considerations drawn from this example are broadly applicable to all smart beta strategies.
Factor Robustness
Our colleagues recently proposed a framework for how to determine which of roughly 300 factor strategies are robust (Beck et al., 2016). First, a factor should be grounded in a long and deep academic literature. This academic scrutiny should identify a theoretical basis for the factor return premium, such as an investor psychological bias (behavioral explanation) or an undiversifiable risk exposure. Ideally, this theoretical foundation should be determined before looking at the data, so that we do not use data to build the theory. Second, a factor should be robust across definitions, meaning that small changes in the measurement of a factor should not destroy its demonstrated performance. Third, a factor should be robust across geographies to show out-of-sample performance, and fourth, a factor should be implementable without incurring large trading costs that erode the factor’s return premium. On a separate note, as our Alice in Factorland series of papers observes, we have also learned that in a backtest much of past performance is tied to revaluation (i.e., a factor becoming more expensive). Without controlling for the valuation level of the corresponding factor, past success likely presages future disappointment.
Craftsmanship Considerations
Once an investor identifies the desired robust sources of return premium they wish to capture in their portfolio, the logical next step is to select the product(s) that can deliver these premiums. An investor new to the smart beta arena can easily be overwhelmed with the immensity of product offerings.
To address this challenge, we believe investors should be aware of the elements that constitute quality craftsmanship in the design of smart beta strategies, and make their product selection decisions accordingly. These elements can be grouped along the following dimensions: 1) universe coverage and weighting mechanism, 2) signal definition, 3) measurement period, and 4) rebalancing frequency.
A commonality underlying all of these dimensions arises from an overriding lesson we have gleaned from our combined decades of designing investment strategies: thoughtful product design work includes striking a balance between simplicity and effectiveness. Albert Einstein aptly captured this notion: “Everything should be made as simple as possible, but not simpler.” We lean toward simplicity because it tends to lead to more predictable results and easier governance (Brightman, Kalesnik, and Kose, 2015), and we are highly conscientious in our design of preserving the effectiveness of the strategy.
As we explore each of the four craftsmanship dimensions, we will use the example of a strategy—the RAFI™ Fundamental Index—that relies on fundamental measures of company size to systematically rebalance against the market's constantly shifting expectations, and thereby harnessing a value premium (Arnott, 2006). Investors can apply the following framework to evaluate the craftsmanship elements of just about any smart beta strategy.
Dimension #1: Universe coverage and weighting mechanism
Decisions surrounding the universe coverage and weighting mechanisms of strategies can meaningfully impact investor portfolios because they influence the amount of liquidity available, which in turn affects transaction costs. For instance, if we invest in a strategy that allocates equal weights to all stocks with no consideration of the size of a company (an equal-weighted scheme), we inherently have a higher exposure to smaller companies, which tend to be less liquid and more expensive to trade. Unfortunately, most investors ignore liquidity issues because of the difficulty in observing their tangible impact on portfolio returns.
This dimension partially informs why we chose to avoid an equal-weighted approach, even though it is the simplest non-price-weighted weighting mechanism of all! Consider the comparative analysis conducted by Aked et al. (2014). The starting universes of the portfolios in the analysis include all stocks within the largest 85th percentile rank, either by cumulative market capitalization (for the cap-weighted and equal-weighted strategies) or by cumulative fundamental weight (for the fundamental strategy).2 Both essentially cover a fixed portion of the market and are consistent with the practices of the most popular index providers.
A couple of observations: First, both an equal-weighted approach and a fundamental-weighted approach exploit a weakness in the cap-weighted approach—the tendency to overweight overpriced stocks and underweight underpriced stocks. So, as expected, both strategies meaningfully outperform the cap-weighted benchmark over the long run. Second, and more surprising, we observe a substantial difference in the performance of the fundamental approach and of the equal-weighted approach across the G7 countries: Australia, Canada, France, Germany, Italy, Japan, United Kingdom, and United States.
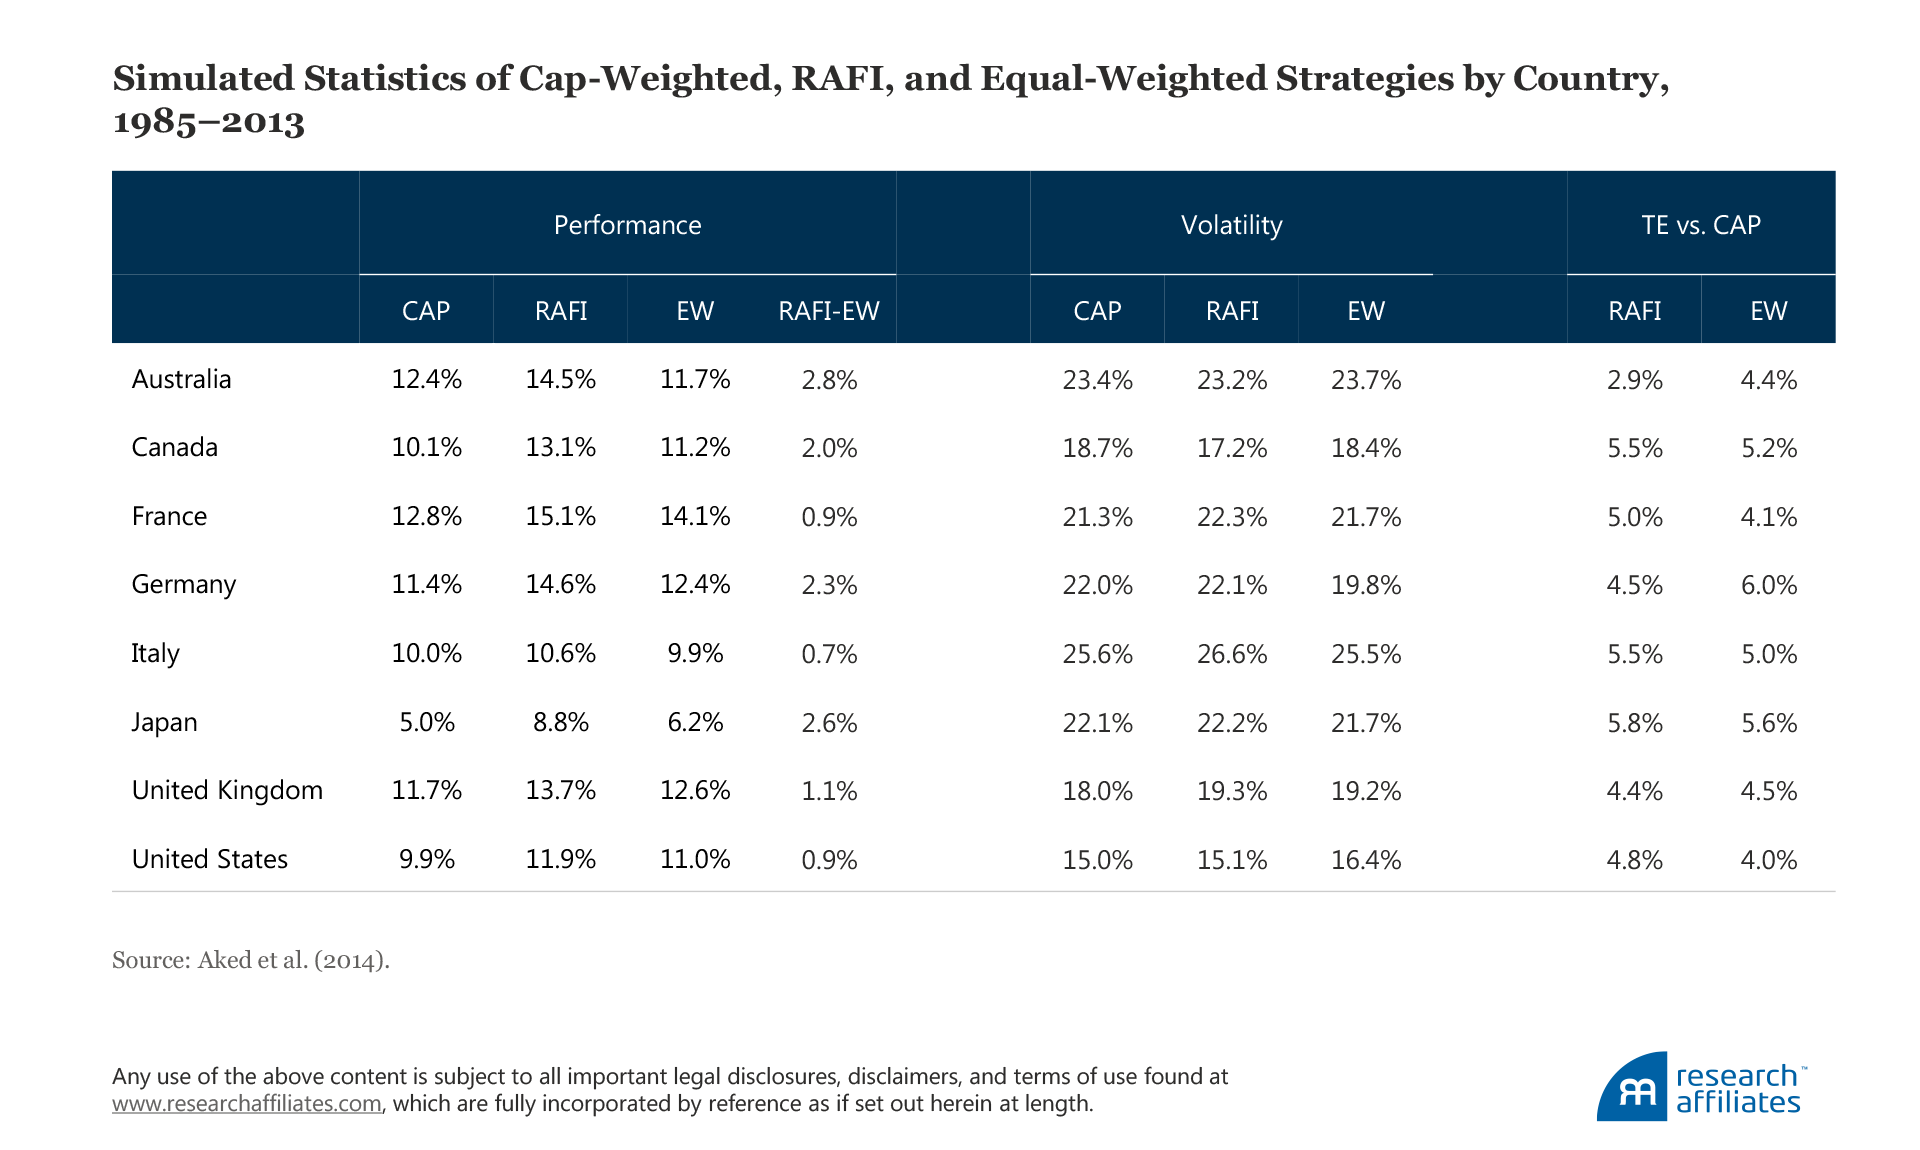
As we seek to understand the sources of this long-term excess return (i.e., where it comes from and whether it is sustainable), we find that the selection effect matters. An equal-weighted strategy inherently includes companies with market prices above what is justified by the respective company’s economic size, because market capitalization is used as a criterion for selecting the stocks in the starting universe. In contrast, choosing stocks with a cumulative 85% fundamental weight from the universe is less vulnerable to a negative selection effect.
When increasing the coverage of the starting universe of smart beta strategies (the universes would be identical if coverage were increased to 100%), the performance difference between the fundamental-weighted and equal-weighted strategies shrinks because the selection effect becomes weaker, but with the tradeoff of substantially higher transaction costs. An equal-weighted index allocates a material portion of its holdings to very small companies, which tend to be less liquid and more expensive to trade relative to their larger counterparts. So, although excluding fundamental metrics from the index construction process simplifies the methodology, this design decision tends to be accompanied by a significant loss of potential performance advantage in the presence of trading costs.
Dimension #2: Signal definition
A number of considerations are important to keep in mind when we are defining the signals or measures to be used in a smart beta strategy. At first glance, it may appear that using fewer accounting measures in a Fundamental Index strategy would be preferable. After all, doing so would reduce the complexity that arises when 1) aggregating data with different magnitudes and 2) dealing with companies that do not pay out dividends or that have a negative book value.
Even when backtest results appear to strongly support a particular fundamental metric as the best signal—such as adjusted sales (sales adjusted by capital structure) in the RAFI composite results displayed in the following table—we may lack a compelling reason why that metric’s superior performance is likely to persist. Therefore, we find that using multiple measures3 and simply averaging them helps avoid the dangers of overfitting data. We constantly remind ourselves and investors about the risks of data mining (Li and West, 2017, and Brightman, Li, and Liu, 2015) in light of strong evidence in the academic world of its prevalence in backtests (Harvey and Liu, 2018).
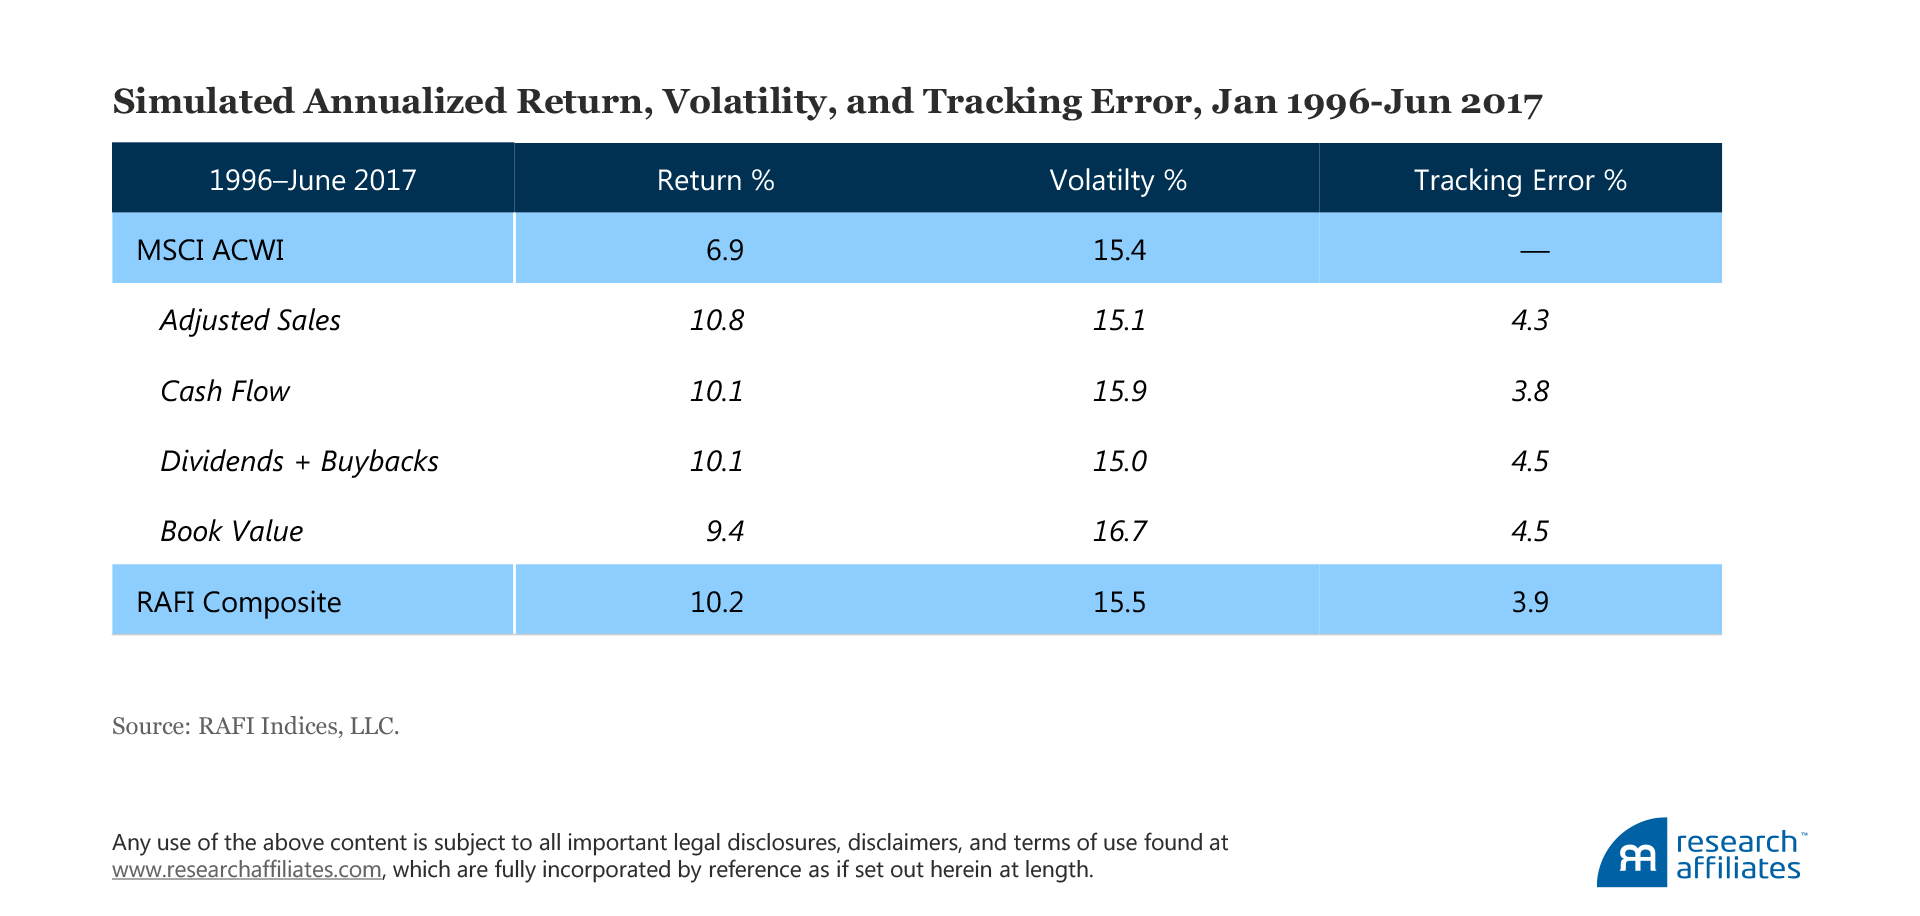
In short, we simply do not have a strong conviction about the relative advantage of one measure over another as being the best signal of performance. We also strive to be mindful of the caveats inherent to particular measures, which may make them an unreliable signal.4 As a result, we have found the optimal approach to be to take a simple average in order to reduce measurement error and to provide a more stable anchor of a company’s economic footprint.
Dimension #3: Measurement period
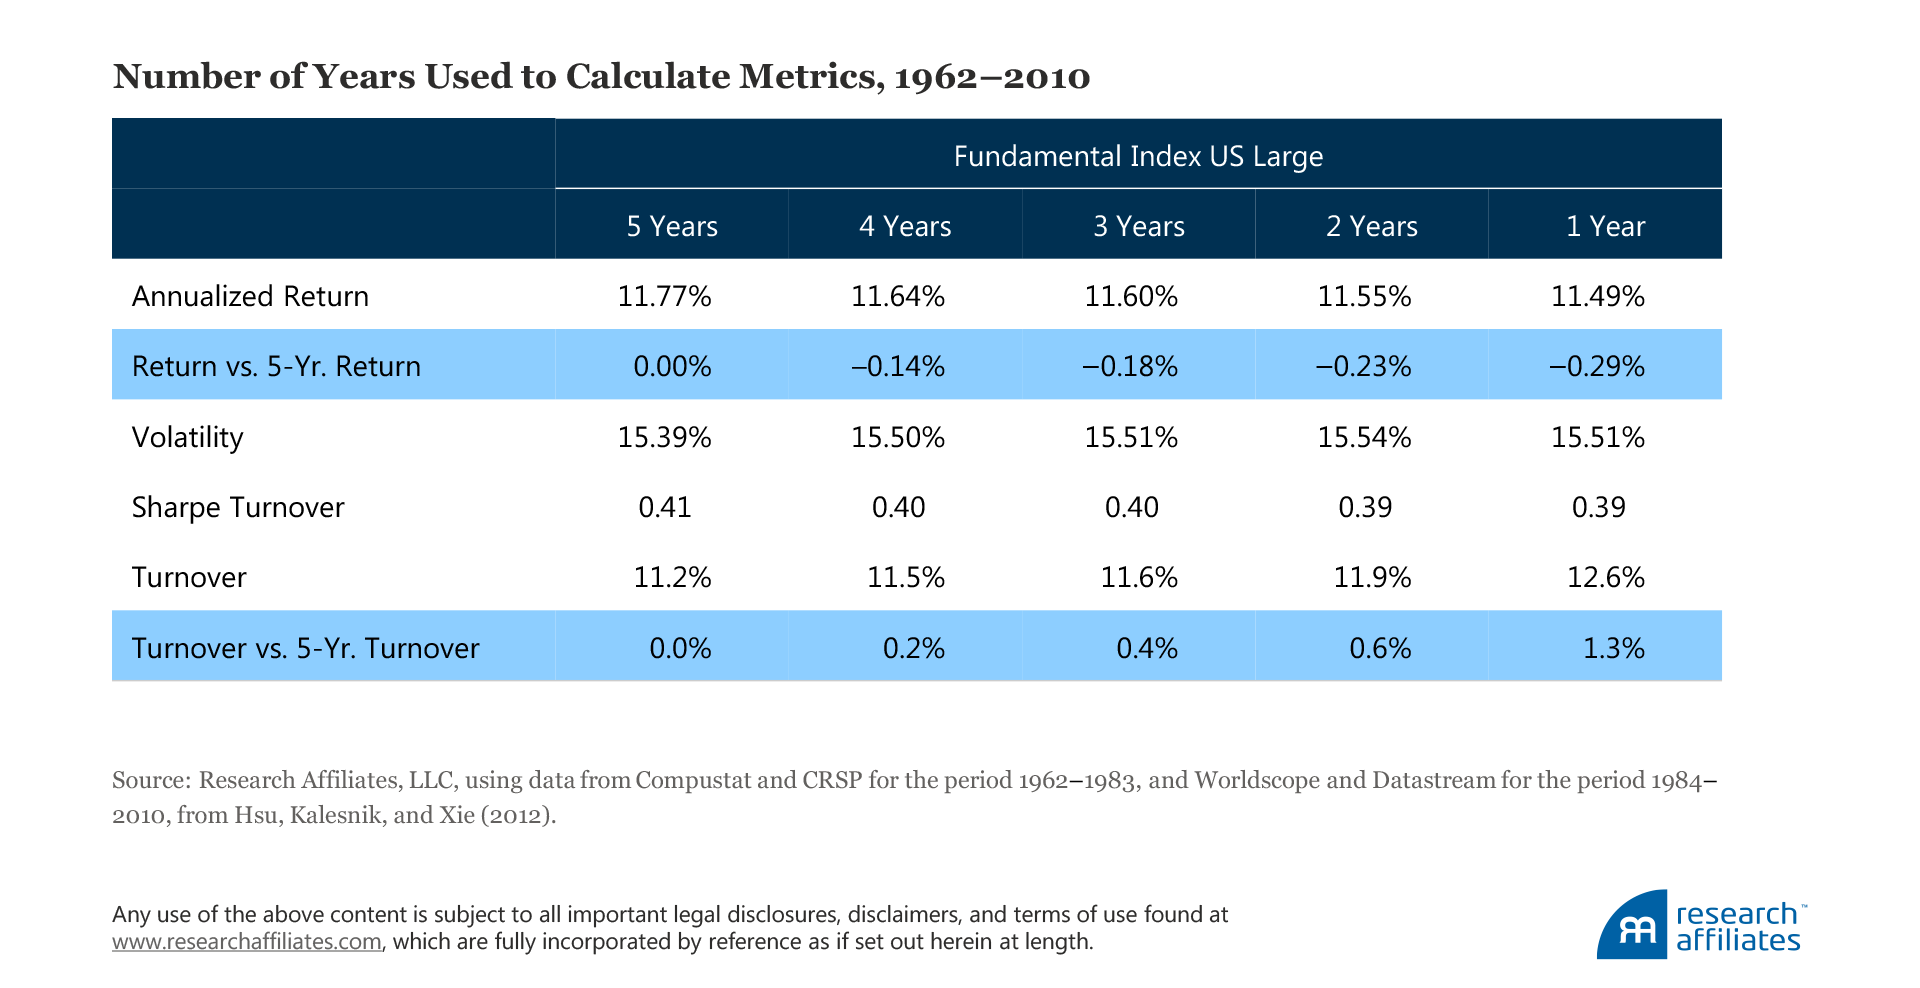
In selecting and defining the measures we use as signals, we aim to reduce the amount of trading to execute the strategy and we aim to smooth out the seasonality associated with accounting metrics. In this spirit, we have found that using a five-year average of the accounting metric, instead of the most recent year’s metric, produces the best results.
Almost every design choice represents a double-edged sword, and we ensure the choice is made only after gauging the other side of the potentially sharp blade. Whereas one-year data hold the freshest information, these data also impact a stock’s price most strongly. Therefore, a singular reliance on one-year financial information would introduce price-based stock selection and weighting through the back door, which would cause performance to decline and turnover to rise. By using a five-year average, we create a more stable anchor for rebalancing that leads to less trading and allows for smoothing the seasonality associated with accounting metrics in order to better capture a firm’s contribution to the economy through a full business cycle.
Decisions surrounding this design dimension apply across smart beta and factor strategies. For instance, if a signal such as momentum (or low volatility) has an inherently higher (lower) decay rate, then shortening (extending) its measurement horizon may lead to a better tradeoff between the effectiveness of capturing the factor and incorporating a more stable anchor that would, in turn, lower transaction costs and help preserve a given factor’s net expected return premium.
Dimension #4: Trading frequency and rebalancing dates
The fourth design dimension focuses on rebalancing and why trading frequencies matter. Rebalancing frequency refers to how often the security weights in a portfolio are realigned to their anchor weights. Rebalancing dates refer to the fixed dates on which the rebalancing activity occurs. In the index world, common rebalancing frequencies are quarterly, semi-annual, or annual, and rebalancing dates are usually quarter-end or year-end. More complex methods exist but require execution expertise; for instance, a rebalancing event may be triggered when the distance between a stock’s current weight and its target weight exceeds a predetermined threshold.
We believe creative design can reduce trading costs further—beyond the basic rebalancing frequency decision just explained—without overly complicating the implementation process. In our example using the RAFI Fundamental Index, we applied a method called the quarterly staggered rebalance (QSR), which spreads the portfolio turnover of an annual rebalancing over four quarters. We do this by creating an index equal weighted to four sub-indices identical in all respects except for the date at which the rebalance occurs.5
The QSR scheme preserves all the benefits of an annual rebalancing schedule, including total trading reduction and the avoidance of trading against price momentum, which improve a strategy’s performance, net of costs, compared to a quarterly or semi-annual schedule. By rebalancing roughly only a quarter of a portfolio’s assets to the target weights at each quarter,3 the portfolio moves toward its target weights more slowly, spreading trading over four days. Implementing the rebalancing in this manner effectively reduces the market impact caused by adverse price movements of the underlying securities (Aked and Moroz, 2015, and Frazzini, Israel, and Moskowitz, 2012). In addition, doing so mitigates entry-point risk, which should not matter in the long run, but can induce pain and regret for investors in the short run.
The rebalancing dates we use are the last business days of March, June, and September and the third Friday in December. We intentionally avoid the last business day of December because the market typically has limited liquidity around the holiday season and some international markets are closed. Yes, this is an exception to our rule, but one we believe is well worth making.
Putting It Together
So now, let’s put it all together. When we employ thoughtful design in choosing a strategy’s 1) universe coverage and weighting mechanism, 2) signal definition(s), 3) measurement horizon, and 4) trading frequency and rebalancing dates, the combined outcome should be lower market impact costs without any sacrifice of a strategy’s efficacy in capturing the premium delivered by the given factor.
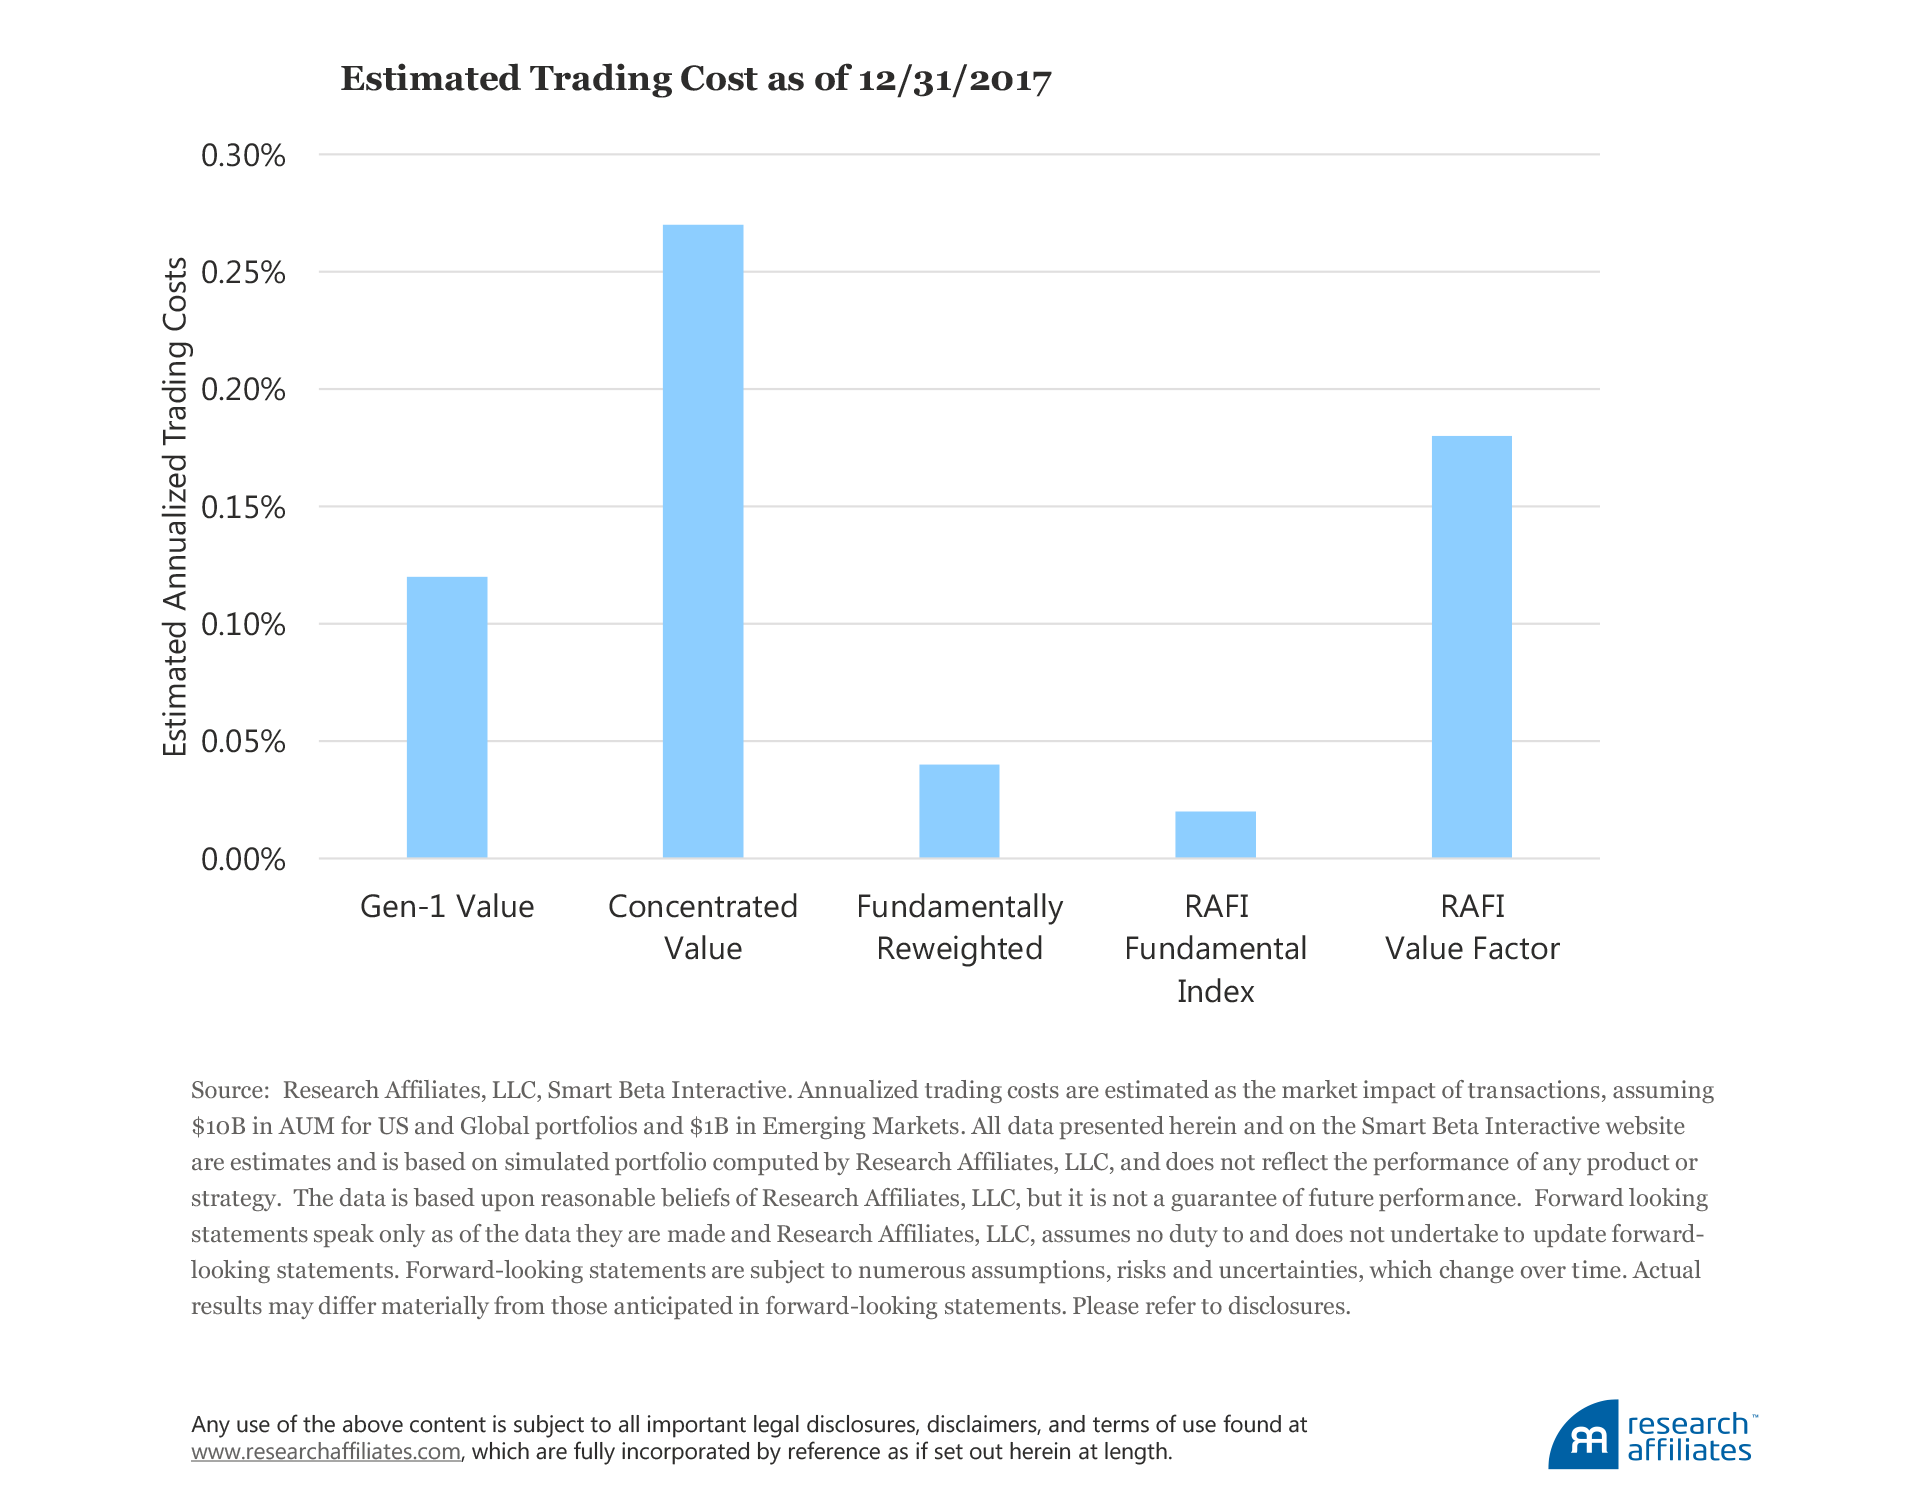
Case in point: Across the most popular value smart-beta and factor approaches, RAFI Fundamental Index boasts the highest capacity, smallest turnover rate, and ultimately the lowest estimated trading costs. Certainly, an accurate estimate of transaction costs for different indices is hard to attain, but the relative advantage or disadvantage of one over the other is likely robust and persistent over time. The magnitude of the difference in transaction costs can easily be measured in double-digit basis points and is much greater than the difference in expense ratios of the different indices tracking exchange-traded funds.
The Research Affiliates Smart Beta Interactive tool provides a dashboard that allows investors to easily view, compare, and contrast smart-beta strategies and factors’ expected annualized trading costs—along with the other measures that can influence transaction costs, such as capacity, turnover, weighted- average market cap, and effective number of stocks. When investors thoughtfully analyze, and their selection decisions are guided by, the craftsmanship elements of smart beta products we have demonstrated in this article, they can raise the odds of preserving their portfolio’s performance potential by reducing implementation costs.
Harvesting well-known return premiums—simply and effectively—tends to require us to step back and slow down to embrace details in design and implementation. Because our construction rules are systematic, we can expect these deltas to persist over time. Thus, careful research on these issues is likely to add enduring value to investment portfolios. In a world that values speed and complexity, the practice of considering the elements of craftsmanship is often underappreciated, even though the long-term payoff will be substantial.
We believe an awareness of the tangible, impactful craftsmanship criteria used in a product’s design, coupled with the Research Affiliates online smart beta and asset allocation interactive tools, can improve long-run investment outcomes. As Yogi Berra once humorously quipped, “In theory there is no difference between theory and practice. In practice there is.” We couldn’t agree more.
Endnotes
- At Research Affiliates, we have long emphasized and labeled this important element as “product design.” A hat tip is in order to AQR’s Ronen Israel whom we first heard say “craftsmanship”—a more succinct and descriptive term—at the 2017 Morningstar Investment Conference. Indeed, we encourage readers to explore Israel, Jiang, and Ross (2018).
- The official method of Aked et al. (2014) uses an 86% cutoff point to define large/mid universe.
- Israel, Jiang and Ross (2018) also concluded that using multiple signals to capture a desired factor exposure is preferred when a single perfect definition does not exist.
- For example, relying on sales alone can unintentionally result in an approach that emphasizes companies that run with a thin profit margin, such as Walmart. Book value can place too much weight on firms, such as Ford and General Motors, that invest heavily in capital expenditures (property, industrial buildings, and equipment), but do not produce value for their shareholders, and a reliance on dividends may lead to underweighting growth oriented stocks, such as Google, with a low payout to investors.
- Israel, Jiang, and Ross (2018) suggest that spreading out trading is an effective way to lower market impact.
- Another way to think about this is that the portfolio is being moved about one-fourth toward its target positions at the quarterly rebalancing date, so the total turnover is equivalent to an annual rebalance.
References
Aked, Michael, Vitali Kalesnik, Engin Kose, Philip Lawton, and Max Moroz. 2014. “Equal-Weight and Fundamental-Weight Index Investing: A Comparison of Two Smart Beta Strategies.” Research Affiliates White Paper (May).
Aked, Michael, and Max Moroz. 2015. “The Market Impact of Passive Trading.” Journal of Trading, vol. 10, no. 3 (Summer):5−12.
Arnott, Robert. 2006. “An Overwrought Orthodoxy.” Institutional Investor Magazine(December).
Arnott, Robert, Mark Clements, and Vitali Kalesnik. 2017. “Why Factor Tilts Are Not Smart ‘Smart Beta’: Part II of Alice in Factorland.” Research Affiliates Publications (May).
Arnott, Robert, Vitali Kalesnik, Engin Kose, and Lillian Wu. 2017. “Can Momentum Investing Be Saved? Part IV of Alice in Factorland.” Research Affiliates Publications (October).
Arnott, Robert, Vitali Kalesnik, and Lillian Wu. 2017. “The Incredible Shrinking Factor Return: Part 1 of Alice in Factorland.” Research Affiliates Publications (April).
———. 2017. “The Folly of Hiring Winners and Firing Losers: Part III of Alice in Factorland.” Research Affiliates Publications (September).
Beck, Noah, Jason Hsu, Vitali Kalesnik, and Helga Kostka. 2016. “Will Your Factor Deliver? An Examination of Factor Robustness and Implementation Costs.” Financial Analysts Journal, vol. 72, no. 5 (September/October):55−82.
Brightman, Chris, Vitali Kalesnik, and Engin Kose. 2015. “Elegant Design.” Research Affiliates Publications (November).
Brightman, Chris, Feifei Li, and Xi Liu. 2015. “Chasing Performance with ETFs.” Research Affiliates Publications (November).
Frazzini, Andrea, Ronen Israel, and Tobias J. Moskowitz. 2012. “Trading Costs of Asset Pricing Anomalies.” Available at SSRN.
Harvey, Campbell, and Yan Liu. 2018. “Lucky Factors.” Available at SSRN.
Hsu, Jason, Vitali Kalesnik, and Shelley Xie. 2012. “What Makes the Fundamental Index® Methodology Work?” Research Affiliates White Paper (October).
Israel, Ronen, Sarah Jiang, and Adrienne Ross. 2018. "Craftsmanship Alpha: An Application to Style Investing." Journal of Portfolio Management, vol. 44, issue 2 (Multi-Asset Special Issue 2018):23−39.
Li, Feifei, and John West. 2017. “Live from Newport Beach. It’s Smart Beta!” Research Affiliates Publications (August).
