
Market Adjustments Alter Our Expected Return Forecasts
Over the last several years, we were often asked what catalyst could end the longest bull market in US history. Our response has always been that a catalyst, by definition, is a surprise to most of the market, so predicting what it might be is merely an interesting and occasionally useful parlor game—needless to say no one saw this one coming.
Over the last several weeks, the humanitarian crisis of the novel coronavirus has proven to be the match that lit the kindling of overpriced stocks, soaked by the kerosene of a slowing US economy. The OECD Composite Leading Indicators data series that forecasts the turning points of growth in the economy clearly shows that the US economy has been slowing for 18 months, starting in the third quarter of 2018. Equities’ poor performance in the fourth quarter of 2018 turned out in hindsight to be brush fire. We are now dealing with a full-blown conflagration.
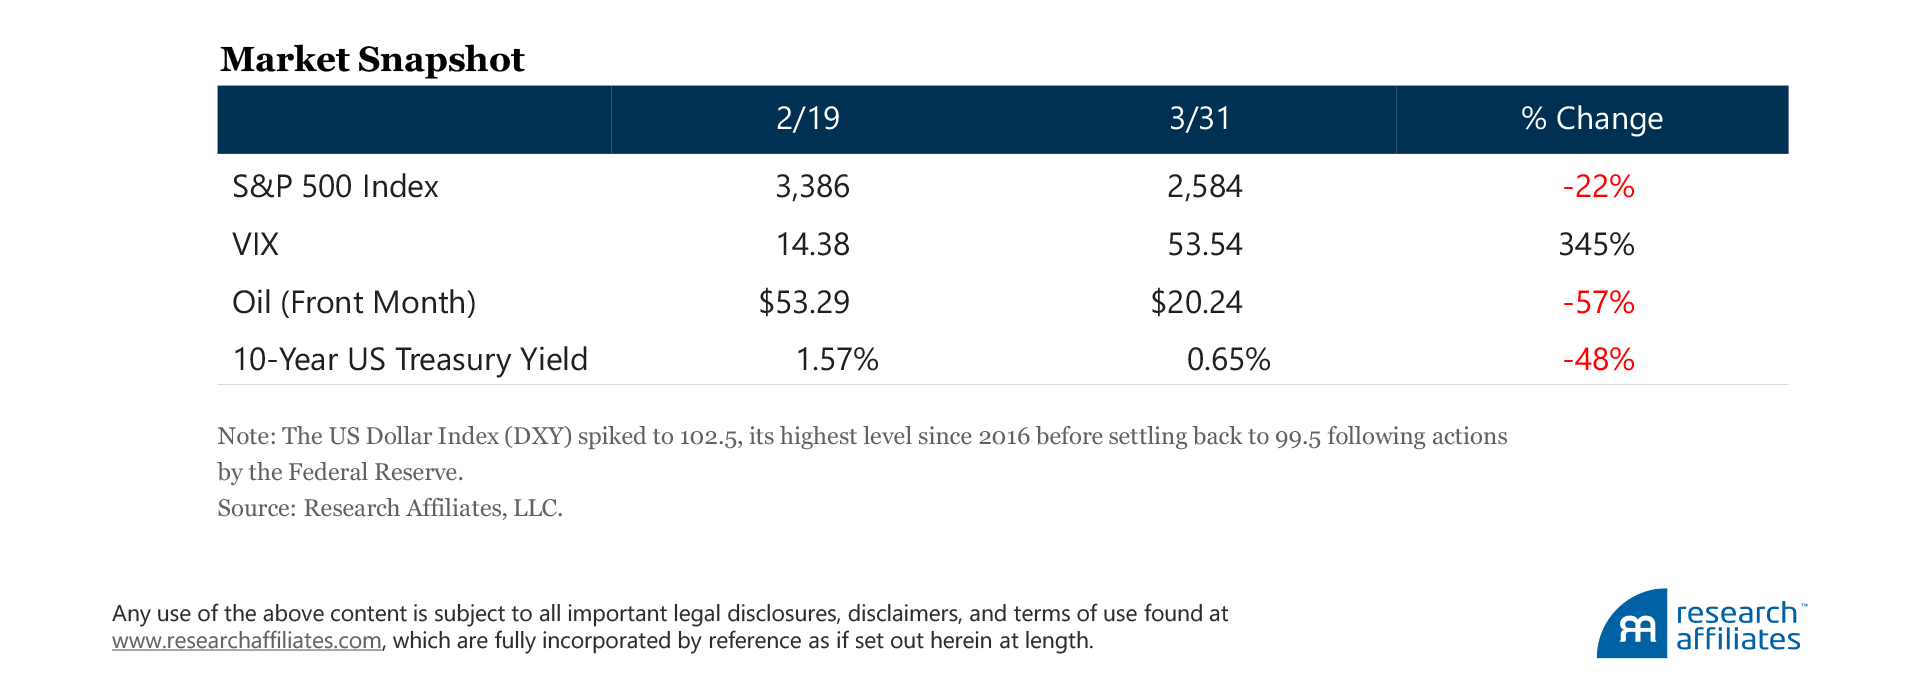
The S&P 500 Index hit an intraday all-time high just under 3,400 on February 19. From that point, the US equity market fell by 35% in just over four weeks—the fastest decline from an all-time high ever—before rebounding in the later days of March and closing out the quarter at just under 2,600. Ten-year US Treasury yields are now well below 1.00% and even 30-year yields briefly dipped below 1.00% on March 9.
As we are all aware, the US stock market has experienced the longest bull market in its history. The result has been historically expensive equity valuation multiples, such as the cyclically adjusted price-to-earnings (CAPE) ratio,1 which had topped 30 prior to the abrupt market crash. The CAPE reached this level only twice before in history, in 1929, and during the 1999–2000 tech bubble. These high valuations are correlated with low subsequent returns as valuations revert to lower historical averages as stock prices fall, driven by the reduced risk appetites of investors.
Although the coronavirus caught everyone by surprise as the catalyst of the market’s downturn, we have had low expectations for US equity performance for quite some time. Over the last five years, our 10-year real return (net of inflation) expectation for US equities has hovered around 1% a year.
Our models, of course, do not include a pandemic factor. They are based on market fundamentals that can be observed and on an assumption that certain market variables, such as valuation multiples, cannot rise or fall forever; in other words, we believe that the largest and most persistent investment opportunity is long-horizon mean reversion.
For long-term forecasting, taking advantage of these principles makes good economic sense, but our expected return forecasts also come with a warning label: Long-term expected returns, unto themselves, are not sufficient for short-term decision making. Ignoring this warning will most likely lead to impaired wealth.
Ten-year return forecasts offer valuable guidance to a buy-and-hold investor about the return they are likely to earn over the next decade. They provide no information, however, about when to buy or sell and do not identify a market top or bottom.
When a market corrects dramatically, say, 30%, long-term expected returns do not rise by the same 30%. To illustrate this point, let’s use the CAPE for the US market. The CAPE uses an average of real earnings per share over a rolling 10-year window, so we can assume the realized real EPS at the end of December 2019 is close to today’s value.2
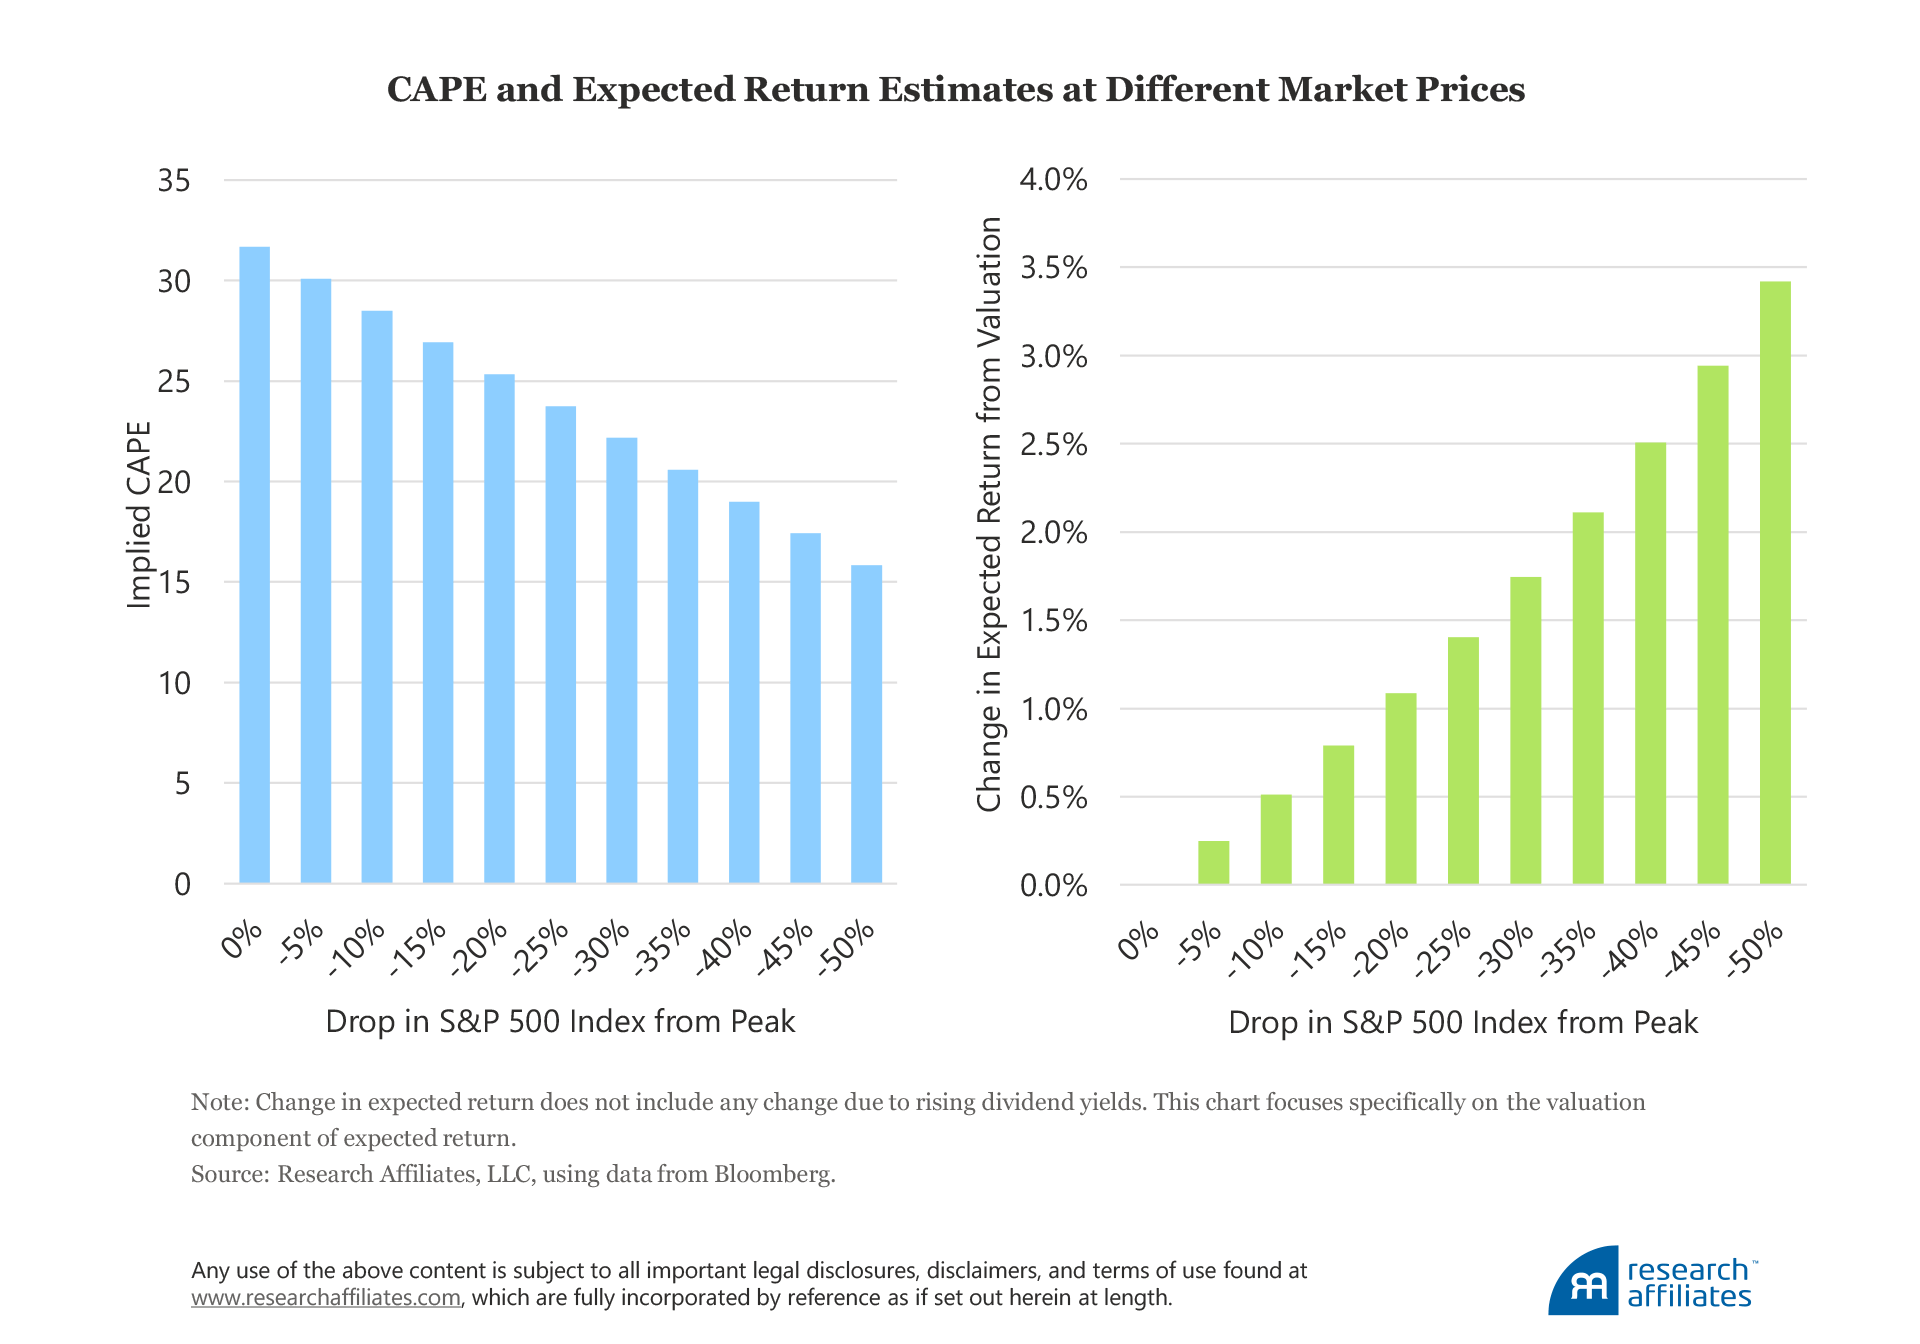
The bar charts show the implied level of CAPE and implied long-term expected return at various levels of drawdown from the S&P 500’s peak on February 19. A 30% pullback implies a CAPE level near 22 and an increase in expected return of 1.7% a year for the next decade because of lower valuations, assuming a long-term fair value multiple of 17, which we use in our models. For investors who believe the fair value multiple to be higher or lower than 17, these expectations will differ, but the point remains the same—the market’s drop translates into higher expected returns.
Like a Phoenix from the Ashes
Is this time different? Of course it is. Many companies will go bust, dividends will be slashed, many investment-grade bonds will morph into junk, foreign borrowers may default on their dollar-denominated debt, and so forth. Therefore, over the balance of the year, we will be alert to a few areas of potential concern:
- Yield: Yield alone is an insufficient indicator of future value. In the equity market many companies cut dividends in times of stress. In the high-yield bond market peak spreads may encourage investors to reach for yield. Reilly, Write, and Gentry (2009) pointed out that the experience of the global financial crisis, different from previous recessions, showed that peak defaults in high-yield bonds followed peak spreads by a matter of months. Defaults may be in the future for some of these bond issuers, especially energy companies facing extremely low energy prices and a rapidly slowing economy.
- Inflation: In the short term, we do not expect the recently passed stimulus bill, the Coronavirus Economic Stabilization Act of 2020, to be broadly inflationary. Pockets of consumer-led inflation may form, however, as Americans spend their stimulus checks. If everyone buys similar baskets of goods, heavy demand may push up those goods’ prices. From an investment perspective, break-even inflation has fallen off the table, hitting 0.50% on March 19 before rebounding toward 1.00%. Multi-year TIPS priced at break-even inflation today, may stumble in the very near term, but should perform well even in a subdued inflation environment.
- Foreign institution dollar-denominated debt defaults: With slowing supply chains and commodity, especially energy, prices suffering significant price declines, some non-US institutions that issue dollar-denominated debt may have a hard time making payments on that debt. Now is a time for extra caution and for thoroughly understanding the capital structures of these firms before purchasing their debt.
If we roll the clock forward five years, in the words of Ben Graham, how much of the market’s adjustment is newly discounted pricing and how much is a permanent loss of capital? The latter will likely escalate to exceed that of the Great Depression, but there will be much of the former as well.
Consider Schumpeter’s creative destruction. On balance, surviving companies will be the better capitalized with better ideas, products, client service, corporate culture, and management. They will face less competition and a clearer runway to take off in the aftermath of the crisis. They may well earn considerably greater profits than they did before.
Through our research, we are constantly evolving and enhancing the long-term models accessible on our site. The changing valuations resulting from current market fluctuations are impacting the output of these models—long-term expected returns for over 100 assets around the globe—which are readily available on the AAI tool (researchaffiliates.com/aai) on the Research Affiliates homepage.
The global pandemic will likely have far-reaching social and financial implications (“buybacks and bailouts” anyone?) that will be felt for years to come. This isn’t the first time our economy has suffered a self-induced recession to weather a greater storm (I am hearing analogies to World War II, but I certainly wouldn’t go that far), maybe more akin to the difficult recession necessary to break the back of suffocating inflation of the 1970s and early 1980s. The lesson is that we endure and that solid investing opportunities do exist.
For now, stay safe, and please reach out to us for insights that we believe can help you navigate these uncertain times.

Endnotes
- CAPE as defined by Robert Shiller also uses average monthly prices, not end-of-month prices, in the numerator.
- One extra quarter of data will not change the 10-year average all that much and because current earnings will most likely be lower than in the recent past, these data points will push the CAPE higher, away from historical averages.
Reference
Reilly, Frank, David Wright, and James Gentry. 2009. “Historic Changes in the High-Yield Bond Market.” Journal of Applied Corporate Finance, vol. 21, no. 3: 65–79.
