
Institutional investors, and the consultants on whom they rely to conduct manager searches and monitor investment results, have long regarded tracking error (TE) to a capitalization-weighted benchmark as the appropriate risk measure for their investments. To recall, TE is the standard deviation of the differences between investment and benchmark returns over the measurement period. A small TE indicates that the investment strategy has hewed closely to the benchmark. Thus, TE signals the manager’s willingness to express his views against the market consensus. The information ratio (IR) measures the value added per unit of TE taken by the manager. A high IR usually means a high signal-to-noise ratio in the manager’s “proprietary information” on securities.
Usually, substantial TE is to be expected in active investing. In fact, an active manager whose portfolio has an unusually small TE is often accused of “closet indexing”—a practice of holding benchmark-like portfolio weights in order to minimize the probability of large short-term underperformance, which would risk losing business. On the other hand, a low IR on a meaningful TE usually indicates a lack of actual skill. Generally, both low TE and low IR suggest that investors are likely to underperform the corresponding cap-weighted benchmark portfolio net of costs.
Smart beta indices, like actively managed strategies, also exhibit tracking errors to the cap-weighted index. The TE, in the context of smart beta, measures the amount of other sources of equity premium which have been injected into the portfolio. The TE for a fundamentals-weighted index is generated entirely from its allocation to low price stocks. The TE for a low volatility index is driven by the allocation to low beta stocks.
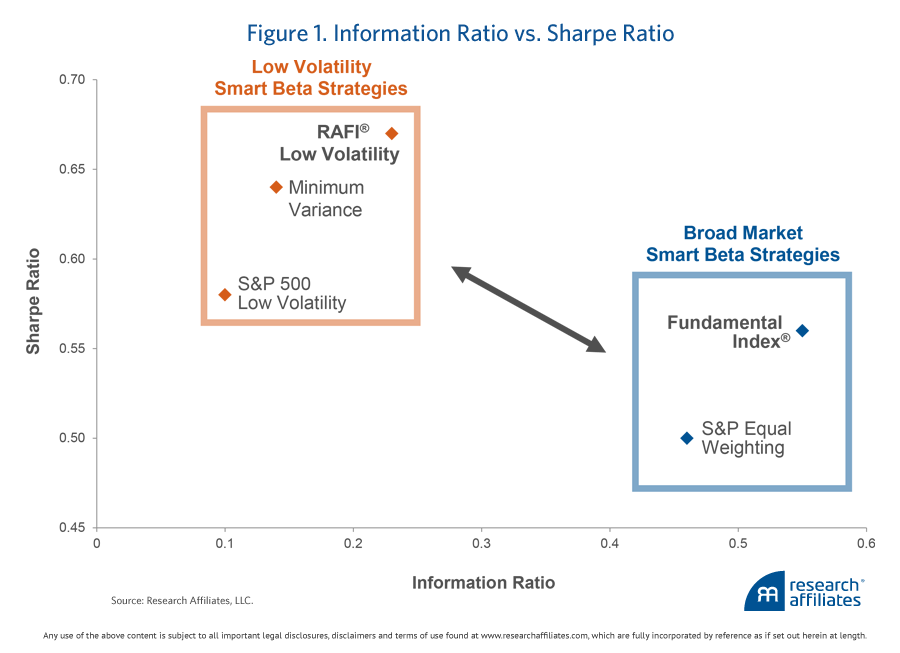
The IR for smart betas also takes on a very different meaning. Unlike its sense in active management, IR in the smart beta arena does not give information on the reliability of the different equity premiums. These sources of premium, such as value and low beta, are well studied, and there is very little ambiguity about their risk and return attributes. What the IR of a smart beta strategy informs us about is the amount of “equity market” beta contained in the types of stocks that contain the various equity premiums. Low beta stocks clearly contain low market beta and would produce large TEs. Value, momentum and small- and mid-size stocks do not have betas that are meaningfully different than unity, on average. The result is that value, momentum, and small size-oriented smart betas tend to have active TEs and high IRs (in the neighborhood of 0.5 for the U.S. and developed markets), whereas smart betas with a low-beta orientation tend to have exceptionally large TEs, driven by a portfolio beta of 0.7, and low IRs (in the neighborhood of 0.2).
The traditional interpretation of IR would argue that low volatility smart betas are bad strategies which are likely to underperform on a net-of-cost basis in the long run. This interpretation would be inappropriate for analyzing and evaluating smart beta performance. What it fails to account for is that low volatility smart betas are designed to maximize exposure to the Low Volatility premium, which would result in a high Sharpe ratio portfolio. The low volatility smart beta portfolio has a Sharpe ratio of 0.7, compared to a Sharpe ratio of 0.4 for the market portfolio. This suggests a superior tradeoff between volatility and beta risk, on one hand, and returns, on the other. Figure 1 displays these relationships.
In our view, TE to the cap-weighted benchmark can be an unsatisfactory measure of investment risk, especially when analyzing smart betas. Nonetheless, it is arguably an excellent metric for a certain kind of non-investment risk. If an organization’s policy dictates that the performance of the equity core should be measured against the cap-weighted benchmark, then large TEs signal an elevated level of career risk. For investment officers in this organization, the passive core needs to have a market beta of one. That is, the passive core will need to be substantially concentrated in the market risk factor. The other drivers of equity premium would complement the market factor, but cannot be permitted to overwhelm it; consequently, exposure to the low beta premium is nearly non-existent. Smart beta indices like a fundamentals-weighted index provide a solution that tilts toward value (with a limited small cap inflection) but register a beta close to unity. In fact, they are sometimes referred to as beta-one strategies.
For progressive organizations that are more attuned to the equity core’s risk-adjusted contribution to the overall investment program, the smart betas of choice would then reflect a more diversified allocation to the various drivers of equity premium. A promising mix might include significant exposure to the low volatility premium as well as incorporating exposures to the market, value, and small size premia.
SMART BETA SERIES

Part 1 - The Genesis of Smart Beta Investing

Part 2 - Strategy Indices and Smart Betas

Part 3 - Smart Beta, MPT, and Diversification

Part 4 - Smart Beta and Benchmark Risk

Part 5 - Smart Beta vs. Traditional Value Style Indices

Part 6 - Who Is On the Other Side of the Trade?

Part 7 - The Value Premium Is Mean-Reverting

Exploring Smart Beta
